! "
#$ !
%
% % %
!
I. INTRODUCTION
A great operation problem of the power equipment is the degradation of the isolation. The reliability of power plants can be improved by a preventive maintenance based on the condition assessment of the electrical insulation in the equipments. The isolation is degraded during the period in service due to the accumulation of mechanical, thermal and electric stresses.
Partial discharges (PD) are stochastic electric phenomena that cause a large amount of small shortcoming of the isolation. These discharges are generated inside the isolation system and are of small magnitude (pC) [1])[3].
PD are present in the transformers due to the gas dissolved in the oil, the humidity and other faults inside the equipment. PD cannot be avoided since the transformer is in service, but the problem appears when PD are generated by a localized fault in the isolation or are very frequent. These are signs of an imminent failure of the power equipment. Thus, the detection and location of the PD is an important tool of diagnosis.
This paper deals with the design of an algorithm that allows the processing of the time)series and the statistical analysis of the signals acquired in the framework of the MEDEPA test
Manuscript received March 12, 2010.
This work was supported by the Spanish Ministry of Science and Innovation, under the R&D projects No. DPI2006)15625)C03)01 and DPI2009)14628)C03)01 and the Research grant No. BES)2007)17322.
PD tests have been made in collaboration with the High Voltage Research and Tests Laboratory of Universidad Carlos III de Madrid (LINEALT) under DPI2006)15625)C03 project.
Jesus Rubio)Serrano is with the GOTL, Department of Electronic Technology, Carlos III University, Leganes, MADRID 28911 SPAIN (phone: +34)91)624)9431; e)mail: jrserran@ ing.uc3m.es).
Julio E. Posada is with the GOTL, Department of Electronic Technology, Carlos III University, Leganes, MADRID 28911 SPAIN (e)mail: jposada@ ing.uc3m.es).
Jose A. Garcia)Souto is with the GOTL, Department of Electronic Technology, Carlos III University, Leganes, MADRID 28911 SPAIN (e)mail: jsouto@ ing.uc3m.es).
bench in order to asses if the insulation is failing and where it happens.
The MEDEPA set)up is an experimental PD generation and measurement system designed in the University Carlos III of Madrid in order to study and develop electrical and ultrasonic sensors [4] and analysis techniques, which allow the characterization and the localization of PD.
A partial discharge is an electrical fast transient which produces a localized acoustic emission due to thermal expansion of the dielectric material [3]. A partial discharge generates also chemical changes, light emission, etcetera [5], [6]. In this work acoustic and electrical signals are processed together. Acoustic activity is characterized on the basis of the electric reference. Both methods of detection are put together to assess the condition of PD. The electro)acoustic conversion ratio of PD activity may also be explored by these means [7]. The paper is organized as follows. Section II presents the experimental set)up employed for the acquisitions. Section III describes the characteristics of the signals acquired. Section IV is devoted to the DSP tools used in the algorithm and section V details its flowchart. The results are presented in section VI. Finally, the conclusions and some details about future work are discussed in section VII.
II. EXPERIMENTAL SET)UP
All the measurements analyzed by the algorithm are taken from the MEDEPA experimental set)up of PD Generation. The purpose is to analyze the acoustic signals randomly generated by partial discharges and to detect them. Acquisitions at sampling rates up to 100MSps are performed and stored with different sensors, different sensor types and different kind of PD.
The set)up has three important blocks to generate and acquire PD signals:
1) : the experimental set)up generates
controlled partial discharges from a high)voltage AC excitation that is reliable for the ultrasonic sensor characterization and the acoustic measurements.
2) the
calibrated electrical measurement allows the correlation of generated partial discharges and provides their basic characteristics (charge, instant of time, etc.)
3) ultrasonic
PZT detectors are used for measuring the acoustic emission of partial discharges outside the tank. Fiber)optic sensors are being developed for measurements inside [4].
Digital Signal Processing for the Detection and
Location of Acoustic and Electric Signals from
Partial Discharges
The MEDEPA experimental set)up of PD generation has the following characteristics:
1) Repetitiveness of the PD tests.
2) Mechanical)acoustical set)up adapted to the use of acoustic PZT sensors.
3) Simultaneous measurements and comparison of results with different electrical and acoustical sensors.
The ultrasonic sensors (R15I, 150 KHz, ~1V/Pa, EPA) for acoustic studies are externally mounted on the tank walls. They are adapted to the environments next to the transformers and the electrical facilities. The electrical measurements of the PDs are done with a wide)band ferrite of 10 MHz. Additional instrumentation is also provided for the electrical measurements of partial discharges and the analysis of them.
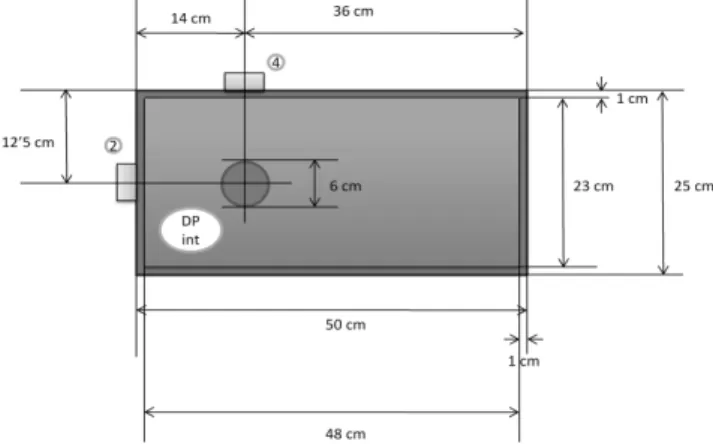
Fig. 1. Experimental set)up for acoustic detection and location
The MEDEPA experimental set)up is an oil)filled chamber with immersed electrodes that generate partial discharges. Once the partial discharge produces an acoustic emission, the signals travels through the oil and through the PMMA wall to the acoustic sensor R15I. As an approximation the sound velocity is considered t 1’5mm/Ls in oil and 2’8mm/Ls in the PMMA wall.
The mechanical and acoustic parts of the experiment are represented in figure 1. The circle inside the tank is the internal PD generator which consists of two cylindrical electrodes of 6 cm of diameter that are separated by several isolating paper layers. High)voltage AC @ 50Hz is applied between 4’3KV – 8’7 KV, so discharges in the range of 100 pC and more are generated.
Fig. 2. PD single event observation. Electric (top) and acoustic (bottom).
The expected signals for this experiment are one single electric signal for one single acoustic signal, as it is shown in figure 2. The delay is calculated between the electrical and acoustic signals to locate spatially the PD source.
Each PD event produce an electric charge displacement that is observed as a short)duration pulse of current (100 ns).
The electric and acoustic signals generated by the PD are registered by a system of four synchronized channels. The electric pulses are detected in the generation circuit; the acoustic signals are detected with acoustic sensors (channels 2 and 4) that are placed in front of the electrodes at the same height on two different walls of the tank.
If each electric signal would be alone as it is observed in figure 2, an acoustic signal is produced at least as a consequence. The distance is deduced from the propagation time to each acoustic sensor. Several sensors are used to obtain the localization of the PD source and the electro)acoustic identification of PD. Electric transient signal is shorter and faster than the detected acoustic burst.
III. SIGNALS CHARACTERISTICS
There are some difficulties to consider when PD are detected by electric and acoustic means. They are associated to the phenomena (stochastic generation) and to the electric and acoustic detection limits (signal level, signal identification and signals pairing and matching).
As the PD are stochastic events it’s no possible either to synchronize with any reference signal, nor to average on the bases of this synchronism. So the acquisitions are made in two different ways: the first one is to acquire long time random signals and the second way consists of segmented acquisitions when an acoustic or electric signal exceeds a threshold level. The acoustic signal is the reference generally because the transient burst is less frequent and is more individual than the electric transient pulses are. Thus, prior to processing the time series there is no certainty on the number of PD in the acquired signal.
In order to detect the acoustic signals the difficulties associated to the acquisition are low signal levels and signal waveform distortion due to the path propagation. In addition to the low magnitude of the acoustic emission, it is attenuated when crosses the electrodes, the insulation media (oil and paper) and the tank walls. The angle of incidence of the acoustic signal is also important because the reflections on the wall depend on it. Moreover, the acoustic signal may be neglected or distorted outside if it is above the critical angle.
The characteristics of the acoustic waveform may vary also because of the reverberation and acoustic interference. In this experiment the reverberation for the normal incidence on the wall is about seven microseconds and its frequency is about 140 KHz so the signal detected by the sensor is distorted. The distortion of the signal depends on the angle of incidence through the related crossed distance, on the acoustic interference of two signals that are closely generated and on the interference with the rebounds of an earlier signal. Thus, in order to compare acoustic and electric signals only the partial discharges which are generated in the same place may be compared.
Electric signals have enough amplitude but are difficult to be detected in transformers because of the noisy environment in the real application. In the controlled experiment a much better signal to noise ratio is assured for the electric measurements.
may be generated during the equivalent time of an acoustic signal. Besides, the acoustic emission of the PD could be negligible due to the attenuation and distortion produced by the interference.
As a consequence, in addition to the conditioning, classification and location of each PD individual signal, this approach is to match the combined electro)acoustic detection. Therefore, the algorithm is also designed to decide which electric signal is associated to the detected acoustic signals.
IV. DIGITAL SIGNAL PROCESSING TOOLS
A combination of several DSP tools is used in the algorithm as follows:
The purpose of the use of this technique is to denoise automatically the acquired signals. This technique resolves a signal as a sum of wavelet decompositions (D) and approximations (A):
∑
=+ =
1 (1)
Each approximation and decomposition has their band)width associated to the employed wavelet and its order. With this technique the signals are filtered in time domain but not delayed as a difference with conventional digital filters.
This tool is used in combination with the Pearson product)moment correlation coefficient (PMCC) to identify and select which order of the decompositions, and therefore the signal band)width, have the main information of the pattern and the acquired signal [8],[9]. Filtered patterns and signals are the sum of the selected decompositions.
! !
The cross)correlation is a measure of similarity of two waveforms as a function of a time)lag applied to one of them. The maximum of the cross)correlation contributes with two significant parameters: a good comparison of the signal with the pattern and the associated instant of time when the signal is detected. So cross)correlation is used for detection and localization of the signals emitted by PD. Cross correlation is defined as:
(
)( )
∫
∞( )
(
)
∞ − ∗ ⋅ + ⋅ =∗ τ τ !τ (2)
One of the characteristics of the cross)correlation is that it depends on the energy and the waveform of the signals involved. In order to find the desired pattern independently of the energy the cross)correlation is used to find the time)windows and the instant of time of the event (local maximum of the cross)correlation). Afterwards the PMCC is used as a filter that estimates if the window is of a valid signal or not.
" !
# $
The Pearson correlation coefficient is a statistical index that measures the linear relation between two quantitative variables. The advantage of the Pearson coefficient against
the maximum value of cross)correlation is that it is normalized and independent of the energy.
The linear correlation coefficient of Pearson for discrete signals is defined as:
(
) (
)
(
)
∑
(
)
∑
∑
= = = − ⋅ − − ⋅ − = ⇒ ⋅ = = % & &% ' ' ( ( ' ' ( ( 1 2 1 2 1 σ σ σ (3) Where• xy is the covariance of x and y
• x y y are the standard deviations of x and y respectively
Finally, &''can take values between [)1, 1]; where:
•If r = 0 then there isn’t linear relation between x and y.
•If |r| = 1 then x and y are the same signal although the energy of the signals were different.
•If 0 < r ≤ 1 then the signals are in phase.
•If 0 > r ≥ )1 then the signals are out of phase. V. DIGITAL SIGNAL PROCESSING
The main objective of the algorithm is to analyze a series of acquisitions in order to evaluate statistically the PD and their characteristics (PMCC and energy of each event, energy relation between electric and acoustic emissions, and the delays). Figure 3 shows the flowchart.
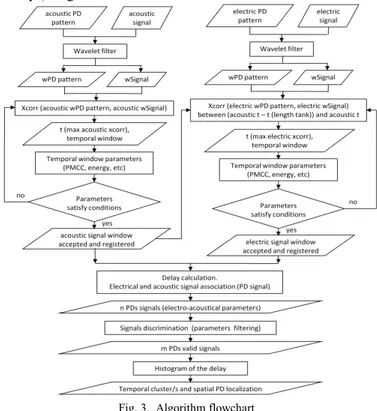
Fig. 3. Algorithm flowchart
On the top, there are two input arguments for each channel: the pattern and the acquired signal.
the PMCC, because it provides the following parameters: waveform, frequency and duration of the desired signal.
Once the pattern of each channel is filtered and conditioned, all acquisitions are individually processed.
Each acoustic acquisition is compared with the acoustic pattern through the cross)correlation. The maximum values of the cross correlation are associated to the signals of the same duration of the pattern and a combination of similar waveform and energy; so, in order to avoid signals with high energy and low PMCC, the PMCC value of the maximum points of the cross correlation should exceed a threshold. Then, the algorithm analyzes the top ten highest maximum cross correlation values and saves those points which satisfied the condition of the PMCC.
The point of maximum value of the cross correlation provides a good estimator for the quality of detection and two additional parameters: the instants when the signal begins and ends; that’s, the temporal window of the acquisition that is similar to the pattern. Finally, other parameters (energy, amplitude, PMCC, etcetera) are stored for statistical analysis. Next step is the cross)correlation of the electric signals. It’s similar to the acoustic processing but there are two differences. In electric signals the maximum absolute value of the cross)correlation is searched instead of the maximum value. Negative or positive values of the cross)correlation are associated to a different phase of the power line voltage. If the value of the cross)correlation is negative, the PMCC is negative too so PMCC is evaluated with its absolute value.
The second difference is for avoiding electric signals that cannot be associated temporally to acoustic signals. So the search in the electric acquisitions is limited between the instant when the acoustic signal starts and a period of time before. This temporal window corresponds with the time that the acoustic signal needs to cross the tank (in this case, the length of the temporal window is 350Ls cause the speed of sound in oil is approximately 1’4mm/Ls and the length of the tank is 500mm).
Once the electric and the acoustic signals of the acquisition are obtained then each acoustic signal is matched with those electrical signals which are between the times defined before as a valid delay. Some acoustic signals can be repeated associated to different electric signals. In this case, if two or more signals of one channel are associated to the same signal in other channel the cross)correlation is used for discriminating which of the signals is selected.
When the database of the partial discharges is obtained, a histogram of the delay of the PD signals is represented in order to analyze the incidence of the parameters. It’s expected that the delays with high incidence corresponds to a fault in the insulation.
Finally, once a group of PD signals are considered as being generated in the same source or insulation fault, it is studied if a deterministic relation between other parameters exists (for example: PMCC of the acoustic signals and electric signals, and the electro)acoustic energy ratio) to obtain complex information (the source of the emission or the acoustic field along the path).
VI. EXPERIMENTAL RESULTS
This algorithm has been applied for processing the acquisitions that were taken on MEPEPA set)up (figure 1). In
this experiment, 76 series of acoustic and electric signals were acquired simultaneously. Each time series is approximately 8 milliseconds and is sampled at 100 MSps.
First electric and acoustic patterns, of the same PD, were selected and filtered with the wavelet filter (fig. 4).
Fig. 4. Electric pattern (top) and acoustic pattern (bottom)
The electric pattern is a fast transient of about 7 MHz and its duration is 1 Ls approximately. The acoustic signal length is 35 Ls and its central frequency is 150 KHz.
A limitation of the selected pattern is the reverberation of the acoustic signal that is detected through the wall. For normal incidence of the acoustic signal on the PMMA wall (sound velocity of 2’8 mm/Ls), the reflected signal takes 7 Ls to reach the detector again (20 mm). That’s the reason of the distortion of the acoustic signal from 7 Ls onwards.
Once the patterns are selected and filtered each and every acquired signal series were filtered, processed with the cross correlation and analyzed with the PMCC as following.
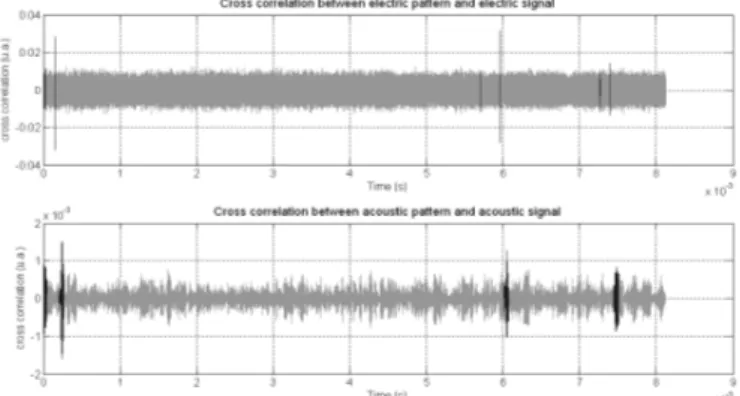
Fig. 5. Electric (top) and acoustic (bottom) cross correlations calculated. Temporal windows founded are remarked.
The results of the acoustic and electric cross correlation are shown in figure 5, and the maximum values are remarked in black. The events are also characterized by the index and waveform of the signals found in the time series (fig. 6).
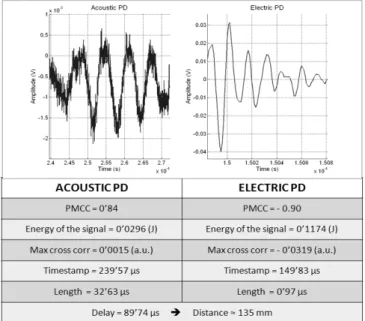
Finally, acoustic and electric signals are matched and the parameters of all signals are calculated. In figure 7 there is an example of one of the paired)signals found by the algorithm and their parameters. Among the 1642 possible pairs of electric and acoustic signals, only 164 signals are selected by the algorithm as valid PD signals.
Fig. 7. Example of one partial discharge obtained
Now, signals can be classified by their delays. In the experiment, there are some valid values with an incidence of four or more. The delay of maximum incidence is 102 Ls (figure 8). If the speed of sound in oil is 1500 m/s, the signal’s source is at 15’3 cm approximately from sensor 2 which is in the range of the expected values.
In future work, it will be examined the relation between energy and the PMCC as a function of their location. The goal is to find and discriminate partial discharges not only for its location but also for its expected values of energy and PMCC.
Fig. 8. Histogram of the delays obtained with filtered PDs (steps of 1Ls)
VII. CONCLUSIONS ANDFUTURE WORK
The algorithm is a valid tool in order to detect, to parameterize and to obtain temporal windows of PD. This is important because the final objective is to parameterize the signals and to define the ranges of these parameters in order to locate and classify partial discharges in transformers.
This algorithm has been used with internal partial discharges and external acoustic sensors (150 KHz). The DSP tools used in the algorithm will be extended for superficial partial discharges and internal acoustic fiber)optic sensors.
The proposed algorithm can detect and identify PD signals from different kind of sensors. It matches these signals and locates the source of the signal through a multi)sensor statistical analysis approach instead of the single event approach. A main feature of the employed DSP tools is that they do not alter the temporal characteristics of the signal.
Two limitations were found to the present algorithm: 1) The off)line approach and the intensive)computation
load that limits its use for real)time application;
2) The selection of the best pattern, so a database of patterns is being performed for each kind of sensor.
Although the algorithm is not still designed for real)time use, after the temporal series are processed, their parameters are stored in a small database. Therefore, statistical data processing and PD representation are immediate with this architecture.
Future work deals with the improvement and extension of the DSP and PD analysis. As discussed before, the aim of this paper is the algorithm that allows the statistical analysis of the signals acquired in the MEDEPA framework. The purpose is to locate, identify and parameterize PD.
In order to improve the algorithm’s signal detection and identification, the next step is the calibration of the tool with different kind of PD activities (types, intensities and sources) and the statistical analysis of the parameters in the database. In addition to the time location and the pattern)matching, other parameters will be considered to assess the probability of PD: frequency, 3)D location, energy and PMCC.
PD source localization is of main concern in the application of acoustic emission. The objective is to implement a 3)D algorithm compatible with the designed tools, either with external sensors, or with internal sensors.
Finally, the electro)acoustic conversion ratio of PD activity is an open research line with the implemented statistical analysis [7].
ACKNOWLEDGMENT
PD tests have been made in collaboration with the High Voltage Research and Tests Laboratory of Universidad Carlos III de Madrid (LINEALT).
To Daniel C. Gallego for his support with the processing. REFERENCES
[1] R. Bartnikas, “Partial Discharges: their mechanism, detection and measurement”, IEEE Transactions on Dielectrics and Electrical Insulation Vol. 9 No. 5, October 2002
[2] R.J. Van Brunt, “Stochastic properties of partial discharges
phenomena”, ) October
1991, Vol.26, No.5
[3] L. E. Lundgaard, “Partial Discharge – Part XIV: Acoustic Partial Discharge Detection – Practical Application”,
* September/October 1992, Vol.8, No. 5 [4] Carlos Macia)Sanahuja, Horacio Lamela, Jesús Rubio, Daniel Gallego,
Julio E. Posada, Jose A. Garcia)Souto, “Acoustic detection of partial discharges with an optical fiber interferometric sensor”, IMEKO TC 2 Symposium on Photonics in Measurements 2008
[5] ! + ! ,
+ - ! . ) !
/ #0112$ IEEE Power Engineering Society
[6] A. Santosh Kumar1, Dr. R.P. Gupta, Dr. K. Udayakumar, A.Venkatasami, “Online Partial Discharge Detection and Location Techniques for Condition Monitoring of Power Transformers: A
Review”, ! !
[7] P. von Glahn, K. L. Stricklett, R. J. Van Brunt, L. A. V. Cheim, “Correlations between electrical and acoustic detection of partial discharge in liquids and implications for continuous data recording”, Electrical Insulation, June 16)19, 1996, Vol.1, pag. 69)74
[8] X. Ma, C. Zhou, and I. J. Kemp, “Automated wavelet selection and thresholding for PD detection” , IEEE Electrical Insulation Mag., vol. 18, no. 2, pp. 37–45, Mar./Apr. 2002
[9] G. Keppel and S. Zedeck, ' / +
4 ' 5 ! " / 6