HESSD
10, 5767–5798, 2013Evaluating the effect of partial contributing
storage
X. Chen and D. Wang
Title Page
Abstract Introduction
Conclusions References
Tables Figures
◭ ◮
◭ ◮
Back Close
Full Screen / Esc
Printer-friendly Version
Interactive Discussion
Discussion
P
a
per
|
Dis
cussion
P
a
per
|
Discussion
P
a
per
|
Discussio
n
P
a
per
|
Hydrol. Earth Syst. Sci. Discuss., 10, 5767–5798, 2013 www.hydrol-earth-syst-sci-discuss.net/10/5767/2013/ doi:10.5194/hessd-10-5767-2013
© Author(s) 2013. CC Attribution 3.0 License.
Geoscientiic Geoscientiic
Geoscientiic Geoscientiic
Hydrology and Earth System
Sciences
Open Access
Discussions
This discussion paper is/has been under review for the journal Hydrology and Earth System Sciences (HESS). Please refer to the corresponding final paper in HESS if available.
Evaluating the e
ff
ect of partial
contributing storage on
storage–discharge function from
recession analysis
X. Chen and D. Wang
Department of Civil, Environmental, and Construction Engineering, University of Central Florida, 4000 Central Florida Blvd., Orlando, FL 32816, USA
Received: 24 April 2013 – Accepted: 26 April 2013 – Published: 7 May 2013
Correspondence to: D. Wang ([email protected])
HESSD
10, 5767–5798, 2013Evaluating the effect of partial contributing
storage
X. Chen and D. Wang
Title Page
Abstract Introduction
Conclusions References
Tables Figures
◭ ◮
◭ ◮
Back Close
Full Screen / Esc
Printer-friendly Version
Interactive Discussion
Discussion
P
a
per
|
Dis
cussion
P
a
per
|
Discussion
P
a
per
|
Discussio
n
P
a
per
|
Abstract
Hydrograph recession during dry periods has been used to construct water storage– discharge relationship, and to quantify storage dynamics and evaporation when streamflow data is available. However, variable hydrologic connectivity among hillslope-riparian-stream zones may affect the lumped storage–discharge relationship, and as 5
a result, affect the estimation of evaporation and storage change. Given observations of rainfall and runoff, and remote sensing-based observation of evaporation, the ratio (α) between estimated daily evaporation from recession analysis and observed evap-oration, and the ratio (β) between estimated contributing storage and total watershed storage are computed for 9 watersheds located in different climate regions. Both evap-10
oration and storage change estimation from recession analysis are underestimated due to the effect of partial contributing storage, particularly when the discharge is low. It was found that the values of α decrease significantly during individual recession events, while the values ofβare relatively stable during a recession event. The values ofβare negatively correlated with the water table depth, and vary significantly among 15
recession events. The partial contributing storage effect is one possible cause for the multi-valued storage–discharge relationship.
1 Introduction
The physical control of climate, vegetation, soil, and topography on water balance is an important research question in watershed hydrology. A comprehensive understanding 20
of water balance dynamics is a challenge partly due to the fact that evaporation and water storage data are limited in many watersheds. Evaporation is controlled by com-plex factors such as atmospheric condition, vegetation, and water availability. With the advancement of measurement technology, evaporation can be estimated by utilizing remote sensed data which covers large spatial scales with high resolution (Mu et al., 25
HESSD
10, 5767–5798, 2013Evaluating the effect of partial contributing
storage
X. Chen and D. Wang
Title Page
Abstract Introduction
Conclusions References
Tables Figures
◭ ◮
◭ ◮
Back Close
Full Screen / Esc
Printer-friendly Version
Interactive Discussion
Discussion
P
a
per
|
Dis
cussion
P
a
per
|
Discussion
P
a
per
|
Discussio
n
P
a
per
|
are due to the spatial variability of soil moisture and groundwater storage. Terrestrial water storage changes can be identified by monitoring the variability in gravity field through Gravity Recovery and Climate Experiment (GRACE) satellite (Swenson et al., 2006). However, the spatial resolution of GRACE is too large to be applicable for water-shed scale studies. Water storage changes can also be estimated by using point-based 5
observations of groundwater level and soil moisture (Wang, 2012a) or water balance closure (Sayama et al., 2011; Wang and Alimohammadi, 2012). These methods are constrained by the data availability of soil moisture, groundwater and actual evapora-tion.
The conceptual storage–discharge function derived from base flow recession has 10
been used to estimate storage changes (e.g., Kirchner, 2009; Teuling et al., 2010; Ajami et al., 2011; Krakauer and Temimi, 2011), evaporation (e.g., Szilagyi et al., 2007; Palmroth et al., 2010), and leakage from and to bedrock (Wang, 2011). The estimated evaporation and water storage dynamics from the lumped storage–discharge relation-ship are usually treated as the total values of the entire watershed. The underlying as-15
sumption is that all the subsurface storage in the watershed contributes to the stream-flow observed at the outlet (Wang, 2012b). The violation of this assumption may affect the evaporation and storage change estimation significantly, especially in large water-sheds with considerable spatial heterogeneity of soil water storage.
During dry periods, not all the landscape components (hillslope, riparian and stream 20
zones) are hydrologically connected to the watershed outlet and further contribute to the observed base flow. In subsurface hydrology, spatial heterogeneity of hillslope-riparian-stream zones has been found to be important for water table response to pre-cipitation (Vidon, 2012) and base flow recession behavior (Clark et al., 2009; Harman et al., 2009). Moreover, at the plot scale, the water table dynamics can be independent 25
HESSD
10, 5767–5798, 2013Evaluating the effect of partial contributing
storage
X. Chen and D. Wang
Title Page
Abstract Introduction
Conclusions References
Tables Figures
◭ ◮
◭ ◮
Back Close
Full Screen / Esc
Printer-friendly Version
Interactive Discussion
Discussion
P
a
per
|
Dis
cussion
P
a
per
|
Discussion
P
a
per
|
Discussio
n
P
a
per
|
recession and the spatial organization of stream network with a focus on the contraction of active stream network. Even in the active stream network, the hydrologic connectiv-ity of riparian and upland zones to channel may decrease during dry periods (Ocampo et al., 2006; Molenat et al., 2008). Some river reaches may even become entirely de-tached from the riparian zone at very low flows owing to obstruction of the channel by 5
vegetation (Blyth and Rodda, 1973). Riparian zones are the interfaces between hill-slope and stream, and the water table fluctuations in riparian zones are usually not significant (Jencso et al., 2009). Even within hillslope or riparian zones, bedrock de-pressions can be disconnected during low flow periods (McDonnell et al., 1998; Buttle et al., 2004; Tromp-van Meerveld and McDonnell, 2006a,b).
10
Since the hydrologic connectivity between hillslope, riparian, and stream zones varies with time, the storage–discharge function may also vary when total watershed storage is used in the lumped discharge model. The variable characteristic of storage– discharge function has been reported by several studies (e.g., Rupp et al., 2009). Us-ing a linearized distributed model, Sloan (2000) found that total water storage and 15
groundwater discharge is not a one-to-one relationship. Hysteresis relation between storage and streamflow has been reported due to the variable hydrologic connectivity of water storage (Spence et al., 2010). Clark et al. (2011) demonstrated that a multi-valued storage–discharge relationship could be replicated by a simple lumped con-ceptual model with two parallel stores representing the saturated zone. Krakauer and 20
Temimi (2011) reported that storage change estimated from base flow recession is underestimated compared with GRACE based estimation.
The objective of this study is to evaluate the effect of partial contributing storage caused by variable subsurface hydrologic connectivity on the water storage–discharge relationship derived from recession analysis. In this paper, the estimation of evapora-25
HESSD
10, 5767–5798, 2013Evaluating the effect of partial contributing
storage
X. Chen and D. Wang
Title Page
Abstract Introduction
Conclusions References
Tables Figures
◭ ◮
◭ ◮
Back Close
Full Screen / Esc
Printer-friendly Version
Interactive Discussion
Discussion
P
a
per
|
Dis
cussion
P
a
per
|
Discussion
P
a
per
|
Discussio
n
P
a
per
|
estimated contributing storage and total watershed storage are computed for the 9 study watersheds, and their temporal variability are discussed.
2 Methodology
2.1 Recession analysis
Hydrograph recession analysis is usually utilized to derive water storage–discharge 5
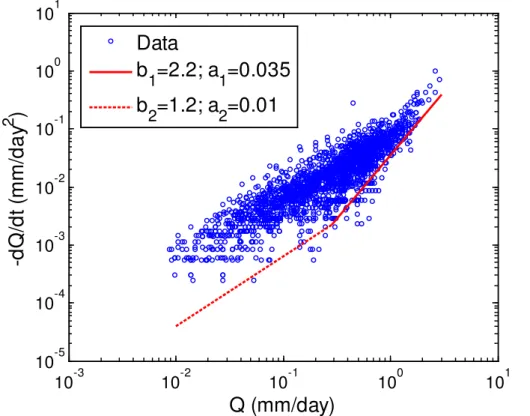
functions at the watershed scale. The recession analysis method proposed by Brutsaert and Nieber (1977) is to plot recession slope (−dQ/dt) as a function of
dis-charge (Q). This method facilitates the analysis on a collective of recession events, and the impact of recession starting time on parameter estimation is minimized. As proposed by Brutsaert and Nieber (1977), the relationship between recession slope 10
and discharge can be modeled as a power function:
−dQ
dt =aQ
b (1)
Exponentbis dimensionless and the unit ofadepends on the value ofb.Q(mm d−1) is groundwater discharge per unit watershed area. The data pairs (−ddQt, Q) can be computed by the difference of discharges in consecutive days (Qt−Qt+1) and the
av-15
erage discharge ((Qt−Qt+1)/2), respectively (Brutsaert and Nieber, 1977). Recession
periods were selected when there was no rainfall. As an example, the data pairs (−ddQt, Q) for the Spoon River watershed are plotted in Fig. 2.
Based on the plot of−ddQt versusQon log-log space, the function of−ddQt =f(Q) and
further the storage–discharge function can be constructed. Several methods have been 20
HESSD
10, 5767–5798, 2013Evaluating the effect of partial contributing
storage
X. Chen and D. Wang
Title Page
Abstract Introduction
Conclusions References
Tables Figures
◭ ◮
◭ ◮
Back Close
Full Screen / Esc
Printer-friendly Version
Interactive Discussion
Discussion
P
a
per
|
Dis
cussion
P
a
per
|
Discussion
P
a
per
|
Discussio
n
P
a
per
|
power function in Eq. (1) was not assumed a priori. Since the recession rate of ground-water discharge is smaller than other storage components, Brutsaert and Nieber (1977) proposed to place the fitted line at the lower envelope of the data points. The effect of evaporation on recession parameter estimation is minimal at the lower envelope. In this study, the lower envelope method is used for estimating the recession parameters 5
aandb.
When rainfall is zero and the net groundwater flux from outside the watershed is negligible, the water balance equation during recessions can be written as:
dS
dt =−Q−E (2)
whereS(mm) is the depth of water storage per unit watershed area.Sis the water stor-10
age contributed to observed base flow at the outlet but normalized over the entire wa-tershed area. Therefore,E (mm) is also the depth of evaporation from the contributing storage but normalized by the watershed area. BothS andE are not the correspond-ing total values in the entire watershed. The storage–discharge function derived from hydrograph recession is a conceptual lumped model. The unsaturated and saturated 15
zones are modeled by one storage term. Therefore, evaporation in Eq. (2) is assumed for the total value from unsaturated and saturated zones (Szilagyi et al., 2007; Kirch-ner, 2009; Palmroth et al., 2010). The recession parameters can be estimated at the lower envelope where the impact of evaporation is minimal (Fig. 2). Correspondingly, the storage–discharge relation is obtained:
20
dS=1aQ1−bdQ (3)
Substituting dS into Eq. (2), evaporation can be estimated based on the observed recession slope and discharge (Palmroth et al., 2010):
E=−dQ/a dtQ1−b
HESSD
10, 5767–5798, 2013Evaluating the effect of partial contributing
storage
X. Chen and D. Wang
Title Page
Abstract Introduction
Conclusions References
Tables Figures
◭ ◮
◭ ◮
Back Close
Full Screen / Esc
Printer-friendly Version
Interactive Discussion
Discussion
P
a
per
|
Dis
cussion
P
a
per
|
Discussion
P
a
per
|
Discussio
n
P
a
per
|
The effect of evaporation on hydrograph recession has been reported in many wa-tersheds (Federer, 1973; Daniel, 1976). The seasonal variability of recession rate is caused by seasonal pattern of evaporation (Wittenberg and Sivapalan, 1999).
During the late recession, the exponentb2is usually less than 2, and the contributing
storage is obtained by integrating Eq. (3): 5
S=Sm+
Q2−b2 a2(2−b2)
(5a)
Sm is interpreted as the minimum storage for generating base flow. During the early
recession, the exponent b1 is usually larger than 2 and the contributing storage is
computed as:
S=Sc+
Q2−b1 a1(2−b1)
(5b) 10
Scis interpreted as the storage capacity (Kirchner, 2009). Storage and discharge func-tions by Eq. (5), which are estimated from recession analysis as shown in Fig. 2, are usually assumed to be one-to-one relationships.
Discharge at the transition point from early to late recessions is a function of reces-sion parameters:
15
Q∗
0=
a
2
a1
b 1 1−b2
(6)
For the parameters in Fig. 2,Q∗
0is 0.29 mm d− 1
for the Spoon River watershed. IfQ > Q∗
0, the recession is at the early stage. Otherwise, it is at the late stage. According to
Eq. (5), the storage capacity can be computed givenSmandQ∗0:
Sc=Sm+
Q∗
0 2−b2
a2(2−b2)
−
Q∗
0 2−b1
a1(2−b1)
HESSD
10, 5767–5798, 2013Evaluating the effect of partial contributing
storage
X. Chen and D. Wang
Title Page
Abstract Introduction
Conclusions References
Tables Figures
◭ ◮
◭ ◮
Back Close
Full Screen / Esc
Printer-friendly Version
Interactive Discussion
Discussion
P
a
per
|
Dis
cussion
P
a
per
|
Discussion
P
a
per
|
Discussio
n
P
a
per
|
Storages at the late and early recessions are computed by Eqs. (5a) and (5b), respec-tively.
As discussed earlier, due to the effect of partial contributing storage, S in these equations is the contributing storage normalized by the watershed area. The ratio of contributing storage to total storage is represented byβ:
5
β= S
TS (8)
where TS (mm) is the total depth of water storage per unit watershed area. Similarly, the ratio of evaporation estimated by Eq. (4) to total evaporation is represented by:
α= E
TE (9)
where TE (mm) is the total evaporation per unit watershed area. The variablesα and 10
βcan be interpreted as the fraction of the watershed underlain by aquifers that con-tributes to streamflow (Brutsaert and Nieber, 1977). The values ofα and β are indi-cators of hydrologic connectivity among hillslope-riparian-stream zones. The variability ofβ, such as seasonal variation, is one potential factor for variable storage–discharge functions, TS=f(Q), at the watershed scale.
15
2.2 Estimation ofα andβ
In order to explore the impact of the variable contributing storage on the storage– discharge relationship, the values ofα and β are estimated in the study watersheds. At each individual recession event,αis estimated as the ratio between estimated daily E by Eq. (4) and observed daily evaporation (Eobs) based on remote sensing data 20
HESSD
10, 5767–5798, 2013Evaluating the effect of partial contributing
storage
X. Chen and D. Wang
Title Page
Abstract Introduction
Conclusions References
Tables Figures
◭ ◮
◭ ◮
Back Close
Full Screen / Esc
Printer-friendly Version
Interactive Discussion
Discussion
P
a
per
|
Dis
cussion
P
a
per
|
Discussion
P
a
per
|
Discussio
n
P
a
per
|
days,S(t1) andS(t2), are computed by Eq. (5). The total watershed storage change is
equal to discharge and total evaporation:
TS(t1)−TS(t2)=Q(t2)+TE(t2) (10)
Combining Eqs. (8) and (10), the contributing storage parameter att2is computed by:
β(t2)=
S(t2)
S(t1)/β(t1)−Q(t2)−TE(t2)
(11)
5
At the onset of the recession event (t1), the value of βis assumed to be equal to the
average ofα during the recession, since α and β are both majorly controlled by the variation of contributing storage in the watershed. This assumption is used to deter-mining the initial value ofβ in a recession event. The uncertainty of the initialβ does not affect the generalization of the findings.
10
2.3 Data selection andSm
The analysis in this paper is based on recessions during the period from April to Oc-tober in order to focus on the rainfall events. The following criteria are used to filter recession segments: (1) declining streamflow; (2) no rainfall during recession; (3) re-cession event is longer than 4 days. The rere-cession rate computed by Q(t)−Q(t+2)
2 is
15
used to computeS(t+1) associated with dischargeQ(t+1). The estimated storage in Eq. (5) is affected by the minimal storageSm, which is set to 0. However, the estimation
of evaporation in Eq. (4) is unaffected bySm.
3 Study watersheds and data
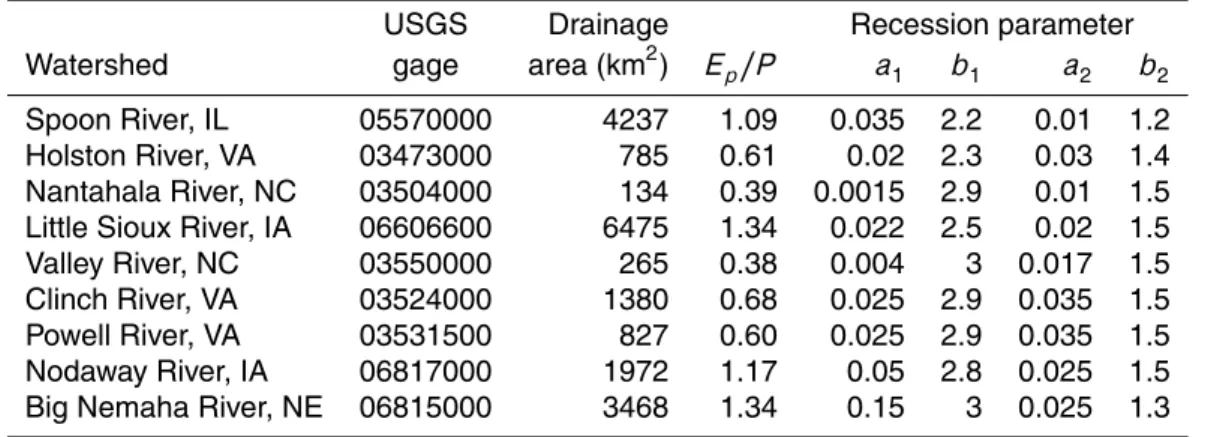
Table 1 shows the background information of 9 selected watersheds including water-20
HESSD
10, 5767–5798, 2013Evaluating the effect of partial contributing
storage
X. Chen and D. Wang
Title Page
Abstract Introduction
Conclusions References
Tables Figures
◭ ◮
◭ ◮
Back Close
Full Screen / Esc
Printer-friendly Version
Interactive Discussion
Discussion
P
a
per
|
Dis
cussion
P
a
per
|
Discussion
P
a
per
|
Discussio
n
P
a
per
|
1.34. Rainfall and runoff data during 1948–2003 were obtained from the Model Pa-rameter Estimation Experiment (MOPEX) dataset (Duan et al., 2006). Daily actual evaporation during 1983–2006 was obtained from the dataset developed by Zhang et al. (2010). Weather stations-based observations and Normalized Difference Vege-tation Index (NDVI) from remote sensing data are utilized for evaporation estimation at 5
each pixel with a spatial resolution about 8 km. The grid-based values of daily evapo-ration are aggregated to the watershed level. The evapoevapo-ration algorithm accuracy was evaluated by comparing the estimated evaporation with tower-measured meteorology results from totally 82 tower sites of the FLUXNET data archive (Zhang et al., 2010). Based on their results, the root mean square error (RMSE) of the estimated evapora-10
tion at the sites in America is 32 W m−2, which is around 1.20 mm d−1. Considering the availability of rainfall, runoffand evaporation data, this study is focused on the period from 1983 to 2003.
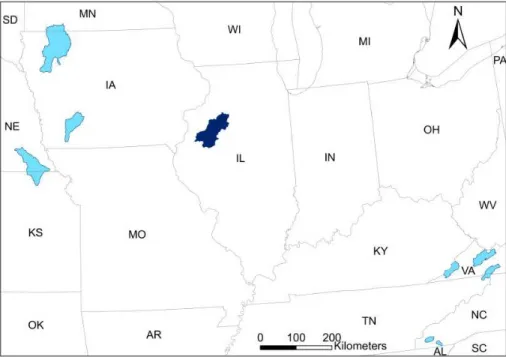
Among the 9 study watersheds, Spoon River watershed located in Illinois will be discussed with more emphasis (Fig. 1) because of the rich data availability. Soil mois-15
ture observation during 1981–2004 and groundwater level observation since 1960s are available (Changnon et al., 1988; Hollinger and Isard, 1994; Scott et al., 2010). These datasets can be used to explore the seasonal water storage changes directly (Wang, 2012a). The land cover in this watershed includes 85 % of agricultural land including corns and soybeans and others including forest, barren and urban lands (Demissie 20
et al., 2007). The soil thickness of river riparian zone varies from 5 to 15 feet (IDNR, 1998).
4 Results and discussion
The values ofαandβin the 9 case study watersheds shown in Table 1 are calculated using the method discussed above. The Spoon River watershed will be discussed with 25
more details as mentioned before. As shown in Fig. 2, the recession parameters for the Spoon River watershed areb1=2.2 anda1=0.035 mm−
2
HESSD
10, 5767–5798, 2013Evaluating the effect of partial contributing
storage
X. Chen and D. Wang
Title Page
Abstract Introduction
Conclusions References
Tables Figures
◭ ◮
◭ ◮
Back Close
Full Screen / Esc
Printer-friendly Version
Interactive Discussion
Discussion
P
a
per
|
Dis
cussion
P
a
per
|
Discussion
P
a
per
|
Discussio
n
P
a
per
|
andb2=1.2 anda2=0.01 mm− 0.2
d−0.8for the late recession. The values of recession parameters for the other 8 watersheds are shown Table 1, and the corresponding plots of−dQ/dt∼Qcan be found in the Supplement.
4.1 Underestimation of evaporation from base flow recession analysis
The estimated daily evaporation from the lumped storage–discharge relationship is 5
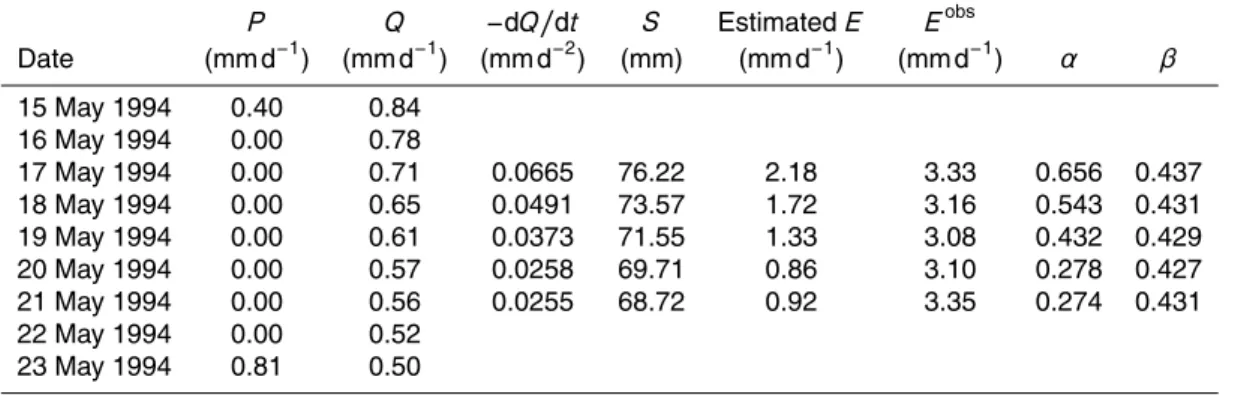
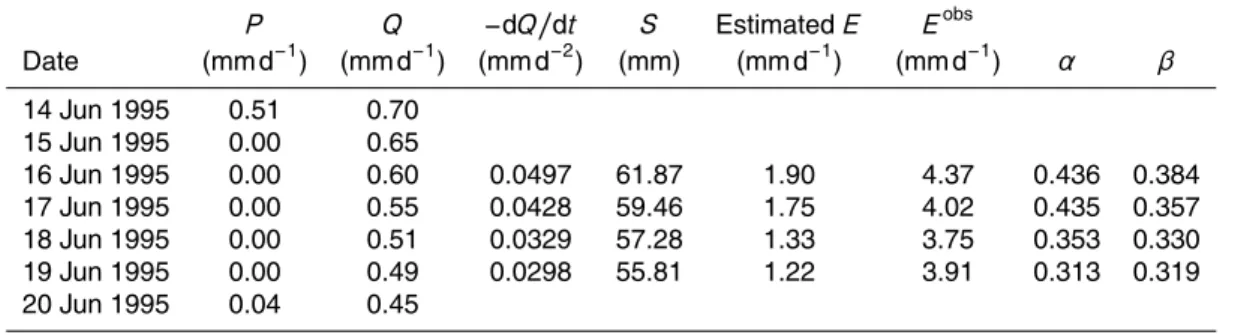
compared with the one estimated from remote-sensing and weather stations-based data. For demonstration purpose, Table 2 shows two recession events from: (1) the Spoon River watershed during May 1994 in Table 2a; (2) and the Nodaway River wa-tershed during May 1994 in Table 2b. The estimatedEby Eq. (4) andEobsfrom remote sensing data are shown in columns 6 and 7, respectively. As we can see in Table 2, 10
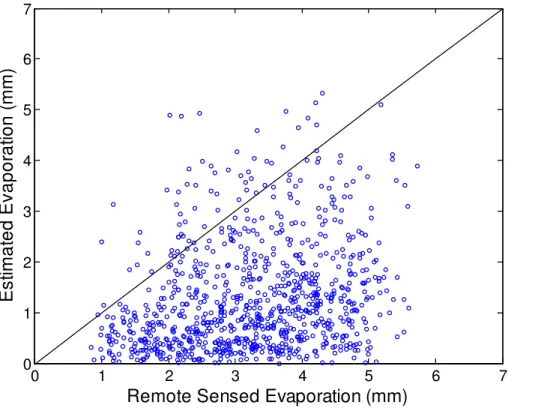
the estimated evaporation from recession analysis is much smaller thanEobs. Figure 3 plots estimatedE versusEobs from all the 9 watersheds. Most of the estimated values of evaporation are smaller than the remote sensed ones, and 93 % of data points are below the 1 : 1 line in Fig. 3.
The mismatch between estimated E versus Eobs can be induced by two potential 15
reasons. The values ofE are underestimated, or the values ofEobs are overestimated. However, Eobs is not biased toward overestimating evaporation as discussed earlier, and the average RMSE ofEobs is 1.2 mm d−1. The detailed uncertainty assessment of Eobs is not discussed in this paper and referred to (Zhang et al., 2010). Even if 1.2 mm d−1 of overestimation in Eobs is assumed, the estimated E is still
underesti-20
mated in most recession events. As shown in Table 2, the estimated E decreased from 1.72 mm d−1 to 0.92 mm d−1during a recession event in May in the Spoon River watershed whileEobsremained at the level of 3.08 mm d−1to 3.35 mm d−1. The under-estimation ofE is also supported by the fact that potential evaporation of the Spoon River watershed is 6.20 mm d−1 and the land use is dominated by agriculture
includ-25
HESSD
10, 5767–5798, 2013Evaluating the effect of partial contributing
storage
X. Chen and D. Wang
Title Page
Abstract Introduction
Conclusions References
Tables Figures
◭ ◮
◭ ◮
Back Close
Full Screen / Esc
Printer-friendly Version
Interactive Discussion
Discussion
P
a
per
|
Dis
cussion
P
a
per
|
Discussion
P
a
per
|
Discussio
n
P
a
per
|
envelope in Fig. 2 also affects the estimation ofE. If the lower envelope in Fig. 2 was moved upward, the estimated evaporation will be even lower.
The underestimation of evaporation from hydrograph recession analysis can be ex-plained by two major reasons: (1) the storage contributed to the observed base flow in the outlet is mainly from riparian groundwater during dry periods, and therefore the 5
estimated evaporation by Eq. (4) only accounts for evaporation from the riparian zone; (2) the linkage between water storage in the unsaturated zone and base flow becomes weak while the groundwater table declining. As a result, evaporation from unsaturated zone is not included in the estimatedE by recession analysis. Because of these two reasons, the value of estimated E by Eq. (4) will be underestimated, since the esti-10
matedE from riparian zone or contributing storage to base flow is normalized by the entire watershed area.
4.2 Temporal variability ofα
The ratio between estimated E and Eobs, which is described as α, reflects the sig-nificance of bias in the estimated evaporation. As shown in Table 2a, the value ofα 15
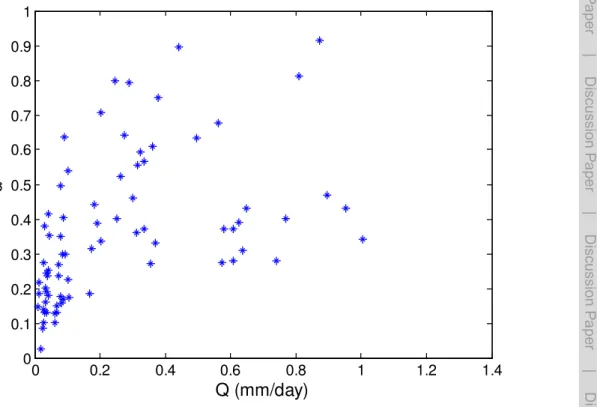
decreases by 58 % from 0.656 to 0.274 during the recession event; and the value ofα decreases by 28 % from 0.436 to 0.313 during the event in Table 2b. The value ofα decreases with declining discharge during individual recession events in all the study watersheds. The value of α also varies with events and is dependent on the initial soil moisture and groundwater table. For example, the water table rises after a heavy 20
rainfall and therefore more groundwater area contributes to the base flow, which is cor-responding to a higher value ofα. At the same time, higher discharge is corresponding to higher water table. Figure 4 plots the relation between estimatedαand observed dis-charge from the Spoon River watershed. As it shows, the larger values ofαcorrespond to higher discharges.
25
HESSD
10, 5767–5798, 2013Evaluating the effect of partial contributing
storage
X. Chen and D. Wang
Title Page
Abstract Introduction
Conclusions References
Tables Figures
◭ ◮
◭ ◮
Back Close
Full Screen / Esc
Printer-friendly Version
Interactive Discussion
Discussion
P
a
per
|
Dis
cussion
P
a
per
|
Discussion
P
a
per
|
Discussio
n
P
a
per
|
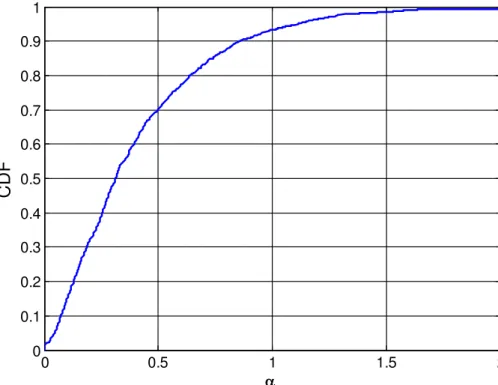
than 0.5. This result indicates a significant underestimation of evaporation based on recession analysis.
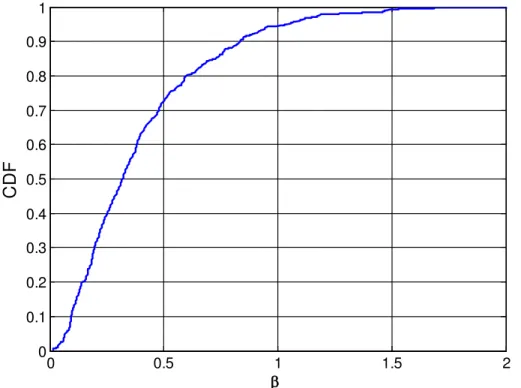
4.3 Temporal variability ofβ
The underestimation of storage by storage–discharge relationship is reflected in the values ofβwhich is the ratio of estimated storage to total storage. Figure 6 plots the 5
CDF curve ofβ values in the 9 study watersheds. The values of β are less than 1.0 for 94.5 % of data points, and 0.5 for 72.7 % of data points. Focusing on small water-sheds with drainage area less than 100 km2, Krakauer and Temimi (2011) compared the storage inferred from the recession curve and the storage measured by GRACE and found that the variability of storage by storage–discharge functions derived from 10
recession curves is typically smaller by a factor of 10. The effect of partial contributing storage contributes to the discrepancy was also observed in their study.
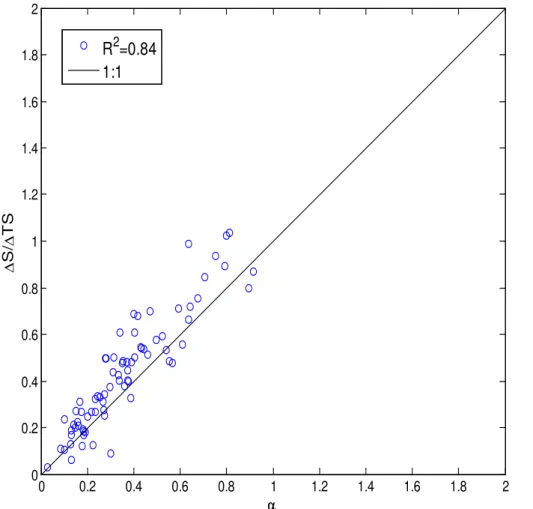
The underestimations of both evaporation and storage change based on recession analysis are due to the partial contributing storage to base flow. Furthermore, the storage changes between two consecutive days (∆S and ∆TS) are computed, and 15
the ratios between them, ∆S/∆TS, are obtained. Figure 7 plots ∆S/∆TS versus α (i.e., E/Eobs) from the Spoon River watershed. The correlation coefficient between
∆S/∆TS andE/Eobs is 0.84. Therefore, the underestimations of evaporation and stor-age change are highly correlated.
The value ofβcan also be interpreted as the percentage of water storage contribut-20
ing to the base flow during low flow periods when riparian groundwater storage is the major source for base flow. Column 5 in Table 2 shows the computed relative storage by Eq. (5a), and the last column shows the estimatedβby Eq. (11) from water balance. As shown in Table 2,βdoes not change significantly during a recession event. The value ofβis around 0.38 for the Spoon River watershed and varies from 0.38 to 0.32 for the 25
HESSD
10, 5767–5798, 2013Evaluating the effect of partial contributing
storage
X. Chen and D. Wang
Title Page
Abstract Introduction
Conclusions References
Tables Figures
◭ ◮
◭ ◮
Back Close
Full Screen / Esc
Printer-friendly Version
Interactive Discussion
Discussion
P
a
per
|
Dis
cussion
P
a
per
|
Discussion
P
a
per
|
Discussio
n
P
a
per
|
that the ratio of riparian groundwater storage to total watershed groundwater storage is relatively stable during a recession event.
On the other hand, β reflects the level of shallow groundwater connectivity in the watershed. The groundwater storage connectivity is dependent on the groundwater ta-ble depth. Therefore, the value ofβmay be correlated with groundwater table depth. It 5
is fortunate that the observation of the shallow groundwater table depth in the Spoon River watershed is available (Wang, 2012a). As shown in Fig. 8, the values of β de-crease as the groundwater table depth inde-creases and the correlation coefficient is 0.41, which indicates that when the groundwater table drops down, the contributing storage to base flow will decrease. The seasonal variability of water table depth is significant 10
ranging from 86 mm to 510 mm as shown in Fig. 8. Correspondingly, the seasonal vari-ability of β is also significant ranging from 0.027 to 0.799 (Fig. 6), even though the variation ofβis not significant during a recession event.
4.4 Variability of storage–discharge relationship
The effect of partial contributing storage induces variable storage–discharge relation-15
ship at the watershed scale. Figure 9 presents the estimated total relative storage (TS) and discharge (Q) relationship for the Spoon River watershed. The red solid line rep-resents the storage–discharge function derived from the lower envelope of Fig. 2, i.e., Eq. (5), which is equivalent to the case of β=1. The blue circles represent the esti-mated total watershed relative storage by considering variableβvalues based on wa-20
ter balance at the watershed scale. The data points (β <1) are below the red solid line (β=1). From Fig. 10, the TS–Qrelation tends to follow a power law within a recession event but varies among different recession events due to the variability ofβamong re-cession event. Given the same values of discharge, the corresponding total watershed water storage may vary between recession events. Therefore, the storage–discharge 25
HESSD
10, 5767–5798, 2013Evaluating the effect of partial contributing
storage
X. Chen and D. Wang
Title Page
Abstract Introduction
Conclusions References
Tables Figures
◭ ◮
◭ ◮
Back Close
Full Screen / Esc
Printer-friendly Version
Interactive Discussion
Discussion
P
a
per
|
Dis
cussion
P
a
per
|
Discussion
P
a
per
|
Discussio
n
P
a
per
|
that single-valued storage discharge functions are often incapable of representing the actual storage–discharge characteristics of a watershed and proposed an alternative discharge function based on hillslope groundwater hydraulics. Therefore, the effect of partial contributing storage is one of potential contributions to the variable storage– discharge relationship.
5
5 Summary and conclusion
The impact of subsurface hydrologic connectivity, which is represented by the partial contributing storage, on the storage–discharge functions at 9 watersheds in different climate regions was evaluated. The hydrologic connection among hillslope-riparian-stream zones decreases with the decline of water table. The effect of the partial con-10
tributing storage is one possible cause for the multi-valued storage–discharge relation-ship. The seasonal variations of hydrologic connectivity and contributing storage can cause variable storage–discharge functions given the same value of streamflow. As a result, when the entire watershed storage is assumed to be connected with the wa-tershed outlet, water storage and evaporation based on the storage–discharge function 15
may be underestimated systematically. The underestimation of evaporation and stor-age change based on the storstor-age–discharge function was evaluated using α as the ratio between estimated evaporation and remote sensed evaporation andβas the ra-tio between estimated storage and total storage, respectively. Based on the values of α and β, significant underestimation was observed for both evaporation and storage. 20
The value ofα decreases during a recession event while the value of β is relatively stable during a recession event but varies significantly among the recession events.
The effect of partial contributing storage on storage–discharge function increases with the spatial heterogeneity of water storage. In small catchments, it may be reason-able to assume fixed storage–discharge function. However, information on the spatial 25
HESSD
10, 5767–5798, 2013Evaluating the effect of partial contributing
storage
X. Chen and D. Wang
Title Page
Abstract Introduction
Conclusions References
Tables Figures
◭ ◮
◭ ◮
Back Close
Full Screen / Esc
Printer-friendly Version
Interactive Discussion
Discussion
P
a
per
|
Dis
cussion
P
a
per
|
Discussion
P
a
per
|
Discussio
n
P
a
per
|
research will be focused on validating partial contributing storage in experimental wa-tersheds with detailed observations on spatial variability of soil moisture and ground-water table as well as the response of base flow.
Supplementary material related to this article is available online at: http://www.hydrol-earth-syst-sci-discuss.net/10/5767/2013/
5
hessd-10-5767-2013-supplement.pdf.
References
Ajami, H., Troch, P. A., Maddock, T., Meixner, T., and Eastoe, C.: Quantifying mountain block recharge by means of catchment-scale storage–discharge relationships, Water Resour. Res., 47, W04504, doi:10.1029/2010WR009598, 2011.
10
Biswal, B. and Marani, M.: Geomorphological origin of recession curves, Geophys. Res. Lett., 37, L24403, doi:10.1029/2010GL045415, 2010.
Blyth, K. and Rodda, J. C.: A stream length study, Water Resour. Res., 9, 1454–1461, 1973. Brutsaert, W. and Nieber, J. L.: Regionalized drought flow hydrographs from a mature glaciated
plateau, Water Resour. Res., 13, 637–644, doi:10.1029/WR013i003p00637, 1977. 15
Buttle, J. M., Dillon, P. J., and Eerkes, G. R.: Hydrologic coupling of slopes, riparian zones and streams: an example from the Canadian Shield, J. Hydrol., 287, 161–177, 2004.
Changnon, S. A., Huff, F. A., and Hsu, C.: Relations between precipitation and shallow ground-water in Illinois, J. Climate, 1, 1239–1250, 1988.
Clark, M. P., Rupp, D. E., Woods, R. A., Tromp-van Meerveld, H. J., Peters, N. E., and 20
Freer, J. E.: Consistency between hydrological models and field observations: linking pro-cesses at the hillslope scale to hydrological responses at the watershed scale, Hydrol. Pro-cess., 23, 311–319, doi:10.1002/hyp.7154, 2009.
Clark, M. P., McMillan, H. K., Collins, D. B. G., Kavetski, D., and Woods, R. A.: Hydrological field data from a modeller’s perspective: Part 2: process-based evaluation of model hypotheses, 25
Hydrol. Process., 25, 523–543, doi:10.1002/hyp.7902, 2011.
HESSD
10, 5767–5798, 2013Evaluating the effect of partial contributing
storage
X. Chen and D. Wang
Title Page
Abstract Introduction
Conclusions References
Tables Figures
◭ ◮
◭ ◮
Back Close
Full Screen / Esc
Printer-friendly Version
Interactive Discussion
Discussion
P
a
per
|
Dis
cussion
P
a
per
|
Discussion
P
a
per
|
Discussio
n
P
a
per
|
Day, J. C.: International aquifer management: the Hueco Bolson on the Rio Grande River, National Resource Journal, 18, 163–179, 1978.
Demissie, M., Keefer, L., Lian, Y., and Yue, F.: The importance of managing sedimenta-tion in the Cache River wetlands, in: Restoring our Natural Habitat: Proceedings of the 2007 World Environmental and Water Resources Congress, edited by: Kabbes, K. C., 15– 5
19 May 2007, Tampa, Florida, American Society of Civil Engineers, Reston, VA, 1–10, doi:10.1061/40927(243)626, 2007.
Duan, Q., Schaake, J., Andr ´eassian, V., Franks, S., Goteti, G., Gupta, H. V., Gusev, Y. M., Habets, F., Hall, A., Hay, L., Hogue, T., Huang, M., Leavesley, G., Liang, X., Nasonova, O. N., Noilhan, J., Oudin, L., Sorooshian, S., Wagener, T., and Wood, E. F.: The Model Parameter 10
Estimation Experiment (MOPEX): an overview of science strategy and major results from the second and third workshops, J. Hydrol., 320, 3–17, 2006.
Federer, C. A.: Forest transpiration greatly speeds streamflow recession, Water Resour. Res., 9, 1599–1604, 1973.
Gregory, P. W.: The Water Quality of Streamflow from Ponderosa Pine Forests on Sedimentary 15
Soils, MSc thesis, The University of Arizona, 1976.
Harman, C. J., Sivapalan, M., and Kumar, P.: Power law catchment-scale recessions aris-ing from heterogeneous linear small-scale dynamics, Water Resour. Res., 45, W09404, doi:10.1029/2008WR007392, 2009.
Haught, D. R. W. and van Meerveld, H. J.: Spatial variation in transient water table responses: 20
differences between an upper and lower hillslope zone, Hydrol. Process., 25, 3866–3877, doi:10.1002/hyp.8354, 2011.
Hollinger, S. E. and Isard, S. A.: A soil moisture climatology of Illinois, J. Climate, 7, 822–833, 1994.
Illinois Department of Natural Resources: Spoon River Area Assessment: Volume 1: Geology, 25
IDNR, Springfield, IL, 1998.
Illinois State Water Surer: Illinois Monthly Evaporation Data, available at: http://www.isws. illinois.edu/atmos/statecli/Pan-Evap/panevapx.htm (last access: 17 April 2013), 2010. Jencso, K. G., McGlynn, B. L., Gooseff, M. N., Wondzell, S. M., Bencala, K. E., and
Mar-shall, L. A.: Hydrologic connectivity between landscapes and streams: transferring reach-30
HESSD
10, 5767–5798, 2013Evaluating the effect of partial contributing
storage
X. Chen and D. Wang
Title Page
Abstract Introduction
Conclusions References
Tables Figures
◭ ◮
◭ ◮
Back Close
Full Screen / Esc
Printer-friendly Version
Interactive Discussion
Discussion
P
a
per
|
Dis
cussion
P
a
per
|
Discussion
P
a
per
|
Discussio
n
P
a
per
|
Kirchner, J. W.: Watersheds as simple dynamical systems: watershed characterization, rainfall–runoffmodeling, and doing hydrology backward, Water Resour. Res., 45, W02429, doi:10.1029/2008WR006912, 2009.
Krakauer, N. Y. and Temimi, M.: Stream recession curves and storage variability in small wa-tersheds, Hydrol. Earth Syst. Sci., 15, 2377–2389, doi:10.5194/hess-15-2377-2011, 2011. 5
McDonnell, J. J., Brammer, D., Kendall, C., Hjerdt, N., Rowe, L., Stewart, M., and Woods, R.: Flow pathways on steep forested hillslopes: the tracer, tensiometer and trough approach, in: Environmental Forest Science, edited by: Tani, M., Kluwer, Dordrecht, 463–474, 1998. Molenat, J., Gascuel-Odoux, C., Ruiz, L., and Gruau, G.: Role of water table dynamics on
stream nitrate export and concentration in agricultural headwater catchment, J. Hydrol., 348, 10
364–378, 2008.
Mu, Q., Ann Heinsch, F., Zhao, M., and Running, S. W.: Development of a global evaporation algorithm based on MODIS and global meteorology data, Remote Sens. Environ., 111, 519– 536, 2007.
Ocampo, C. J., Sivapalan, M., and Oldham, C. E.: Hydrological connectivity of upland-riparian 15
zones in agricultural catchments: implications for runoffgeneration and nitrate transport, J. Hydrol., 331, 643–658, 2006.
Palmroth, S., Katul, G. G., Hui, D., McCarthy, H. R., Jackson, R. B., and Oren, R.: Estimation of long-term basin scale evaporation from streamflow time series, Water Resour. Res., 46, W10512, doi:10.1029/2009WR008838, 2010.
20
Rodhe, A. and Seibert, J.: Groundwater dynamics in a till hillslope: flow directions, gradients and delay, Hydrol. Process., 25, 1899–1909, doi:10.1002/hyp.7946, 2011.
Rupp, D. E., Schmidt, J., Woods, R. A., and Bidwell, V. J.: Analytical assessment and parameter estimation of a low-dimensional groundwater model, J. Hydrol., 377, 143–154, 2009. Sayama, T., McDonnell, J. J., Dhakal, A., and Sullivan, K.: How much water can a watershed 25
store? Hydrol. Process., 25, 3899–3908, doi:10.1002/hyp.8288, 2011.
Scott, R. W., Krug, E. C., and Burch, S. L.: Illinois Soil moisture under sod experiment, J. Hydrometeorol., 11, 683–704, doi:10.1175/2009JHM1130.1, 2010.
Seibert, J., Bishop, K., Rodhe, A., and McDonnell, J. J.: Groundwater dynamics along a hillslope: a test of the steady state hypothesis, Water Resour. Res., 39, 1014, 30
doi:10.1029/2002WR001404, 2003.
HESSD
10, 5767–5798, 2013Evaluating the effect of partial contributing
storage
X. Chen and D. Wang
Title Page
Abstract Introduction
Conclusions References
Tables Figures
◭ ◮
◭ ◮
Back Close
Full Screen / Esc
Printer-friendly Version
Interactive Discussion
Discussion
P
a
per
|
Dis
cussion
P
a
per
|
Discussion
P
a
per
|
Discussio
n
P
a
per
|
Spence, C., Guan, X. J., Phillips, R., Hedstorm, N., Granger, R., and Reid, B.: Storage dynamics and streamflow in a catchment with a variable contributing area, Hydrol. Process., 24, 2209– 2221, doi:10.1002/hyp.7492, 2010.
Stoelzle, M., Stahl, K., and Weiler, M.: Are streamflow recession characteristics really charac-teristic?, Hydrol. Earth Syst. Sci., 17, 817–828, doi:10.5194/hess-17-817-2013, 2013. 5
Swenson, S., Yeh, P. J.-F., Wahr, J., and Famiglietti, J.: A comparison of terrestrial water storage variations from GRACE with in situ measurements from Illinois, Geophys. Res. Lett., 33, L16401, doi:10.1029/2006GL026962, 2006.
Szilagyi, J., Gribovszki, Z., and Kalicz, P.: Estimation of catchmentscale evaporation from base-flow recession data: numerical model and practical application results, J. Hydrol., 336, 206– 10
217, 2007.
Teuling, A. J., Lehner, I., Kirchner, J. W., and Seneviratne, S. I.: Catchments as simple dy-namical systems: experience from a Swiss prealpine catchment, Water Resour. Res., 46, W10502, doi:10.1029/2009WR008777, 2010.
Tromp-van Meerveld, H. J. and McDonnell, J. J.: Threshold relations in subsurface storm-15
flow: 1. A 147-storm analysis of the Panola hillslope, Water Resour. Res., 42, W02410, doi:10.1029/2004WR003778, 2006a.
Tromp-van Meerveld, H. J. and McDonnell, J. J.: Threshold relations in subsurface stormflow: 2. The fill and spill hypothesis, Water Resour. Res., 42, W02411, doi:10.1029/2004WR003800, 2006b.
20
Vidon, P.: Towards a better understanding of riparian zone water table response to precipita-tion: surface water infiltration, hillslope contribution or pressure wave processes?, Hydrol. Process., 26, 3207–3215, doi:10.1002/hyp.8258, 2012.
Vidon, P. and Hill, A. R.: Landscape controls on nitrate removal in stream riparian zones, Water Resour. Res., 40, W03201, doi:10.1029/2003WR002473, 2004.
25
Vogel, R. and Kroll, C.: Regional geohydrologic-geomorphic relationships for the estimation of low-flow statistics, Water Resour. Res., 28, 2451–2458, 1992.
Wang, D.: On the base flow recession at the Panola Mountain Research Watershed, Georgia, USA, Water Resour. Res., 47, W03527, doi:10.1029/2010WR009910, 2011.
Wang, D.: Evaluating interannual water storage changes at watersheds in Illinois based on 30
HESSD
10, 5767–5798, 2013Evaluating the effect of partial contributing
storage
X. Chen and D. Wang
Title Page
Abstract Introduction
Conclusions References
Tables Figures
◭ ◮
◭ ◮
Back Close
Full Screen / Esc
Printer-friendly Version
Interactive Discussion
Discussion
P
a
per
|
Dis
cussion
P
a
per
|
Discussion
P
a
per
|
Discussio
n
P
a
per
|
Wang, D.: Assessing the impact of subsurface storage contributing area on the watershed scale storage-discharge function derived from baseflow recession at the Spoon River in Illinois, ASCE-World Environmental and Water Resources Congress in Albuquerque, New Mexico, 20–24 May, 3770–3779, doi:10.1061/9780784412312.379, 2012b.
Wang, D. and Alimohammadi, N.: Responses of annual runoff, evaporation, and storage 5
change to climate variability at the watershed scale, Water Resour. Res., 48, W05546, doi:10.1029/2011WR011444, 2012.
Wittenberg, H. and Sivapalan, M.: Watershed groundwater balance estimation using streamflow recession analysis and base flow separation, J. Hydrol., 219, 20–33, 1999.
Zhang, K., Kimball, J. S., Nemani, R. R., and Running, S. W.: A continuous satellite-derived 10
HESSD
10, 5767–5798, 2013Evaluating the effect of partial contributing
storage
X. Chen and D. Wang
Title Page
Abstract Introduction
Conclusions References
Tables Figures
◭ ◮
◭ ◮
Back Close
Full Screen / Esc
Printer-friendly Version
Interactive Discussion
Discussion
P
a
per
|
Dis
cussion
P
a
per
|
Discussion
P
a
per
|
Discussio
n
P
a
per
|
Table 1.Watershed name, USGS gage number, drainage area, climate aridity index (Ep/P),
and estimated recession parameters for the 9 case study watersheds.
USGS Drainage Recession parameter
Watershed gage area (km2) Ep/P a1 b1 a2 b2
HESSD
10, 5767–5798, 2013Evaluating the effect of partial contributing
storage
X. Chen and D. Wang
Title Page
Abstract Introduction
Conclusions References
Tables Figures
◭ ◮
◭ ◮
Back Close
Full Screen / Esc
Printer-friendly Version
Interactive Discussion
Discussion
P
a
per
|
Dis
cussion
P
a
per
|
Discussion
P
a
per
|
Discussio
n
P
a
per
|
Table 2a.One recession event from the Spoon River watershed in Illinois.
P Q −dQ/dt S EstimatedE Eobs
Date (mm d−1) (mm d−1) (mm d−2) (mm) (mm d−1) (mm d−1) α β
15 May 1994 0.40 0.84
16 May 1994 0.00 0.78
17 May 1994 0.00 0.71 0.0665 76.22 2.18 3.33 0.656 0.437
18 May 1994 0.00 0.65 0.0491 73.57 1.72 3.16 0.543 0.431
19 May 1994 0.00 0.61 0.0373 71.55 1.33 3.08 0.432 0.429
20 May 1994 0.00 0.57 0.0258 69.71 0.86 3.10 0.278 0.427
21 May 1994 0.00 0.56 0.0255 68.72 0.92 3.35 0.274 0.431
22 May 1994 0.00 0.52
HESSD
10, 5767–5798, 2013Evaluating the effect of partial contributing
storage
X. Chen and D. Wang
Title Page
Abstract Introduction
Conclusions References
Tables Figures
◭ ◮
◭ ◮
Back Close
Full Screen / Esc
Printer-friendly Version
Interactive Discussion
Discussion
P
a
per
|
Dis
cussion
P
a
per
|
Discussion
P
a
per
|
Discussio
n
P
a
per
|
Table 2b.One recession event from the Nodaway River watershed in Iowa.
P Q −dQ/dt S EstimatedE Eobs
Date (mm d−1) (mm d−1) (mm d−2) (mm) (mm d−1) (mm d−1) α β
14 Jun 1995 0.51 0.70
15 Jun 1995 0.00 0.65
16 Jun 1995 0.00 0.60 0.0497 61.87 1.90 4.37 0.436 0.384
17 Jun 1995 0.00 0.55 0.0428 59.46 1.75 4.02 0.435 0.357
18 Jun 1995 0.00 0.51 0.0329 57.28 1.33 3.75 0.353 0.330
19 Jun 1995 0.00 0.49 0.0298 55.81 1.22 3.91 0.313 0.319
HESSD
10, 5767–5798, 2013Evaluating the effect of partial contributing
storage
X. Chen and D. Wang
Title Page
Abstract Introduction
Conclusions References
Tables Figures
◭ ◮
◭ ◮
Back Close
Full Screen / Esc
Printer-friendly Version
Interactive Discussion
Discussion
P
a
per
|
Dis
cussion
P
a
per
|
Discussion
P
a
per
|
Discussio
n
P
a
per
|
Fig. 1. Locations of the 9 study watersheds with Spoon River watershed located in Illinois
HESSD
10, 5767–5798, 2013Evaluating the effect of partial contributing
storage
X. Chen and D. Wang
Title Page
Abstract Introduction
Conclusions References
Tables Figures
◭ ◮
◭ ◮
Back Close
Full Screen / Esc
Printer-friendly Version
Interactive Discussion
Discussion
P
a
per
|
Dis
cussion
P
a
per
|
Discussion
P
a
per
|
Discussio
n
P
a
per
|
10-3 10-2 10-1 100 101
10-5 10-4 10-3 10-2 10-1 100 101
Q (mm/day)
-dQ
/dt
(
m
m
/day
2
)
Data
b
1
=2.2; a
1=0.035
b
2
=1.2; a
2=0.01
Fig. 2.−dQ/dt versusQ and the lower envelope for the Spoon River water based on daily
HESSD
10, 5767–5798, 2013Evaluating the effect of partial contributing
storage
X. Chen and D. Wang
Title Page
Abstract Introduction
Conclusions References
Tables Figures
◭ ◮
◭ ◮
Back Close
Full Screen / Esc
Printer-friendly Version
Interactive Discussion
Discussion
P
a
per
|
Dis
cussion
P
a
per
|
Discussion
P
a
per
|
Discussio
n
P
a
per
|
0 1 2 3 4 5 6 7
0 1 2 3 4 5 6 7
Remote Sensed Evaporation (mm)
E
s
tim
at
ed E
v
apor
at
ion (
m
m
)
Fig. 3.Comparison between estimated evaporation from recession analysis and evaporation
HESSD
10, 5767–5798, 2013Evaluating the effect of partial contributing
storage
X. Chen and D. Wang
Title Page
Abstract Introduction
Conclusions References
Tables Figures
◭ ◮
◭ ◮
Back Close
Full Screen / Esc
Printer-friendly Version
Interactive Discussion
Discussion
P
a
per
|
Dis
cussion
P
a
per
|
Discussion
P
a
per
|
Discussio
n
P
a
per
|
0 0.2 0.4 0.6 0.8 1 1.2 1.4
0 0.1 0.2 0.3 0.4 0.5 0.6 0.7 0.8 0.9 1
Q (mm/day)
α
HESSD
10, 5767–5798, 2013Evaluating the effect of partial contributing
storage
X. Chen and D. Wang
Title Page
Abstract Introduction
Conclusions References
Tables Figures
◭ ◮
◭ ◮
Back Close
Full Screen / Esc
Printer-friendly Version
Interactive Discussion
Discussion
P
a
per
|
Dis
cussion
P
a
per
|
Discussion
P
a
per
|
Discussio
n
P
a
per
|
0 0.5 1 1.5 2
0 0.1 0.2 0.3 0.4 0.5 0.6 0.7 0.8 0.9 1
α
CDF
HESSD
10, 5767–5798, 2013Evaluating the effect of partial contributing
storage
X. Chen and D. Wang
Title Page
Abstract Introduction
Conclusions References
Tables Figures
◭ ◮
◭ ◮
Back Close
Full Screen / Esc
Printer-friendly Version
Interactive Discussion
Discussion
P
a
per
|
Dis
cussion
P
a
per
|
Discussion
P
a
per
|
Discussio
n
P
a
per
|
0 0.5 1 1.5 2
0 0.1 0.2 0.3 0.4 0.5 0.6 0.7 0.8 0.9 1
β
CDF
HESSD
10, 5767–5798, 2013Evaluating the effect of partial contributing
storage
X. Chen and D. Wang
Title Page
Abstract Introduction
Conclusions References
Tables Figures
◭ ◮
◭ ◮
Back Close
Full Screen / Esc
Printer-friendly Version
Interactive Discussion
Discussion
P
a
per
|
Dis
cussion
P
a
per
|
Discussion
P
a
per
|
Discussio
n
P
a
per
|
0 0.2 0.4 0.6 0.8 1 1.2 1.4 1.6 1.8 2
0 0.2 0.4 0.6 0.8 1 1.2 1.4 1.6 1.8 2
α
∆
S/
∆
TS
R2=0.84 1:1
HESSD
10, 5767–5798, 2013Evaluating the effect of partial contributing
storage
X. Chen and D. Wang
Title Page
Abstract Introduction
Conclusions References
Tables Figures
◭ ◮
◭ ◮
Back Close
Full Screen / Esc
Printer-friendly Version
Interactive Discussion
Discussion
P
a
per
|
Dis
cussion
P
a
per
|
Discussion
P
a
per
|
Discussio
n
P
a
per
|
0 100 200 300 400 500 600
0 0.1 0.2 0.3 0.4 0.5 0.6 0.7 0.8 0.9 1
Groundwater Table Depth (mm)
β
Fig. 8.The relationship between estimatedβand observed shallow groundwater table depth
HESSD
10, 5767–5798, 2013Evaluating the effect of partial contributing
storage
X. Chen and D. Wang
Title Page
Abstract Introduction
Conclusions References
Tables Figures
◭ ◮
◭ ◮
Back Close
Full Screen / Esc
Printer-friendly Version
Interactive Discussion
Discussion
P
a
per
|
Dis
cussion
P
a
per
|
Discussion
P
a
per
|
Discussio
n
P
a
per
|
100 101 102 103
10-2 10-1 100 101
TS (mm)
Q
(
mm/
d
a
y
)
β=1 Variable β
Fig. 9.The impact of variable contributing storage on the total storage–discharge relationship