Joana Fernandes Gonçalves
Licenciatura em Bioquímica
Fsp27/CIDEC
is a CREB target gene
induced during fasting and regulated by
fatty acid oxidation rate
Dissertação para obtenção do Grau de Mestre em
Biotecnologia
Orientador: Dr. Diego Haro Bustista, Professor
Catedrático, Facultat de Farmàcia, Universitat de
Barcelona
Co-orientador: Dr. Pedro Marrero González, Professor
Titular, Facultat de Farmàcia, Universitat de Barcelona
Presidente: Prof. Doutora Maria Ascensão Carvalho Fernandes Miranda Reis
Fsp27/CIDEC
is a CREB target gene induced during
fasting and regulated by fatty acid oxidation rate
Dissertação de Mestrado em BiotecnologiaJoana Fernandes Gonçalves
Dr. Diego Haro | Dr. Pedro Marrero
Facultat de Farmàcia, Universitat de Barcelona
i
Copyright
Fsp27/CIDEC
is a CREB target gene induced during fasting and regulated by
fatty acid oxidation rate.
Joana Fernandes Gonçalves
FCT/UNL
UNL
A Faculdade de Ciencias e Tecnologia e a Universidade Nova de Lisboa têm o direito, perpétuo
e sem limites geográficos,de arquivar e publicar esta dissertação através de exemplares
impressos reproduzidos em papel ou de forma digital, ou por qualquer outro meio conhecido ou
que venha a ser inventado, e de a divulgar atraves de repositórios cientificos e de admitir a sua
cópia e distribuição com objectivos educacionais ou de investigacao, não comerciais, desde
iii
“Por que foi que cegámos, Não sei, talvez um dia se chegue a conhecer a razão, Queres que te diga o que penso, Diz, Penso que não cegámos, penso que estamos cegos, Cegos que vêem, Cegos
que, vendo, não vêem.”
v
“Why did we go blind, I don’t know, maybe one day we’ll find out, Do you
want me to tell you what I think, Yes, I don't think we did go blind, I think we are blind, Blind but seeing, Blind people who can see, but do not see.”
vii
Acknowledgments
The present study was supported by many people whose advice knowledge and
encouragement were critical throughout this year of research in the Department of Biochemistry
and Molecular Biology of the Pharmacy School, University of Barcelona, and I’m indebted to all
of them.
I am grateful to Dr. Diego Haro and Dr. Pedro Marrero who allowed me to integrate their
research team, for the project design, all the support, encouragement and teaching and whose
dedication to produce high quality science inspired by best efforts and made this a rewarding
experience.
One of the special advantages during this process was the access to the extraordinary
community of researchers at Pharmacy School. I wish to thank the entire team of the Signaling
Transduction Lab, doctors Joana, Ana Luísa, Helena and Mariona and Albert whose teaching,
trust, experience, wisdom, friendship and constructive challenges inspired the improvements of
this project and made it possible. I have to particularly thank Dr. Ana Luísa since she helped to
coordinate the entire project and whose teaching and trust was a hallmark in my scientific
development this year.
Further, I thank my colleague and friend Alexandra Rosário whose support and friendship were
crucial throughout all this process and for the constant and graceful presence to the long
evenings and weekends we devoted to the lab.
Finally, I express my deepest appreciation to my family, who supported this project and
ix
Abstract
Fsp27 (CIDEC the human homologue) is a lipid droplet protein that when overexpressed down regulates fatty acid oxidation (FAO). Previous results of this group showed that Fsp27/CIDEC expression is regulated by fasting in liver in a time-dependent manner. The present study aimed
to elucidate the mechanism by which Fsp27/CIDEC is mediating fasting adaptation and regulated by FAO rate in liver. We showed that induction of Fsp27/CIDEC expression during fasting is not regulated by PPARα. Pharmacological inhibition of FAO by etomoxir induces Fsp27/CIDEC in fasting conditions and this regulation is not mediated by PPAR – a master
regulator in triglyceride accumulation. The early response to fasting can be explained by a
canonical PKA-CREB-CRTC2 signaling pathway, since CIDEC expression was increased by forskolin which effect was lost when a vector containing a dominant negative of CREB construct
(KCREB) was co-transfected in HepG2 cells, and, consistently, Fsp27 promoter activity was
increased by CREB. Also, CIDEC expression was up-regulated by specific Sirt1 depletion by siRNA in HepG2 cells. Our data demonstrate that Fsp27/CIDEC is a CREB target gene that could be up-regulated when FAO is reduced and that fluctuations in SIRT1 activity, in response
to nutrient availability, mediate this mechanism.
The peroxissome proliferator-activated receptor gamma coactivator-1α (PGC-1α) induces and
coordinates gene expression that stimulates metabolic pathways linked to the fasted response
in liver including gluconeogenesis. We observed that Pgc-1α expression was increased in late fasting in the liver of mice previously subjected to a leucin deprived diet. These conditions also
enhanced transcription from Foxa2 gene. This study showed that the mechanism regulating the induction of Pgc-1α expression under these conditions is not mediated by the recruitment of CREB by Foxa2 to the Pgc-1α or the Pepck promoters, since both promoters activities were not enhanced by the co-transfection of FOXA2 with CREB in HepG2 cells.
Keywords: CIDEC/Fsp27; Fasting; FAO; CREB; SIRT1; Amino-acid deprivation; PGC-1α;
xi
Resumo
Fsp27 (CIDEC, o homologo humano) é uma proteina associada às gotas lipídicas que quando sobre-expressada inibe a oxidação dos ácidos gordos (FAO). Recentemente, resultados deste
grupo demonstraram que a sua expressão é regulada durante o estado de jejum no fígado no
decurso do tempo. Neste estudo pretende-se elucidar o mecanismo pelo qual Fsp27/CIDEC medeia a adaptação ao jejum e a sua regulação pela taxa de FAO no fígado. Demonstrou-se
que a sua indução durante o jejum não é regulada por PPARα e a indução registada pela inibição farmacológica da FAO por etomoxir não é mediada por PPAR – regulador crucial na
acumulação de triglicéridos. A resposta à fase inicial do jejum explica-se pela via de sinalização
PKA-CREB-CRTC2 uma vez que a expressão de CIDEC aumentou com forskolina e este efeito foi atenuado com a transfecção de um dominante negativo de CREB em células HepG2.
Consistentemente, a actividade do promotor Fsp27 aumentou com CREB. A indução da expressão de CIDEC observou-se com a supressão específica de Sirt1 por siRNA em células HepG2. Estes resultados demonstram que Fsp27/CIDEC é um gene alvo de CREB cuja expressão aumenta com redução da FAO e este processo é mediado pela actividade de
SIRT1.
PGC-1α induz e coordena a expressão genética que estimula processos metabólicos relacionados com a resposta ao jejum no fígado incluindo a gluconeogenese. Observou-se que
a sua expressão aumenta na fase tardia do jejum no fígado de ratos previamente sujeitos a
uma dieta sem leucina, condições que induziram a transcrição do gene Foxa2. Este estudo demonstrou que o mecanismo que regula a indução da expressão de Pgc-1α nestas condições não é mediada pelo recrutamento de CREB por Foxa2 para os promotores Pgc-1α e Pepck, uma vez que ambas as actividades promotoras não foram induzidas pela transfecção
simultânea de FOXA2 com CREB em células HepG2.
Palavras Chave: CIDEC/Fsp27; Jejum; FAO; CREB; SIRT1; Deprivação de aminoácidos;
xiii
Table of Contents
1. INTRODUCTION 1
1.1. Fasting 1
1.2. Molecular mechanisms regulating adaptation to fasting 3
1.2.1. CREB/CRTC2 Signaling Pathway 3
1.2.2. SIRT1 5
1.2.3. PGC-1α 6
1.2.4. FOXA2 9
1.3. Fatty Acid Signal Transduction Pathway 11
1.3.1. Fatty Acid Oxidation 11
1.3.2. Ketogenesis 13
1.3.3. PPARs 15
1.3.4. Fsp27/CIDEC 18
1.4. Amino acid deprivation 21
2. THESIS GOAL 23
3. MATHERIALS AND METHODS 25
3.1. Plasmid DNA preparation 25
3.2. Plasmid construct and site directed mutagenesis 26
3.2.1. Mouse PGC1-α promoter 26
3.2.2. Mouse Fsp27 promoter 26
3.2.3. Automatic sequenciation of DNA 27
3.2.4. DNA oligonucleotide (primers) 27
3.3. Cell culture 27
3.4. Reagents 28
3.4.1. Reagents used in cell culture maintenance 28
3.4.2. Reagents used in cell culture specific treatments 28
3.4.3. Reagents used in cell culture transfection 28
3.5. Transient transfection and gene reporter assays 28
3.6. siRNA Transfection 29
3.7. KCREB Transfection – Fluorescence assay 29
3.8. Isolation and analysis of RNA 29
3.8.1. Isolation of total RNA 29
3.8.2. RT-PCR 30
3.8.3. Real time PCR 30
3.9. Statistical analysis 30
xiv
3.11. Additional Information 31
4. RESULTS 33
4.1. Down regulation of FAO increases CIDEC expression. 33
4.2. The induction of CIDEC expression is not mediated by PPARα during fasting. 34
4.3. Fsp27 is activated by CREB and its induction by fasting is repressed by SIRT1. 35
5. DISCUTION 43
6. CONCLUSIONS 47
7. REFERENCES 49
8. ANNEX 55
8.1. Vectors 55
8.1.2. Cloning vectors 55
8.1.3. Promoter vectors 55
8.1.4. Expression vectors 56
8.2. Primer Design (5’ - 3’) 57
xv
Table of Figures
Figure 1.1. The fasting state: The gluconeogenic liver. In fasting conditions, the liver becomes the principle source of glucose for the brain. Liver glycogen is brake down, and the glucose 1-phosphate produced is converted to glucose 6-phophate, then to free glucose, which is released into the blood stream. Amino acids from the degradation of proteins and glycerol from the breakdown of triglycerides in adipose tissue are used for gluconeogenesis. The liver uses fatty acids as its principal fuel, and excess acetyl-CoA is converted to ketone bodies for export to other tissues for fuel; the brain is especially dependent on this fuel when glucose is in short supply. Adapted from Lehninger, Principles of Biochemistry 2005 [5]. ... 2
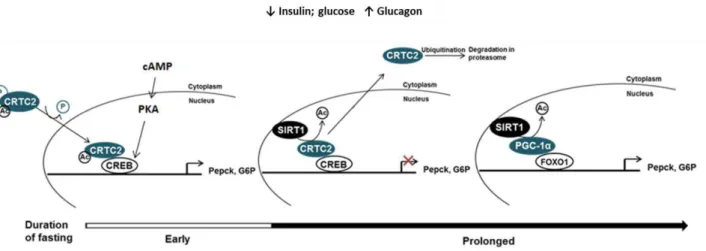
Figure 1.2. Schematic diagram of the inducible switch that modulates gluconeogenesis through the CREB/CRTC2 signaling pathway. Fasting corresponds to a metabolic state where insulin levels are low and glucagon levels are high and it can be dissected in two distinct phases, the early phase (<12-18h) and late phase (>12-18h). CRTC2 – CREB regulated transcription coactivator 2; CREB - cAMP responsive element binding protein, FOXO1 - Forkhead box protein O1 , PGC-1α - Peroxissome proliferator-activated receptor gamma coactivator- 1α, SIRT1 – Sirtuin 1. ... 4
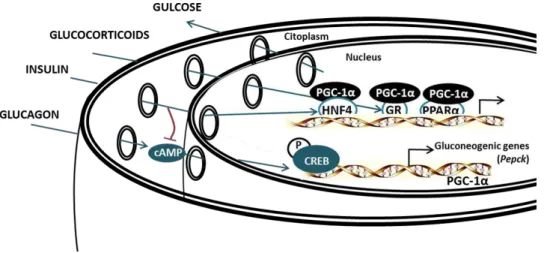
Figure1.3. Transcriptional regulation of hepatic gluconeogenesis by PGC-1 alpha. Hepatic glucose production in the liver is tightly controlled by hormones. Glucagon and catecholamines stimulate the cAMP pathway and CREB, which activates PGC-1α gene expression. PGC-1α is then recruited to different transcription factors that bind to the promoter of gluconeogenic genes such as PEPCK. Glucocorticoids induce a specific interaction between PGC-1α and GR -activating PEPCK. Insulin represses cAMP activation on gluconeogenic genes, but how it blocks PGC-1α gene expression is unknown. Adapted from Puigserver et al., 2003 [34]. ... 8
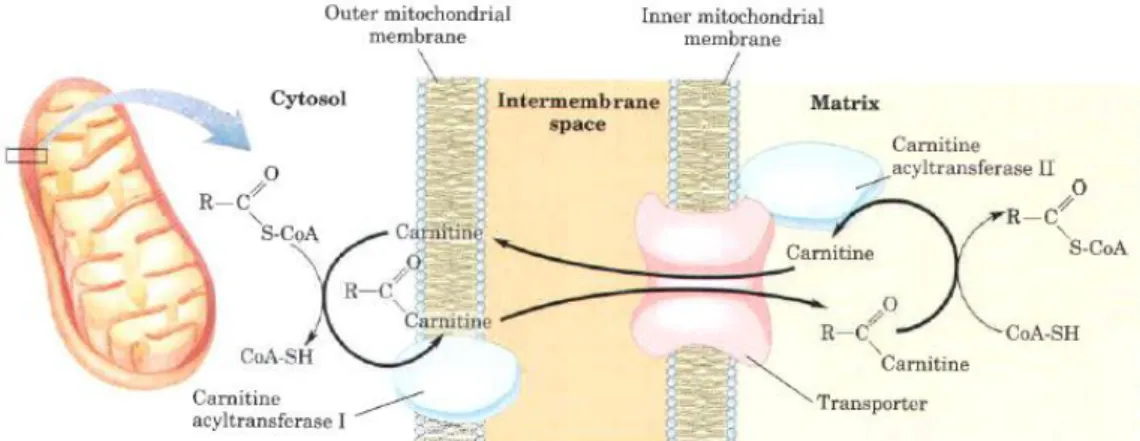
Figure 1.4. Fatty acid entry into mitochondria via acyl carnitine/carnitine transporter. After fatty acyl-carnitine is formed at the outer membrane in the intermembrane space, it moves into the matrix by facilitated diffusion through the transporter in the inner membrane. In the matrix, the acyl group is transferred to mitochondrial coenzyme A, freeing carnitine to return to the inter-membrane space through the same transporter. Acyl transferase I is inhibited by malonyl CoA. This inhibition prevents the simultaneous synthesis and degradation of fatty acids. Adapted from Lehninger, Principles of Biochemistry 2005 [1]. ... 12
Figure 1.5. Formation of ketone bodies from acetyl-CoA. Adapted from Lehninger, Principles of Biochemistry [6]. ... 14
Figure 1.6. The insulin sensitization action of PPAR gamma. Adapted from Lehrke et al., 2005 [33]. ... 17
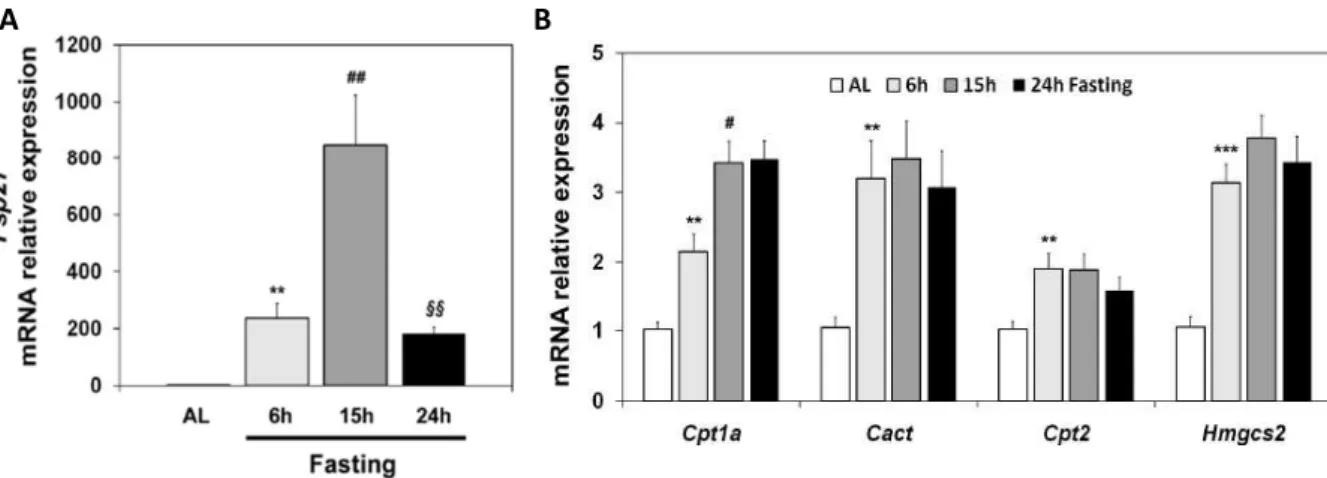
Figure 1.7. Hepatic Fsp27 expression is induced by early fasting. Mice fed Ad Libitum (AL) or subjected to 6h, 15h, or 24h fasting. (A) Fsp27, (B) Hmgcs2 and other fatty acid oxidation genes (Cpt1a, Cact and Cpt2) mRNA levels in liver. Results are means ± SEM for each group (n=5) ** P <0.01, *** P<0.001 relative to AL; # P<0.05, ## P <0.01 relative to 6h fast; ᵹᵹ P<0.01 relative to 15h fasting. ... 20
xvi
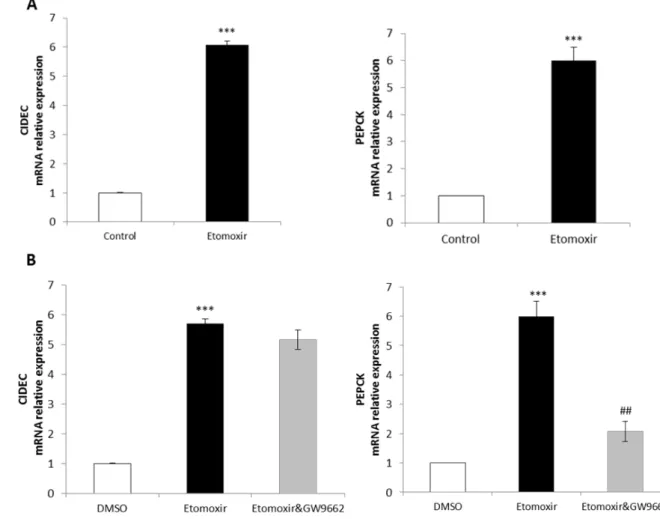
means ± SEM of three independent measurements. ***, P<0.001, relative to control (HepG2 cells treated with vehicle - DMSO); ##, P<0.01 relative to the etomoxir treatment... 33
Figure 4.2. Effect of specific PPARα agonist (Wy14643) in CIDEC expression. CIDEC (left panel) and HMGCS2 (right panel) mRNA levels in HepG2 cells treated with 10 µM of Wy14643 (Sigma) for 24 hours. Results are means of two independent experiments. **, P<0.01 relative to control (HepG2 cells treated with vehicle - DMSO). ... 35
Figure 4.3. CIDEC is induced by Forskolin and repressed by PKA inhibitor H89. (A)CIDEC (left panel) and PEPCK (right panel) mRNA levels in HepG2 cells treated with 10 µM of forskolin in OPTI-MEM (Invitrogen) for 6 h (mean of three independent experiments). (B) The effect of treatment with forskolin 10 µM for 6h and/or pretreatment with H89 (50 µM) for 1 hour in CIDEC (left panel) and PEPCK (right panel) mRNA levels in HepG2 cells. Cells were in OPTI-MEM (Invitrogen), or vehicle (DMSO). Data represent the means ± SEM of three independent experiments. **, P<0.01; ***, P<0.001, relative to the control; ##, P<0.01, ###, P<0.001 relative to forskolin activation of CIDEC and PEPCK mRNA levels. ... 36
Figure 4.4. CIDEC is induced by Forskolin and repressed by a negative dominant of CREB – KCREB. (A) HepG2 appearance (left panel) and transfection assessment in HepG2 cells by green fluorescence protein (GFP) (right panel). (B) CIDEC (left panel) and PEPCK (right panel) mRNA levels in HepG2 cells transfected with GFP (green fluorescent protein), or GFP plus KCREB (500 ng) expression vector and treated with 10 µM of Forskolin (in OPTI-MEM - Invitrogen) for 6h. Data represent the means ± SEM of three independent experiments. ***, P<0.001, relative to the control; #, P<0.05, relative to forskolin activation of CIDEC and PEPCK mRNA levels. ... 37
Figure 4.5. Fsp27 mouse promoter activity is induced by CREB transcription factor. (A) 5’-flanking region of the mouse Fsp27 gene with the nucleotide sequences of the putative CREB sites - CRE1 and CRE2. (B) The subsequent constructs have the correspondent mutated elements inside the boxes bellow the wild type construct. The original sequence is shown as a line. (C) HepG2 cells transfected for 48 h with Fsp27 promoter constructs cloned in pGL3basic and co-transfected with either pcDNA3 or pcDNA3-CREB (150 ng) expression vectors. Results are represented by fold activation to the WT promoter construct. pGL3basic activation was subtracted from each condition. Data represent the means ± SEM of four independent experiments performed in duplicate. *, P<0.05; **, P<0.01; relative to wt construct; #, P<0.05, ##; P<0.01 relative to CREB activation of WT promoter. ... 39
Figure 4.6. CIDEC is induced by SIRT1 depletion.CIDEC mRNA levels in HepG2 cells treated with siRNA control or siRNA of SIRT1. Data represent the means ± SEM of three independent experiments. *, P<0.05 relative to the siRNA control. ... 40
Figure 4.7. Pgc-1α and Foxa2 are induced upon leucin deprived diet in fasting conditions. (A) Pgc-1α mRNA levels and (B) Foxa2 mRNA levels in liver of mice fed Ad Libitum (Ad Libitum Control), fed with a leucin deprived diet (Ad Libitum (-) leu, fasted (Fast control) or fasted and previously subjected to a leucin deprived diet (Fast (-) leu). Results represent the means ± SEM of six independent experiments. *, P<0.05; **, P<0.01; relative to the Ad Libitum control group; # P<0.05 relative to the fast control group. ... 41
xvii
condition. Data represent the means ± SEM of three independent experiments performed in duplicate. **, P<0.01 relative to pcDNA3... 42
xix
Table of Tables
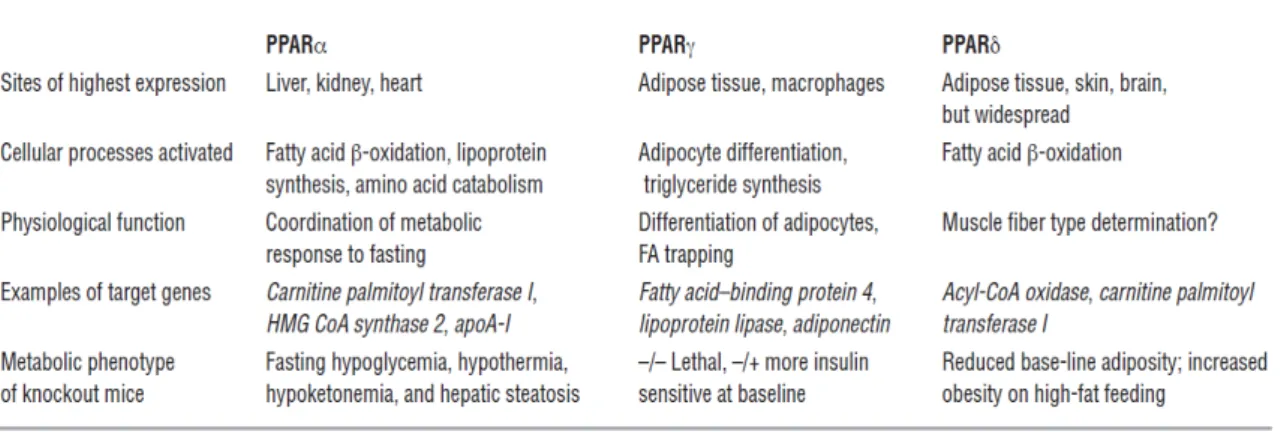
Table 1.1. Simplified overview of current understanding of the metabolic roles
of the 3 PPAR isoforms.
15
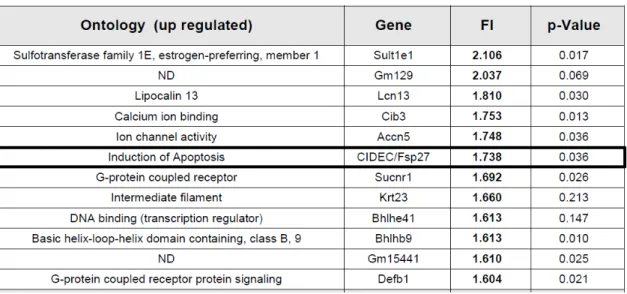
Table 1.2. Genes that are up regulated by HMGCS2 knock down. List of
differentially expressed genes (up regulated >1.6 fold) in a microarray Affymetrix®
(GeneChip Mouse Gene 1.0ST) performed with RNA of liver of shRNA control or
shRNA Hmgcs2 treated mice (n=3). (Unpublished data from Haro D. and Marrero P.,
School of Pharmacy, University of Barcelona)
xxi
List of Abbreviations
AAR Amino acid response
ADP Adenosine diphosphate
ATP
ATF4
Adenosine triphosphate
Activating transcription factor 4
BAT Brown adipose tissue
CACT Carnitine Acylcarnitine Translocase
cAMP Cyclic Adenosine monophophate
CARE CCAAT-enhancer binding protein-activating transcription factor C/EBP-ATF response elements
CBP CREB binding protein
C/EBP CCAAT/enhancer binding protein
ChIP
Chromatin Immunoprecipitation
CIDEC Cell death inducing DFF45-like effector C
CPT-I Carnitine palmitoytranferase I
CPT-II Carnitine palmitoyltransferase II
CRTC2
CREB-regulated transcriptional co-activator 2
CREB
CMV
CoA
cAMP responsive element binding protein
Cytomegalovirus
Coenzyme A
DMSO Dimetylsulfoxid
DNA
E.Coli
eIF2
Deoxyribonucleic Acid
Escherichia Coli
Eukaryotic Initiation factor 2
ERR
EDTA
Estrogen related receptor
Ethylenediamine tetraacetic acid
FFA Free fatty acids
FADH2 Flavine adenine dinucleotide
FOXA Forkhead box protein A
xxii FSP27 Fat specific protein 27
GCN2 General Control Nonderepressible protein 2 kinase
G6P Glucose-6-phosphate
GFP Green fluorescent protein
GR Glucocorticoid receptors
HAT Acetyl transferases
HMG-CoA 3-hydroxy-3-methylglutaryl CoA
HMGCS2 3-hydroxy-3-methylglutaryl-CoA (HMG-CoA) synthase 2
HNF3 Hepatic nuclear factor 3
HNF4α
IPTG
Hepatic nuclear factor-4α
Isopropyl β-D-1-thiogalactopyranoside
KCREB
LB
Expression vector (pcDNA3-KCREB) containing a dominant negative CREB construct
Lysogeny Broth (growth media for bacteria)
LCAS Long-chain acyl-CoA synthetase
LD Lipid Droplet
(-) leu
Luc
Leucin deficient
Luciferase gene, from Photinus pyralys
MEM Minimum Essential Medium
mut
µ
Mutated
Micro (10-6)
NAD Nicotinamide adenine dinucleotide, oxidizing agent
NADH
ng
Nicotinamide adenine dinucleotide, reducing agent
Nanogram(s)
PBS Phosphate buffered-saline
PCR Polymerase Chain Reaction
PEPCK Phosphoenolpyruvate carboxykinase
PGC-1α Peroxissome proliferator-activated receptor gamma coactivator- 1α
PKA Protein kinase A
PPARs
PPRE
Peroxissome proliferator-activated receptors
xxiii
PPARα Peroxisome proliferator-activated receptor alpha
PPAR Peroxisome proliferator-activated receptor gamma
RNA Ribonucleic Acid
SIRT1 Sirtuin 1
SRC-1 CBP/p300 and steroid receptor coactivator
Tat Tyrosine aminotransferase
TG
TORC2
Triglycerides
Transducer of regulated CREB protein 2
TZD Thiazolidinedione
WAT White adipose tissue
WT Wild type
1
1. INTRODUCTION
1.1.
Fasting
Mammals have evolved a metabolic response system that allows them to survive during long
periods of energy deprivation. The overall metabolic response to fasting operates at numerous
levels. One prominent feature is the gradual shift in whole-body fuel utilization from
carbohydrates and fat in the fed state to almost exclusively fat after a day of fasting [1]. This
adaptation is particularly striking in the brain, an obligate glucose utilizer in the fed state, which
is able to acquire energy predominantly from ketone bodies after prolonged fasting [2,3]. The
main metabolic fuels of the human body are glucose, fatty acids and ketone bodies. Its principal
energy stores are liver glycogen, adipose tissue triglyceride and muscle protein. Most of the
actual inter-conversions in energy substrates occur in liver, which plays a central role in the
adaptive response to fasting [4].
Prolonged fasting is characterized by low insulin concentrations, high glucagon, glucocorticoids
and epinephrine concentrations in plasma (Figure 1.1). In feeding/fasting conditions, these
counter regulatory hormones will maintain blood glucose levels [5].
In this state liver degrades glycogen into glucose. In addition, it receives glucogenic amino acids
such as alanine and lactate (from muscle) and glycerol (from adipose tissue) which are
precursors for gluconeogenesis or de novo synthesis of glucose [4]. Gluconeogenesis it is a highly polarized metabolic pathway involving biochemical reactions in different compartments
such as the cytoplasm, mitochondria, endoplasmic reticulum and plasma membrane. The rate
of gluconeogenesis is controlled by three key enzymes: phosphoenol-pyruvate carboxykinase
(PEPCK), fructose 1,6-bisphosphatase and glucose-6-phosphatase (G6P). Hormonal control of
these enzymes is achieved at the transcriptional level. The main positive signals to turn on
gluconeogenesis are activated during fasting, stress and diabetes. As already referred, among
these signals is glucagon that produces an increase in intracellular cAMP and glucocorticoids,
endogenous ligands for the glucocorticoid receptor [5].
The fasting liver also receives non-esterified fatty acids (mainly long chain fatty acids), released
from adipose tissue triglycerides [5]. The hormonal profile of the fasted state promotes the
hydrolysis of triacylglycerol in adipose tissue, thereby increasing the concentration of free fatty
acids (FFA) in plasma. The fatty acids are taken up by the liver, where they are either
re-esterified to triacylglycerol and secreted as very-light-density lipoproteins (VLDL) or oxidized in
the mitochondria via β-oxidation. The majority of fatty acids are only partially oxidized to
acetyl-coenzyme A (acetyl-CoA), which then condenses with itself to form ketone bodies, an important
2
Figure 1.1. The fasting state: The gluconeogenic liver.
3
1.2.
Molecular mechanisms regulating adaptation to fasting
1.2.1.
CREB/CRTC2 Signaling Pathway
Circulating glucose levels reflect a balance between glucose production by the liver and glucose
utilization by skeletal muscle. The liver, a key target of both insulin and glucagon signaling,
contributes to the control of glucose metabolism by facilitating glucose uptake and output
depending on the physiological condition [7]. Under fasting conditions, mammals initiate a whole
body metabolic response that limits glucose and favors fatty acid oxidation. In these conditions
the liver is central in the metabolic response to glucagon, epinephrine and glucocorticoids,
which act to stimulate hepatic glucose via glycolysis and gluconeogenesis in order to prevent
extend periods of hypoglycemia [8].
The gluconeogenic program is largely regulated at the transcriptional level, by the cyclic AMP
(cAMP) responsive element binding protein (CREB) and its ability to activate PGC-1α (PPAR
gamma coactivator- 1α) [9]. This response is dependent on the phosphorylation of CREB at
Ser133 mediated by protein kinase A (PKA) and the subsequent recruitment of the coactivators
CREB binding protein (CBP)/p300 to promoters of gluconeogenic genes (such as PEPCK and
G6P) [9]. The simplicity of this model, has been challenged with the discovery of the
CREB-regulated transcription coactivator 2 (CRTC2) [10] which has been implicated as the foremost
mediator driving CREB target expression [11].
In fact, CRTC2 was described as a critical component of the early transcriptional fasting
response in the liver by acting up-stream of PGC-1α in the gluconeogenic pathway [12, 13].
In the early state of fasting, circulating glucose and insulin levels are low, glucagon and/or
epinephrine signaling results in the dephosphorylation of CRTC2 and its translocation to the
nucleus where it drives the transcription of several genes implicated in gluconeogenesis by
specifically interacting with CREB and facilitating recruitment of the coactivators CBP and p300
to CREB target sequences. Following long-term stimulation, it has been proposed that CRTC2
is deacetylated by SIRT1 and targeted for degradation in proteasome (Figure 1.2) [13]. Sirtuin 1
(SIRT1) is a type III NAD+ dependent deacetylase (its role will be further explored in the next
section).
CRTC2 activity is also controlled by insulin signaling which results in CRTC2 phosphorylation
and exclusion from the nucleus where it can no longer impact gene expression [14].
Interestingly, whereas the increase in SIRT1 activity that accompanies prolonged fasting
attenuates CRTC2 signal, it actually improves PGC-1α’s ability to increase hepatic
gluconeogenesis [15]. In fact, maintenance of the gluconeogenic response through prolonged
4
Figure 1.2. Schematic diagram of the inducible switch that modulates gluconeogenesis through the CREB/CRTC2 signaling pathway.
5 1.2.2.
SIRT1
Caloric restriction causes many changes in glucose metabolism [16]. Recently, it was
suggested a model in which protein acetylation regulates metabolic strategy and also helps
store energy in cells [17]. In the cell, acetylation is carried out by histones acetyl transferases
(HATs) and deacetylation by class I, II and III deacetylases. The type III, NAD+ dependent
deacetylase is termed sirtuins [17]. Among sirtuins, SIRT1 – which modulates ageing in several
species [18, 19] – appears to be involved in a great number of physiological pathways, including
gluconeogenic/glycolytic pathways in liver in response to fasting signals through the
transcriptional coactivator PGC-1α [20]. Also, SIRT1 is known to target MyoD, p53 and forkhead
transcription factors for deacetylation [21, 22].
SIRT1 seems to be involved in pathways affected directly by caloric restriction in mammals [23].
Several studies showed that SIRT1 activity is low in growth conditions of glucose excess and
high during energy limitation [15, 16]. This behavior is due to SIRT1 being a NAD-dependent
deacetylase. In energy abundance conditions, there is ATP generation trough glycolysis and
conversion of NAD to NADH in mitochondria and therefore SIRT1 activity is expected to
decrease. This behavior suggests a feed forward mechanism, in which diet drives glycolysis,
convert NAD to NADH, inactivate sirtuins, and increase acetylation and activity of glycolytic
enzymes [17]. Conversely, under fasting or low nutrient conditions, limit glycolysis, activate
SIRT1 triggering protein deacetylation in mitochondria. These conditions, fit with one of the
main outputs of SIRT1 activity, the deacetylation of PGC-1α to promote mitochondrial
biogenesis and oxidative metabolism [15] (Figure 1.2).
This evidence, suggest protein acetylation as a regulatory mechanism, as well as
energy-storage mechanism when energy is in excess. The regulatory aspects include histone
acetylation to regulate gene transcription, acetylation of metabolic enzymes to favor glycolysis
for ATP production, and acetylation of several transcription factors such as p53, FOXO1, PGC-1α, nuclear receptors to adjust expression levels of pathways for oxidative versus glycolytic metabolism [24]. Regarding the transcription factors, SIRT1 has mainly been linked to negative
regulation of gene expression through protein deacetylation (e.g. p53) [25, 26]; however it can
act both positively and negatively to control gene expression as PGC-1α [15] in response to
NAD+ fluctuations in accordance to nutrient availability [13, 15, 16, 23].
The storage aspect of acetylation may be important in transitioning from energy access to
energy limitation. Under these conditions, the acetate generated by SIRT1 deacetylation of
many proteins would be a substract for acetyl-CoA synthethase. Along with the oxidation of fatty
6 1.2.3.
PGC-
1α
One of the components of the signal transduction pathway involved in metabolic reprogramming
is the peroxissome proliferator-activated receptor gamma coactivator-1α – PGC-1α. This
transcriptional co-activator is able to coordinate the expression of a wide array of genes
involved in glucose and fatty acid metabolism [3].
Molecular mechanisms of PGC-1α function
PGC-1α was first identified as a binding partner and co-activator of the transcriptional activity of PPAR [27]. It is known to bind and consequently modulate the activity of a wide range of transcription factors such as PPARα, glucocorticoid receptor, hepatic nuclear factor-4α (HNF4α), members of the estrogen related receptor (ERR) family, Foxo1, among others [28, 29].
Once it is activated, PGC-1α is recruited to the chromatin through interaction with transcription
factors [30]. After docking to a transcription factor, PGC-1α undergoes a conformational change
that allows interaction with histone acetyl transferases (HAT) such as CBP/p300 and steroid
receptor coactivator (SRC-1). This set of proteins interacts at the PGC-1α N-terminal region that
contains a potent transcriptional activation domain. Although they enhance the activity of PGC-1α, SRC-1 and CBP/300 do not acetylate PGC-1α. In fact, acetylation of PGC-1α, is correlated to a decrease in its activity [15].
This data reveal that the regulation of gene expression by PGC-1α is achieved by a sequential
and dynamic recruitment of different set of proteins making a functional multiprotein complex
that transcribes specific genes.
From a physiological standpoint, the co-activation of these transcription factors by PGC-1α has
important metabolic repercussions. Specifically, this set of transcription factors to which PGC-1α
binds, controls the expression of genes involved in adaptive thermogenesis, gluconeogenesis,
glycolysis, lipogenesis, mitochondrial fatty acid oxidation, and mitochondrial respiration
efficiency [3]. Thus, PGC-1α can single coordinate gene expression of multiple energy
7
PGC-1α in the adaptation to food deprivation
In terms of its contribution to the diet-dependent maintenance of energy homeostasis in
mammals, there is a body of evidence to suggest that the co-transcriptional activity of PGC-1α
is important to the compensatory metabolic responses that occur during food deprivation [3, 33].
During fasting, gluconeogenesis is profoundly up regulated primarily at the level of transcription.
As already described (in CREB/CRTC2 signaling pathway section) a compelling argument can
be made for dissecting the up regulation of gluconeogenesis into two temporally distinct phases
[13]. Regarding the adaptation to the maintenance of the gluconeogenic response through
prolonged fasting is thought to be mediated by PGC-1α and its transcription factors [3]. Indeed,
in the late state of fasting, the elevated levels of PGC-1α facilitate increased hepatic glucose
output by promoting the expression of gluconeogenic genes [29]. This regulation is mediated by
the hormones that signal fasting such as glucagon and insulin [34] but also by SIRT1 mediated
deacetylation [15].
As discussed above, during fasting glucagon activate via cAMP, the CREB transcription factor,
an important regulator of PGC-1α gene expression [9]. In addition, glucocorticoids strongly
synergize with cAMP to induce PGC-1α levels. Under this state, of lower nutrient availability,
intracellular NAD+ levels increase which leads to the deacetylation of PGC-1α by SIRT1 [35].
The change in PGC-1α acetylation coincides with an increased activation of PGC-1α which
binds and co-activates different transcription factors such as HNF4α and FOXO1 and
glucocorticoid receptors (GR) to coordinate expression of gluconeogenic genes [33, 36]. Insulin,
a dominant-negative signal suppresses PGC-1α expression in liver (Figure 1.3) [34].
FOXO1 acts as a cellular sensor of insulin signaling via Akt. Akt phosphorylates FOXO1 and
induces cytoplasmic localization and degradation. PGC-1α requires FOXO1 to bind and localize
to the promoter chromatin region of gluconeogenic genes [33]. This mechanism, corresponds
with the re-feeding state were PGC-1α activity decreases.
8
Figure 1.3. Transcriptional regulation of hepatic gluconeogenesis by PGC-1 alpha.
9 1.2.4.
FOXA2
A complex network functions to maintain whole body homeostasis of metabolites such as
glucose and amino acids. One group of such genes is FOXA (forkhead box A) family, also
known as hepatic nuclear factor 3 (HNF3) [32]. The mammalian FOXA family consists of three
members, FOXA 1, FOXA2 and FOXA3, which contribute to embryonic development [37] and to
hormonal control of gene expression [38]. FOXA proteins bind to similar recognition sequences
and the proteins are proposed to have redundant function in regulating some of their target
genes [39]. The Foxa genes appear to be involved in the protection of the organism from hypoglycemia [40, 41]. However, each FOXA protein has distinct functions.
Foxa2 is involved in the mechanisms regulating fasting and amino acid deprivation.
In the liver, some Foxa target genes identified are involved in glucose homeostasis, particularly
in the response to fasting [42]. Examples include the gluconeogenic enzymes
phosphoenolpyruvate carboxykinase (Pepck), glucose-6-phosphatase (G6p) and tyrosine
aminotransferase (Tat) [39].
The role of Foxa2 in hepatic glucose homeostasis was evaluated by Zhang et al [42], by genetic
approach using a mouse model in which Foxa2 was deleted specifically from hepatocytes.
Although these mice were normoglycemic, they fail to fully activate Pepck and Tat in response
to fasting. Furthermore, this group suggested that Foxa2 mediates activation of guconeogenic
genes by enabling recruitment of CREB and glucocorticoid receptors to their target sites in
chromatin [42]. The results of this study suggest that Foxa2 is required for execution of hepatic
gluconeogenic program, by integrating the transcriptional response of the hepatocyte to
hormonal regulation during fasting.
Recent work from Wolfrum and colleagues [43, 44] has introduced a new concept regarding
Foxa2 in nutrient metabolism. They have shown that in cultured cells the transcriptional activity of Foxa2 is blocked by treatment with insulin, and that this regulation requires an intact
phosphorylation site for the insulin-activated kinase of mouse Foxa2. This phosphorylation is
reported to result in nuclear exclusion of Foxa2, thereby providing an appealing molecular model in which Foxa2’s gluconeogenic activity is blocked via feeding-induced insulin secretion [43, 44].
The authors proposed a model in which Foxa2 is nuclear only in the starved state, during which
it activates multiple genes driving increased hepatic glucose utilization, fatty acid oxidation, and
10
Further, it was observed that under amino acid deprivation of HepG2 hepatoma cells
transcription of the Foxa2 gene was enhanced [45]. However, this activation did not required
activation of the transcription factor 4 (ATF4), a critical component of the conventional amino
acid response (AAR) pathway (this pathway will be discussed in ‘’Amino Acid deprivation”
section), but Foxa2 induction was partially dependent on CCAAT/enhancer-binding protein β
(which is induced upon amino acid deprivation) [45]. The results presented in this study
11
1.3.
Fatty Acid Signal Transduction Pathway
1.3.1.
Fatty Acid Oxidation
In the transition from the fed to the fasted state the liver switches from an organ of carbohydrate
utilization and fatty acid synthesis to one of fatty acid oxidation and ketone body production. The
fasted state is associated with mobilization of stored lipid in white adipose tissue and increase in fatty acid flux through the mitochondrial β-oxidation [46].
β-oxidation is the major process by which fatty acids are oxidized, thus providing a major source of energy for the heart and skeletal muscle [47, 48]. β-oxidation is stimulated during starvation
or endurance exercise [6] .
Fatty Acids are Activated and Transported into Mitochondria
The β-oxidation of activated fatty acids occurs within the mitochondrial matrix and is catalyzed by the sequential action of four enzyme families (acyl CoA dehydrogenase, enoyl-CoA
hydratase, 3-hydroxyacyl-CoA dehydrogenase and 3-ketoacyl- CoA thiolase) each with different
substrate specificity for short-, medium, and long-chain acyl-CoAs. Long-chain fatty acids are
activated on the mitochondrial outer membrane by the long-chain acyl-CoA synthetase (LCAS)
but the mitochondrial inner membrane is not permeable to these acyl-CoAs. The carnitine
dependent transport of these activated fatty acids precedes their β-oxidative chain shortening
[49].
This transport system consists of three proteins: carnitine palmitoytranferase I (CPT-I), carnitine
acylcarnitine translocase (CACT) and carnitine palmitoyltransferase II (CPT-II), each with a
different submitochondrial localization. As a first step, acyl CoAs formed by the catalytic action
of LCAS in the mitochondrial outer membrane are converted to acylcarnitines. This
transterification is catalyzed by CPT-I also localized in the mitochondrial outer membrane. The
reaction products, long-chain acylcarnitines, are then translocated into the mitochondrial matrix
in an exchange reaction catalyzed by CACT, an integral inner membrane protein. Within the
matrix the acylcarnitines are then reconverted to the respective acyl-CoAs by CPT-II, an
enzyme associated with the mitochondrial inner membrane (Figure 1.4) [50].
The carnitine-mediated entry process is the rate limiting step for oxidation of fatty acids in
12
Oxidation of Fatty Acids
Mitochondial β-oxidation of fatty acids takes place in three stages. In the first stage (β-oxidation)
the fatty acids undergo oxidative removal of successive two carbon units in the form of
acetyl-CoA [50].
In the second stage of fatty acid oxidation, the acetyl groups of acetyl CoA are oxidized to CO2
in the citric cycle, which take place in the mitochondrial matrix. The first two stages of fatty acid
oxidation produce the reduced electron carriers NADH and FADH2, which in the third stage
donate electrons to the mitochondrial respiratory chain, through which the electrons pass to
oxygen with the concomitant phosphorylation of ADP to ATP. The energy released by fatty acid
oxidation is conserved as ATP [6].
Figure 1.4. Fatty acid entry into mitochondria via acyl carnitine/carnitine transporter.
13
Hepatic regulation of mitochondrial β-oxidation
Much of the control and regulation of the rate of hepatic mitochondrial β-oxidation appears to reside at the level of the entry of acyl groups into mitochondria.
Malonyl-CoA is the first intermediate in the cytosolic biosynthesis of long-chain fatty acids from
acetyl-CoA, increases in concentration whenever the body is well supplied with carbohydrate;
excess glucose that cannot be oxidized or stored as glycogen is converted in the cytosol into
fatty acids for storage as triacylglycerol. The inhibition of CPT-I by malonyl CoA ensures that the
oxidation of fatty acids is inhibited in the fed state [6, 50].
1.3.2.
Ketogenesis
Ketogenesis becomes significant under conditions of food (carbohydrate) deprivation. Provision
of peripheral tissues, such as skeletal muscle and heart, with ketone bodies as an alternative
fuel for energy production, results in glucose sparing for organs depending on glucose as an
energy source [51, 52]. The ketone bodies play an important role in this adaptation: starvation
induces an increase in plasma ketone bodies concentration and turnover serving as an
important fuel for the central nervous system [53].
In fasting conditions the liver needs to maintain the Krebs cycle for ATP production and
gluconeogenesis for supplying glucose for extrahepatic tissues. Since these two processes
require the same intermediates, having oxaloacetate as rate-limiting enzyme, both begin to slow
down. As a result acetyl CoA accumulates in the mitochondria [54]. Through a serie of
condensation reactions (Figure 1.5), ketone bodies (acetoacetate, β-hydroxybutyrate and
acetone) are produced [53].
The sum of these reactions is β-hydroxybutyrate, formed by the reduction of acetoacetate in the
14
Although fatty acids are by far the major carbon donors, for ketone body synthesis, the
catabolism of some (ketogenic) amino acids also provides carbon atoms for ketogenesis, either
via acetyl-CoA or directly by yielding acetoacetate [52].
Control of ketogenesis is exerted by transcriptional regulation of mitochondrial
3-hydroxy-3-methylglutaryl-CoA (HMG-CoA) synthase 2 (HMGCS2) [51, 52, 56]. The transcriptional rate of
this rate-limiting enzyme increases in response to cAMP, starvation, fat feeding and diabetes
while insulin and refeeding repress it [57, 58]. Regarding to its transcriptional control, results of this group suggested that HMGCS2 expression is affected by the PPARα-mediated response and it is also involved in the induction of β-oxidation [59].
15 1.3.3.
PPARs
Nutrient availability impact gene expression mainly by activating or suppressing specific
transcription factors [60]. The most important group of transcription factors involved in mediating
the effect of nutrients and their metabolites one gene transcription is the superfamily of nuclear
receptors [61]. Several studies have shown that a group of nuclear hormone receptors, the
peroxisome proliferator-activated receptors (PPARs), have an important role in fatty acid
metabolism [62].
Nuclear receptors govern gene expression via several distinct mechanisms that involve both
activation and repression of DNA transcription. PPARs are members of the nuclear hormone
superfamily. [63]. Transcriptional regulation by PPARs requires heterodimerization with the
retinoid X receptor (RXR) which is also part of the nuclear receptor superfamily. When activated
by a ligand, the PPAR/ RXR heterodimer stimulates transcription via binding to DNA response
elements – PPAR response elements (PPRE) – present in the promoter of target genes [64].
The PPAR family consists in three isotypes: α, δ and
that can be distinguished and
characterized by different biological roles (Table 1.1) [65].Table 1.1. Simplified overview of current understanding of the metabolic roles of the 3 PPAR
16
1.3.3.1.
PPAR
α
PPARα plays a crucial role in the control of lipid metabolism in response to nutritional, hormonal and environmental stimuli. It was described to be highly expressed in organs that carry out
significant catabolism of fatty acids such as the liver, brown adipose tissue, heart, intestine and
kidney [67, 68]. Therefore, identification of PPARα target genes has concentrated mainly on cellular lipid metabolism in the context of the hepatocyte. Indeed, the first PPARα target gene identified was acyl-coenzyme A oxidase [69] involved in fatty acid β-oxidation. Numerous genes
involved in hepatic fatty acid oxidation were shown to be induced by PPAR α. Results from this
group have been relevant for the identification and characterization of functional PPREs in key
regulatory genes such as HMGCS2 (rate-limiting enzyme of ketogenesis); CPT1 and CPT2 (involved in mitochondrial β-oxidation).
PPARα can be activated by at least 2 different mechanisms. First, during fasting, the expression of PPARα in liver increases, an effect mediated by glucocorticoids that results in an increased amount of PPARα protein. Second the fatty acids that are liberated from the adipose tissue and travel to the liver may serve as ligands for PPARα. By means of such mechanism, the organism
assures that the enzymatic system of the liver responds appropriately to the increased demands
for fatty acid oxidation.
1.3.3.2.
PPAR
PPAR is a master regulator for adipocyte differentiation [64, 70-72]. PPAR also regulates lipid
metabolism, insulin sensitivity, cardiovascular disease, inflammation, organ development and tumor formation [73, 74]. PPAR has two isoforms, PPAR1 and PPAR2, which are created by alternative splicing [75]. PPAR1 is expressed in several tissues including liver, whereas PPAR2 is exclusively expressed in adipocytes, where it is key orchestrator of the cascade
underlying adipocyte differentiation along with the CCAAT enhancer binding protein (C/EBP) [74]. The currently favored hypothesis is that C/EBP induces expression of PPAR, which
provides the initial trigger for the adipogenic program [74].
PPAR also plays a key role in the switch of adipose tissue lipid metabolism to nutritional state.
Its expression is highest postprandially [76] and its activation leads to the up-regulation of genes
that mediate fatty acid up-take [77, 78]. PPAR may also promote a futile cycling in adypocytes
17
Given the central role of PPAR in the promotion of adipogenesis and the link between adiposity and insulin resistance, the discovery that PPAR is the target for the thiazolidinedione (TZD)
antidiabetic drugs was unexpected [66]. In fact, several lines of evidence support the
conclusion that TZDs exert their biological effects on insulin sensitivity through binding to PPAR (Figure 1.6).
TZDs appear to coordinately activate gene expression leading to an increase in net lipid partitioning into adipocytes. Target genes directly regulated by PPAR that are involved in this
pathway include lipoprotein lipase [77] and fatty-acid transport protein [80] which all favor
adipocyte uptake of circulating fatty acids; phosphoenolpyruvate carboxykinase [81], glycerol
kinase [79], which promote recycling rather than export of intracellular fatty acids.
Together, these pathways lead to the net flux of fatty acids from the circulation and other tissues
into adipocytes.
18 1.3.4.
Fsp27/CIDEC
Fat specific protein 27 (FSP27) or cell death inducing DFF45-like effector C (CIDEC), the
human homologue of FSP27 belong to the CIDE family [82, 83]. FSP27/CIDEC was described as an important regulator of energy homeostasis and its functions are closely linked to the
development of metabolic disorders including obesity, diabetes and liver steatosis [72, 84].
The CIDE family consists into three isoforms: CIDEA, CIDEB and FSP27/CIDEC. CIDEA is
highly expressed in brown adipose tissue and CIDEB in liver [82]. Regarding to the tissue
distribution of FSP27/CIDEC it was described that it was highly and specifically expressed in brown and white adipose tissue [85]. Interestingly, FSP27 is also highly expressed in the fatty liver of typical diabetes or obese model ob/ob mouse and in the high fat-inducible fatty liver.
In eukaryotic cells the excess of lipids are store in the white adipose tissue in lipid droplets.
FSP27/CIDEC was identified as a new lipid droplet associated protein that was shown to be involved in the formation and modulation of the size of unicular lipid droplets through their
protection from lipolysis and it is required for the efficient accumulation of triacylglycerols in
mature adipocytes [85, 86].
The expression of many adipocyte specific genes is affected by diettary manipulation. It was
demonstrated that long-term intermittent fasting, significantly up-regulated FSP27 gene expression in WAT [86] and that PPAR2, C/EBPα, and insulin could be involved in its
nutritional regulation.
The role of FSP27 in promoting lipid droplet formation is not restricted to adipocytes. In fact, although FSP27/CIDEC is not expressed in normal liver, it was described to be highly expressed during hepatic steatosis since the excess of lipids stimulate the expression of lipid
droplet associated proteins [72].
In hepatic steatosis, the expression of Fsp27/CIDEC is induced by proliferator-activated
receptor
(PPAR). Serially deleted
FSP27 luciferase reporter plasmids and chromatinimmunoprecipitatation (ChIP) assays revealed the presence of a functional PPAR response element and direct binding of PPARto this element. Corroborating these findings, the
expression of the mouse promoter FSP27 was markedly increase by the treatment with
thiazolidinedione (TDZ), rosiglitazone – a specific ligand for PPAR. However, FSP27 was not activated by specific ligands of PPARα or PPARδ [72].
19
may be due to impaired β-oxidation activity and reduced triglyceride turnover. Whether how FSP27 suppresses β-oxidation activity remains unclear, however it was proposed that since
FSP27 suppresses lipolysis there will be a lack of fatty acyl-CoA released from TG and this
event will in turn impair mitochondrial β-oxidation.
Recent data of this laboratory demonstrated that Hmgcs2, which regulates ketone body production, also regulates fatty acid oxidation [59]. Also, specific depletion of this enzyme
correlates with 25% decrease in serum ketone bodies in fasted animals, and altered gene
expression. By, microarray analysis (Table 1.2) it was showed that the gene most-up regulated
in fasted animals when ketogenesis and FAO were blocked was FSP27/CIDEC.
Table 1.2. Genes that are up regulated by HMGCS2 knock down.List of differentially expressed genes (up regulated >1.6 fold) in a microarray Affymetrix® (GeneChip Mouse Gene 1.0ST) performed with RNA
of liver of shRNA control or shRNA Hmgcs2 treated mice (n=3). (Unpublished data from Haro D. and
Marrero P., School of Pharmacy, University of Barcelona)
This finding prompted this group to further elucidate the role of FSP27/CIDEC during adaptation to fasting. It was demonstrated that during the early stages of fasting (<12-18h) FSP27 expression was significantly increased (Figure 1.7A) and this expression decreased during the
later phase of fasting (>12-18h) while Hmgcs2 and other FAO genes (Cpt1a, Cact, Cpt2), showed maximal expression (Figure 1.7B). At this point, the results suggested a kinetic
mechanism of auto-regulation between short- and long-term fasting by which free fatty acids
that arrive to the liver during early fasting are fated to accumulation/exportation by
20
A
B
Figure 1.7. Hepatic Fsp27 expression is induced by early fasting.
21 1.4.
Amino acid deprivation
Mammals have evolved a wide range of adaptive mechanisms to detect and respond to
fluctuations in dietary protein nutrients. At the level of individual cells, dietary protein limitation is
manifested as amino acid deprivation, which activates an amino acid response (AAR) signal
transduction pathway. Amino acid limitation regulates numerous steps in gene expression
including chromatin structure, transcription start site, transcription rates, mRNA splicing and
RNA export, turnover and translation [87].
Amino acid response pathway
Limiting the extracellular supply of an essential amino acid or blocking the synthesis of an
otherwise nonessential one results in an increase in uncharged tRNA that binds to and activates
the general control nonderepressible protein 2 (GCN2) kinase. In this manner, the GCN2
protein serves as a sensor of amino acid insufficiency. Thus depletion at the cellular level of any
individual amino acid can trigger AAR. Once activated, GCN2 kinase phosphorylates the
translation factor eIF-2α that suppresses general protein synthesis but promotes a paradoxical
increase in translation of mRNA species. Among these are several activating transcription
factors such as ATF4. ATF4 triggers increased transcription by binding to (CCACT-enhancer
binding protein-activating transcription facto C/EBP-ATF response elements (CARE)), so named
because they are composed of a half-site for the C/EBP family and a half-site for the ATF family
transcription factors. The products of these CARE -containing genes modulate a wide spectrum
23 2. THESIS GOAL
Currently, whereas the role of Fsp27/CIDEC begins to be better understood in adipose tissue, little is known about its physiology in liver. As discussed above, previous results of this group
showed that the Fsp27/CIDEC gene expression is regulated in a time-dependent manner during fasting in liver, being induced in the early steps of fasting and decreased after a longer period.
These previous results and the importance of Fsp27/CIDEC in regulating energy homeostasis,
including its modulation by FAO prompted the present study where we aimed to further explore
the physiologic role and to provide mechanistic insight of Fsp27/CIDEC regulation in adaptation to fasting response in HepG2 cells. We aimed to specifically answer two questions: 1) Why
CIDEC expression decreases during prolonged fasting and 2) How FAO affects CIDEC expression.
In the second part of the present study we aimed to elucidate if the mechanism by which Pgc-1α becomes activated in response to prolonged fasting and amino acid deprivation is somehow
mediated by Foxa2. This notion is based in the suggestion that Foxa2 could be involved in the regulation of metabolic adaptation to low nutrient conditions such as fasting and amino acid
deprivation in hepatocytes. This hypothesis, is further based in recent results of this group
25
3. MATHERIALS AND METHODS
3.1.
Plasmid DNA preparation
To obtain the plasmid DNA used in this study, the interest mouse promoters (Pgc-1α and
Fsp27) were amplified by PCR, with Taq polymerase (Biotools), dNTPS, specific primers (see
plasmid construct below) and mouse genomic DNA. The amplified product was run in an
agarose gel to verify the product size. The band of interest was cut from the gel and purified
with the Wizard SV Gel and PCR Clean System kit(Promega), according to the manufacturer’s instructions.
After quantification of the purified product on NanoDrop-1000 (NanoDrop Technologies, Inc. Thermo Scientific) the product was inserted in a pGEM-T vector, according to the
protocol pGEM-T and pGEM-T Easy Vector (Promega).
The plasmid DNA was transformed into competent cells E.coliDH5α, previously prepared by salt washes (CaCl2) to permeabilize them, and frozen at -80
0
C, and then plated on indicator
agar plates (AIX plates: 100 mg/L ampicillin, 8 mg/L IPTG, and 40 g/L XGal) for selection.
The plates were incubated overnight at 37ºC; recombinants were selected by blue/white
secreening on indicator plates. Positive white colonies are incapable to hydrolyze the substracte
X-Gal because the insert causes the loss of the β-galactosidase activity, while colonies that
have incorporated the empty vector (negative colonies) are blue due to the presence of the X-
Gal hydrolysis products. The white positive colonies were left to grow overnight in 3 mL LB
inoculums, with selection antibiotic (ampicillin).
The plasmid DNA from inoculums was obtained with a commercial kit PureYield Plasmid Miniprep System (Promega). The plasmid DNA was sequenced (Macrogen sequencing service).
After sequencing, the insert was released from pGEM-T, with restriction enzymes specific for
the sequence amplified (see plasmid construct below), and ran in an agarose gel. The bands
were purified (with the Wizard SV Gel and PCR Clean System kit (Promega)) and the insert was
subcloned into the pGL3b vector.
The plasmid DNA was transformed in competent cells E.coli DH5α and plated in agar plates with the selection antibiotic for pGL3b (ampicillin). Selection of positive colonies was performed
through PCR screening. The DNA of the positive colonies selected was obtained with a
26
3.2.
Plasmid construct and site directed mutagenesis
3.2.1. Mouse PGC1-α promoter
The PGC-1α promoter (nt -2010/-51 to the relative transcription start site) was amplified by PCR
from mouse genomic DNA using Taq polymerase (Biotools) with the oligonucleotides forward
(DH1384) and reverse (DH1385) containing the sequence of the restriction sites MluI and XhoI respectively (italicized and bolded in the primer sequence, see Primer Design, “Cloning” section
in Annex). The PCR products were cloned in the vector pGEM-T and sequenced (Macrogen
sequencing service). This plasmid was digested with MluI and XhoI and subcloned into the promoter firefly luciferase reporter gene vector pGL3-Basic (Promega).
3.2.2. Mouse Fsp27 promoter
The Fsp27 promoter (nt -2054/+18 to the relative transcription start site) was amplified by PCR from mouse genomic DNA using Taq polymerase (Biotools) with the oligonucleotides forward
(DH1303) and reverse (DH1304) containing the sequence of the restriction sites MluI and XhoI respectively (italicized and bolded in the primer sequence see Primer Design, “Cloning” section
in Annex). The PCR products were cloned in the vector pGEM-T and sequenced (Macrogen
sequencing service). This plasmid was digested with MluI and XhoI and subcloned into the promoter firefly luciferase reporter gene vector pGL3-Basic (Promega).
1.2.2.3. QuikChange™ Site-Directed Mutagenesis Kit
The mutations in the CREB identified sequences in the mouse Fsp27 promoter were generated by site directed mutagenesis, carried out by a commercial kit - QuickChangeTMSite-Directed Mutagenesis (Stratagene) following the manufacturer’s instructions. The mutants were generated by point mutations replacing the original sequences TGACTTCA (CRE1 site,
-375/-366) and CGTCA (CRE2 half site, -1792/-1787) by TGAGTATC and ATCGC respectively in both sense and antisense orientations, following the manufacturer’s instructions (see primer design, “Site direct mutagenesis” section in Annex).
The QuikChange site-directed mutagenesis kit is used to make point mutations, switch amino
acids, and delete or insert single or multiple amino acids. The QuikChange site-directed mutagenesis method is performed using PfuTurbo™ DNA polymerase ll and a thermal temperature cycler PfuTurbo DNA polymerase replicates both plasmid strands with high fidelity
and without displacing the mutant oligonucleotide primers. The basic procedure utilizes a
supercoiled double-stranded DNA (dsDNA) vector with an insert of interest and two synthetic
27
complementary to opposite strands of the vector, are extended during temperature cycling by
using PfuTurbo DNA polymerase. Incorporation of the oligonucleotide primers generates a
mutated plasmid containing staggered nicks. Following temperature cycling, the product is
treated with Dpn I. The Dpn I endonuclease is specific for methylated and hemimethylated DNA
and is used to digest the parental DNA template and to select for mutation-containing
synthesized DNA.
3.2.3. Automatic sequenciation of DNA
The sequences and orientations of the constructions were verified by sequencing – Macrogen
Inc. (Macrogen sequencing service).
3.2.4. DNA oligonucleotide (primers)
All DNA oligos were synthesized by Sigma-Aldrich with technology ultra-high base coupling
efficiency, combined with optimized cartridge purification and 100% quality control by mass
spectrometry (Designed primer sequences are listed in the Annex).
3.3.
Cell culture
Cell Line Description Reference
HepG2 Human liver carcinoma (Hommo sapiens) ATCC No. HB-8065
HepG2 are adherent, epithelial-like cells growing as monolayers and in small aggregates.
HepG2 cell line was derived from the liver tissue of fifteen year old male with differentiated
hepatocelullar carcinoma.
The human hepatocellular carcinoma cells HepG2 were cultured in Eagle's Minimum Essential
Medium (MEM) supplemented with 4 mM glutamine, 100 μg/ml streptomycin sulfate, 100
units/ml penicillin G, and 10% (v/v) fetal bovine serum (FBS). Cells were incubated at 37°C in
humidified atmosphere containing 5% CO2. Culture medium was discarded and changed every
2-3 days. To passage, cells were briefly washed twice with 1xPBS and 0.05% Trypsin-EDTA
solution was added. The cell layer dispersed at 37°C for 5 min, trypsin was deactivated by
adding complete growth medium. Cells were split 1:4 dilution every 5 days or counted (Trypan
Blue stain method) and plated according the final experiment. Cells were replenished with fresh
medium before all experiments. To induce the fasting response, cells were incubated for 16
hours in a serum-free medium – Opti-MEM (Invitrogen) and supplemented with or without 10
![Figure 1.5. Formation of ketone bodies from acetyl-CoA. Adapted from Lehninger, Principles of Biochemistry 2005 [6].](https://thumb-eu.123doks.com/thumbv2/123dok_br/16679132.743090/40.892.250.604.137.559/figure-formation-ketone-bodies-adapted-lehninger-principles-biochemistry.webp)
![Figure 1.6. The insulin sensitization action of PPAR gamma. Adapted from Lehrke et al., 2005 [73].](https://thumb-eu.123doks.com/thumbv2/123dok_br/16679132.743090/43.892.200.649.523.795/figure-insulin-sensitization-action-ppar-gamma-adapted-lehrke.webp)