Robustness of the Process of Nucleoid Exclusion of Protein Aggregates
in
Escherichia coli
Ramakanth Neeli-Venkata,a
Antti Martikainen,a
Abhishekh Gupta,a
Nadia Gonçalves,a
Jose Fonseca,b
Andre S. Ribeiroa Laboratory of Biosystem Dynamics, Department of Signal Processing, Tampere University of Technology, Tampere, Finlanda
; UNINOVA, Instituto de Desenvolvimento de Novas Tecnologias, Campus FCT-UNL, Caparica, Portugalb
ABSTRACT
Escherichia colisegregates protein aggregates to the poles by nucleoid exclusion. Combined with cell divisions, this generates
heterogeneous aggregate distributions in subsequent cell generations. We studied the robustness of this process with differing medium richness and antibiotics stress, which affect nucleoid size, using multimodal, time-lapse microscopy of live cells ex-pressing both a fluorescently tagged chaperone (IbpA), which identifiesin vivothe location of aggregates, and HupA-mCherry, a
fluorescent variant of a nucleoid-associated protein. We find that the relative sizes of the nucleoid’s major and minor axes change widely, in a positively correlated fashion, with medium richness and antibiotic stress. The aggregate’s distribution along the major cell axis also changes between conditions and in agreement with the nucleoid exclusion phenomenon. Consequently, the fraction of aggregates at the midcell region prior to cell division differs between conditions, which will affect the degree of asymmetries in the partitioning of aggregates between cells of future generations. Finally, from the location of the peak of anisot-ropy in the aggregate displacement distribution, the nucleoid relative size, and the spatiotemporal aggregate distribution, we find that the exclusion of detectable aggregates from midcell is most pronounced in cells with mid-sized nucleoids, which are most common under optimal conditions. We conclude that the aggregate management mechanisms ofE. coliare significantly
robust but are not immune to stresses due to the tangible effect that these have on nucleoid size.
IMPORTANCE
Escherichia colisegregates protein aggregates to the poles by nucleoid exclusion. From live single-cell microscopy studies of the
robustness of this process to various stresses known to affect nucleoid size, we find that nucleoid size and aggregate preferential locations change concordantly between conditions. Also, the degree of influence of the nucleoid on aggregate positioning differs between conditions, causing aggregate numbers at midcell to differ in cell division events, which will affect the degree of asym-metries in the partitioning of aggregates between cells of future generations. Finally, we find that aggregate segregation to the cell poles is most pronounced in cells with mid-sized nucleoids. We conclude that the energy-free process of the midcell exclusion of aggregates partially loses effectiveness under stressful conditions.
A
ging can be defined as a progressive loss of functionality and increased death incidence with time. Even simpler organisms, such asEscherichia coli, are not exempted (1). While under opti-mal conditions mostE. colicells in a population appear to perpet-uate by dividing into genetically identical, functional cells, there are a few individuals that exhibit reduced or no reproductive ca-pability (1,2). As in other organisms (3,4), the reduced vitality of those individuals appears to be linked to the excessive accumula-tion of nonfuncaccumula-tional proteins (5).E. colihas evolved a complex machinery to enhance protein functionality. Chaperones, e.g., GroEL and DnaK (6), catalyze the proper folding of stable proteins, preventing aggregation, and as-sist in the rescue of misfolded ones (7). When these mechanisms fail, the protease machinery can target some misfolded proteins for degradation (8,9). Likely due to this and perhaps to ensure the existence of raw material for novel proteins,E. colidegrades cer-tain fractions of proteins at all times (10,11). Finally, when pro-tein degradation is impaired,E. colicells are able to aggregate the misfolded proteins, making use of the exposed hydrophobic surfaces of the misfolded proteins that can interact with one another (12,13). Recent evidence suggests that the aggregation process is not energy free (14); thus, it likely is essential for proper cell functioning. Interestingly, this process exhibits similarities to events in eukaryotic cells, whose malfunctioning
has been linked to diseases such as Huntington’s, Alzheimer’s, and Parkinson’s (15).
Active protein aggregation in bacteria is common in stressful environments (2,5,14,16) and likely minimizes the harmful ef-fects of nonfunctional proteins. However, the accumulation of such aggregates also interferes with cellular functioning, thereby compromising cellular fitness (2,5). Importantly, these aggregates are passively segregated to the poles by an energy-free volume exclusion mechanism, made possible by the presence of the nu-cleoid at the midcell region (16,17), similar to the processes of the polar segregation of plasmids (18,19) and other large complexes
Received15 October 2015Accepted22 December 2015 Accepted manuscript posted online4 January 2016
CitationNeeli-Venkata R, Martikainen A, Gupta A, Gonçalves N, Fonseca J, Ribeiro AS. 2016. Robustness of the process of nucleoid exclusion of protein aggregates inEscherichia coli. J Bacteriol 198:898 –906.doi:10.1128/JB.00848-15.
Editor:V. J. DiRita, Michigan State University
Address correspondence to Andre S. Ribeiro, [email protected]. A.M., A.G., and N.G. contributed equally.
Supplemental material for this article may be found athttp://dx.doi.org/10.1128 /JB.00848-15.
Copyright © 2016, American Society for Microbiology. All Rights Reserved.
on May 8, 2018 by B-ON FCCN TRIAL
http://jb.asm.org/
(20, 21). Consequently, division events will generate daughter cells that have at least one (the newer) pole free of aggregates (5). In subsequent generations, aggregates become heterogeneously distributed among the cell population, and those cells with more aggregates exhibit diminished growth rate, while their sister cells remain functional (5). Relevantly, this process is present not only under stressed conditions but also under nonstressed conditions, albeit at a lower rate (5).
A recent study (21) tracked synthetic, stable, fluorescent aggre-gates across a few cell generations and showed that, under optimal growth conditions, aggregates are excluded from midcell (unbi-asedly) to the older and newer cell poles and then are tightly re-tained there, exhibiting escape times of (at least) the same order of magnitude as the cell division time. As in the case of natural ag-gregates (5,16,17), their retention is caused by nucleoid occlu-sion. This can be demonstrated by the fact that, rather than exhib-iting reduced velocities at the poles, the aggregates exhibit only a strong anisotropy in their displacement distribution that occurs at the nucleoid borders and is similar in intensity to the anisotropy at the cell extremities but opposite in direction (21). Further, as the nucleoid replicates and the two sister nucleoids move to the focal points of the cell, the peaks of anisotropy “follow” the nucleoids’ repositioning, and new aggregates now also accumulate between the two sister nucleoids (21). Finally, another recent work (17) showed that the kinetics of aggregates is always purely diffusive, in agreement with the absence of active transport mechanisms.
The nucleoid is usually at midcell, has an ellipsoidal shape, and is confined within the cell cylinder (22). Among other things, it contains DNA, RNA, and nucleoid-associated proteins (NAPs), which are involved in its structural organization. Major NAPs include H-NS, HU, Fis, IHF, and StpA. The dimeric histone-like protein HU, highly abundant and involved in DNA compaction (23), can be used to assess the nucleoid’s morphology and posi-tioningin vivowhen fused with mCherry (22).
The morphology of the nucleoid is sensitive to medium com-position and antibiotic stresses (24–27). One such stress-inducing antibiotic is chloramphenicol, which halts translation elongation by blocking access of charged tRNA to the ribosomal A site (28), leading to nucleoid compaction (25). Meanwhile, another antibi-otic, rifampin, blocks transcription initiation by binding to RNA polymerases (29), leading to nucleoid expansion (27). Meanwhile, medium richness affects the nucleoid size by affecting the cell growth rate (30,31). For example, in minimal M63 glycerol me-dium, nucleoids are relatively larger than in lysogeny broth (LB) medium (32). Nucleoids also are relatively larger in terrific broth (TB) medium (considered to be a rich medium), perhaps due to the absence of important, unidentified nutrients that are present in LB medium (33).
Even though such stress-induced changes in nucleoid mor-phology do not suffice to affect the degree of exclusion of aggre-gates from inside the nucleoid, they likely alter the efficiency with which aggregates are excluded from midcell and retained at the poles, including during cell division. Importantly, if a large num-ber of cells of a population contain more than 1 aggregate (e.g., when cells are subject to heat shock [16], various natural antibi-otics such as streptomycin [5], conditions leading to enhanced gene expression rates [34], etc.), the locations of the aggregates the moment prior to division will affect the distribution of aggregate numbers in cells of future generations (35,36). Consequently, in enhanced aggregate production conditions, changes in nucleoid
morphology could affect the generation of asymmetries in num-bers of aggregates in cells of future generations (1,5,27,37).
Here, we use single-cell, time-lapse, multimodal fluorescence microscopy to investigate how medium richness and antibiotic stresses affect the nucleoid size and positioning and, in doing so, affect the long-term spatial distribution of protein aggregates inE. coli. For this, we also investigate whether the aggregate dynamics, within the range of visibility, differs with aggregate size. Measure-ments were conducted using theE. coliMGAY strain expressing IbpA-yellow fluorescent protein (YFP) (5) and harboring the plas-mid expressing the nucleoid-tagging protein HupA-mCherry (22), whose expression is controlled by a constitutive promoter. We selected IbpA-YFP, since it has been shown to be an accurate identifier of thein vivo localization of aggregated proteins (5). Meanwhile, HupA-mCherry was selected for the reasons men-tioned above.
MATERIALS AND METHODS
Chemicals.Components of lysogeny broth (LB), terrific broth (TB), and M63 minimal medium forE. colicultures, 4=, 6-diamidino-2-phenylin-dole (DAPI), formaldehyde, and the agarose for the microscopic slide gel preparations were purchased from Sigma-Aldrich. Amino acids and vita-mins were purchased from Gibco.
Bacterial strains and plasmids.TheEscherichia coliMG1655 (MGAY) strain carrying theibpA-yfpsequence in the chromosome under the con-trol of the endogenous chromosomalibpApromoter was used for all measurements (a kind gift from Ariel Lindner, Paris Descartes University, France). This strain was modified by us so as to also harbor a plasmid expressing HupA-mCherry (a nucleoid-tagging protein) under the con-trol of a constitutive promoter with ampicillin resistance (a kind gift from Nancy Kleckner, Harvard University). This original form of the plasmid was modified by removing TetR-mVenus and the promoter controlling its expression, since it would interfere with our measurements of IbpA-YFP. We refer to this strain as MGAY-HupA-mCherry.
Growth conditions.We used a rich medium (TB), an optimal me-dium (LB), and a poor meme-dium (M63 with glycerol as the carbon source), in accordance with the definitions of medium richness in references30to 32. The composition of the LB medium was 10 g liter⫺1tryptone, 5 g
liter⫺1yeast extract, and 5 g liter⫺1NaCl. The composition of the TB
medium was 12 g liter⫺1tryptone, 24 g liter⫺1yeast extract, 0.4% glycerol,
and TB salts (KH2PO4and K2HPO4). The M63 medium was prepared
using M63 salts supplemented with 0.4% glycerol and 20% Casamino Acids. MGAY and MGAY-HupA-mCherry cells were grown overnight from single colonies at 37°C with vigorous shaking (250 rpm) in the re-spective medium. For the latter, we supplemented the medium with 50g ml⫺1ampicillin.
Growth rate measurements.Growth rates were measured at 37°C in the appropriate medium (without antibiotics) using a spectrophotometer (Ultrospec 10; GE Health Care). The cultures were grown overnight with continuous shaking. Overnight cultures next were diluted into fresh me-dium to an optical density at 600 nm (OD600) of 0.05, and we recorded the
OD600values every 30 min up to 4 h to obtain growth curves for each
medium condition in the presence and absence of streptomycin. Results are shown in Fig. S1 in the supplemental material. In all cases, streptomy-cin negatively affects the growth rates (very mildly in TB medium). Note that the live cell imaging is made during the first hour after adding strep-tomycin (see below), during which the growth rates are still positive under all conditions.
Cell growth and induction of protein aggregates.Overnight cultures were diluted (1:200) into fresh medium supplemented with antibiotics and incubated at 37°C, with shaking until reaching an OD600of 0.3. At this
stage, to induce the protein aggregates, cells were incubated with strepto-mycin (10g ml⫺1) 30 min before placing them on the slide. The cells
then were centrifuged and supernatant was discarded. From these, 4l of
on May 8, 2018 by B-ON FCCN TRIAL
http://jb.asm.org/
cells was placed on a 1% agarose gel pad prepared in the respective me-dium for image acquisition.
Nucleoid perturbation by antibiotics.In some cases, we used chlor-amphenicol and rifampin to alter the relative size of nucleoids in the cells. Chloramphenicol inhibits translation, which leads to nucleoid condensa-tion (25,27). Rifampin inhibits transcription, which results in nucleoid expansion (26,27). Chloramphenicol (100g ml⫺1) and rifampin (100
g ml⫺1dissolved in dimethyl sulfoxide [DMSO]) were added after
ag-gregate induction. We observed that at these concentrations, both antibi-otics reduce the cell growth significantly but do not halt it completely.
Nucleoid visualization by HupA-mCherry tagging and by DAPI staining.HupA-mCherry (22) is constitutively expressed from a plasmid (MGAY-HupA-mCherry strain); thus, no activation procedure is re-quired.
DAPI stains nucleoids specifically with little or no cytoplasmic labeling by binding to A-T-rich regions of the DNA (38). Following the induction of the production of IbpA-tagged aggregates, cells were fixed with 3.7% formaldehyde in phosphate-buffered saline (PBS) for 30 min and then washed with PBS to remove excess formaldehyde. The pellets were sus-pended in PBS, and DAPI (2g · ml⫺1) was added to this suspension.
After being incubated for 20 min in the dark, cells were centrifuged and washed twice with PBS to remove excess DAPI. Cells then were resus-pended in PBS, and 8-l aliquots of these samples were placed on 1% agarose gel pads prepared in appropriate media for microscopy observa-tion. DAPI measurements were performed on the original MGAY strain. It has been reported that DAPI causes nucleoid expansion (39). How-ever, this is not expected to affect our conclusions, as we only use these data to compare nucleoid sizes between conditions in order to validate (at a qualitative level) the comparative analysis performed by HupA-mCherry tagging.
Microscopy.We used multimodal time-lapse microscopy for the vi-sualization of cells and fluorescence within both IbpA-YFP aggregates and DAPI-stained or HupA-mCherry-tagged nucleoids.
We conducted measurements of IbpA aggregates and DAPI-stained nucleoids (MGAY strain) at a single time point. Similar measurements of IbpA aggregates and HupA-mCherry-tagged nucleoids (MGAY-HupA-mCherry strain) at a single moment in time also were performed. For cells with DAPI-stained nucleoids, images were taken 1 h after aggregate in-duction. For cells with HupA-mCherry-tagged nucleoids, images were taken 30 min after aggregate induction.
We also performed time-lapse measurements of IbpA aggregates and HupA-mCherry-tagged nucleoids in individual cells (MGAY-HupA-mCherry strain). For this, streptomycin-induced cells were placed on a microscope slide between a coverslip and appropriate media on an aga-rose gel pad containing streptomycin (10g ml⫺1). When antibiotics
were applied, the agarose gel pad also was supplied with appropriate an-tibiotics along with streptomycin. During image acquisition, the slide was kept in a temperature-controlled chamber (FCS2; Bioptechs) at 37°C. Image acquisition began once the slide reached the appropriate tempera-ture (which takes 3 to 5 min).
Images of cells were captured every 1 min for 1 h. Phase-contrast images were captured every 5 min for cell segmentation. The software for image acquisition was NIS Elements (Nikon). Cells were visualized using a Nikon Eclipse (Ti-E) inverted microscope with a 100⫻ (1.49-numeric-aperture) objective. Phase-contrast images were acquired using a charge-coupled display camera (DS-Fi2; Nikon). Confocal microscopy was used to detect IbpA-YFP aggregates (488-nm laser; Melles-Griot HQ514/30; Nikon) and HupA-mCherry-tagged nucleoids (543-nm HeNe laser; Melles-Griot HQ585/65; Nikon). Epifluorescence microscopy with a mercury lamp was used to detect DAPI-stained nucleoids (DAPI filter block; Nikon).
Image analysis.Analysis of the time-lapse microscopy images was performed as described in reference21, using a semiautomated method (40) augmented with an automatic presegmentation step of cell borders in the phase-contrast images using the software MAMLE (41). We
per-formed manual correction of these results when needed, using the soft-ware CellAging (40), to obtain precise masks of the region each cell occu-pies at each time point and precise detection of division events. The masks next were manually aligned to the corresponding confocal images based on the information from the red channel (see Fig. S2 in the supplemental material). For additional details along with information on how the data extraction from the images was performed, please see the supplemental material.
Tests of statistical significance.Distributions of results from sets of individual cells were compared by tests of statistical significance, such as the Kolmogorov-Smirnov test. All conclusions of differences between conditions are based on these tests.
RESULTS
Functionality of the process of polar retention of protein aggre-gates under different conditions.To study the spatiotemporal distribution of protein aggregates, we performed multimodal, time-lapse microscopy of live MGAY-HupA-mCherry cells ex-pressing a YFP-tagged chaperone (IbpA), which identifiesin vivo
the location of protein aggregates, and HupA-mCherry, a fluores-cent variant of a nucleoid-associated protein, to detect the loca-tion and dimensions of the nucleoid(s) (see Fig. S7 to S9 in the supplemental material). We also observed cell borders by phase-contrast microscopy. In all cases, cells first were grown overnight in the appropriate medium (LB, M63, or TB). The next day, their precultures were grown in the appropriate media and then were incubated with streptomycin (10g ml⫺1) for 30 min to induce
aggregate production. If appropriate, they then were subjected to chloramphenicol or rifampin for 30 additional minutes. Finally, cells were placed under the microscope and imaged once while being kept under the appropriate conditions (Materials and Methods). Overall, we imaged cells under 9 conditions (see Table S1 in the supplemental material), differing in medium (M63, LB, or TB) and/or antibiotic stress (chloramphenicol, rifampin, or no antibiotic), for the reasons described in the Introduction. The condition LB with no antibiotics is considered the control.
From the images, after selecting cells with 1 nucleoid only (see Materials and Methods), we extracted from each cell, at each time point, the center position and the size of the nucleoid as well as the position of each aggregate along the major and minor cell axes, regardless of its location in the cell (see Table S1 in the supplemen-tal material). We next folded the two halves of a cell on top of each other and then normalized the size, with 0 being the cell center and⫹1 the pole extremities. From there, we obtained distributions of the relative nucleoid size along the major axis and of the relative positioning of aggregates (see Fig. S3 and S4). These are in agreement with the absolute measures of size and positioning of nucleoids and aggregates, respectively, shown in Table S1 in the supplemental material.
In Tables S2 and S3 in the supplemental material, we show the results of Kolmogorov-Smirnov (KS) tests of comparison between pairs of conditions of the distribution of relative nucleoid sizes along the major cell axis and of the distribution of aggregate loca-tion along the major cell axis, respectively. In these, as well as in subsequent tests, we consider that forPvalues smaller than 0.05, the null hypothesis that the two sets of data are from the same distribution can be rejected. In this case, we only compared con-ditions that differ in one variable from the control. From theP
values shown in Table S2, we conclude that the relative nucleoid size differs significantly between all pairs of conditions differing in medium richness or in antibiotic stress.
on May 8, 2018 by B-ON FCCN TRIAL
http://jb.asm.org/
As shown inFig. 1A, we find that the changes in nucleoid rel-ative size along the minor and major axes with changing condi-tions are heavily positively correlated (Pearson correlation of 0.9 with aPvalue smaller than 10⫺3
in attest with the null hypothesis that the data are uncorrelated), indicating that the increase in size in one direction is not made at the cost of size reduction in the other direction (i.e., changes in nucleoid size appear to be due to similar radial and axial changes). Regarding the measurements of relative nucleoid size along the major cell axis, qualitatively similar results (see Table S4 in the supplemental material) were attained when assessing the nucleoid size by DAPI staining (usually, the nucleoid appeared to be approximately 10% to 15% larger when measured by HupA-mCherry tagging than when measured by DAPI staining). Furthermore, the mean relative nucleoid size of cells grown in LB medium without streptomycin was found to be similar to the control condition with streptomycin (LB, no anti-biotic), which implies that streptomycin, on its own, does not affect the relative nucleoid size significantly (see Table S4).
Meanwhile, from Fig. S3 and Table S3 in the supplemental material, we conclude that the distribution of aggregates along the major cell axis also differs significantly between any pair of condi-tions differing in medium richness or antibiotic stress. Further, one invariably observes that under the conditions where the mean relative nucleoid size is larger, the aggregates preferentially locate closer to the pole, in agreement with the existence of (at least partial) volume exclusion under all conditions. This is confirmed by the results depicted inFig. 1B, showing the correlation between aggregate positioning (i.e., distance from cell center) and nucleoid size.
Finally, it is noted that changing both medium richness and antibiotic stress causes combined effects on nucleoids that are at least as strong as the strongest individual change and that the mean positioning of the aggregates changes accordingly, in agree-ment with the existence of nucleoid occlusion and consequent midcell exclusion.
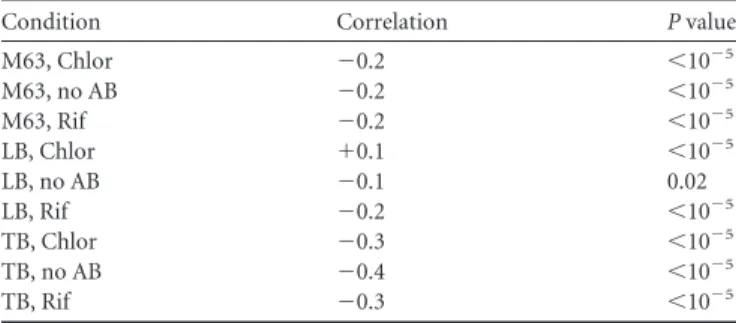
Robustness of the process of retention of protein aggregates under different conditions.To assess if the changes in nucleoid size affect the efficiency with which aggregates are excluded from midcell, we obtained for each condition the correlation between the positions of aggregates and nucleoids in individual cells during their lifetimes. Results are shown inTable 1. Also shown is theP
value of statistical significance of the correlation from attest with the null hypothesis that the data are uncorrelated.
FromTable 1, the positioning of aggregates and nucleoid cen-ters along the major cell axis is negatively correlated under most conditions (except in cells in LB medium with chloramphenicol, which, on average, have the smallest relative nucleoid of all). Also, in general, the correlation strength increases with nucleoid size. This negative correlation (statistically significant under all condi-tions) is a result of the fact that in most cells where the nucleoid is off-centered, i.e., biasedly positioned toward one side, the aggre-gates preferentially locate on the opposite side (as expected from volume exclusion).
Meanwhile, under the conditions where the relative nucleoid size is smallest, the correlation becomes positive (while remaining statistically significant). This suggests that asymmetric position-ing by such nucleoids, due to their reduced size, no longer causes tangible asymmetries in the positioning of aggregates by the two poles. The statistically significant positive correlation likely is also a result of volume exclusion caused by the nucleoid at midcell. While the nucleoid is not large enough in these cells to define to which side the aggregates preferentially locate, it is still able, when it moves along the major cell axis, to cause aggregates to move accordingly in a positively correlated fashion. Interestingly, such positive correlations between nucleoid and aggregate motions are easily detected in cells under all conditions, provided that we fold the major cell axis so as to remove the influence of asymmetries in nucleoid positioning (see Table S5 in the supplemental material).
FIG 1(A) Scatter plot between the relative major axis length and minor axis length of nucleoids under different conditions. (B) Scatter plot between the relative major axis length of nucleoid and the relative position of aggregates along the cell major axis under different conditions. In both panels, the values of the coefficient of determination (R2) of the fit also are shown.
TABLE 1Correlation between relative positions along the major cell axis of the nucleoid center and of individual aggregatesa
Condition Correlation Pvalue
M63, Chlor ⫺0.2 ⬍10⫺5
M63, no AB ⫺0.2 ⬍10⫺5
M63, Rif ⫺0.2 ⬍10⫺5
LB, Chlor ⫹0.1 ⬍10⫺5
LB, no AB ⫺0.1 0.02
LB, Rif ⫺0.2 ⬍10⫺5
TB, Chlor ⫺0.3 ⬍10⫺5
TB, no AB ⫺0.4 ⬍10⫺5
TB, Rif ⫺0.3 ⬍10⫺5
aFor each condition, the correlation between the relative positions in individual cells of
the nucleoid center and of the aggregates along the major cell axis is shown. Also shown are thePvalues of statistical significance of the correlation from attest with the null hypothesis that the data are uncorrelated. Chlor, chloramphenicol; Rif, rifampin; no AB, no antibiotic.
on May 8, 2018 by B-ON FCCN TRIAL
http://jb.asm.org/
Effects in the process of partitioning of aggregates in cell di-vision.From previous works (1,5,21,42) it is expected that, in cells with more than one aggregate, the preference for polar local-ization of the aggregates will generate asymmetries in aggregate numbers between sister cells of future generations. Meanwhile, the presence of aggregates between nucleoids during cell division will result in decreased asymmetries in aggregate numbers be-tween sister cells (35,36).
Thus, we assessed whether, in the moment prior to cell divi-sion, the numbers of aggregates located between the two nucleoid centers differ significantly between conditions. For that, we ob-tained the fraction of aggregates located between nucleoid centers in cells the moment before division was detected and assessed if, between conditions, the differences in the fraction of aggregates between nucleoid centers are significant by performing a binomial test with the null hypothesis that the two sets of data are generated from an equal distribution. Further, we calculated the fraction of aggregates that would be expected to be in the region between nucleoids if the aggregates distributed uniformly along the major cell axis, accounting for the relative size of this region. Results are shown inTable 2.
FromTable 2and from Table S6 in the supplemental material, regarding the fraction of aggregates between nucleoids in cells the moment prior to cell division, all conditions differ significantly from the control (LB with no antibiotics), although not always between them. In TB medium this fraction is smaller, while the relative nucleoid size along the major cell axis is larger (in agree-ment with the results reported in reference33). Meanwhile, in
M63 medium this fraction is larger, while the relative nucleoid size also is larger. Further, the presence of chloramphenicol or rifam-pin also decreases this fraction, but while chloramphenicol de-creases the relative nucleoid size, rifampin inde-creases it.
Given these results, we conclude that both increasing and de-creasing the relative size of the nucleoid (compared to that of the control) leads to an increase in the fraction of aggregates in the region between nucleoids the moment prior to cell division. Nev-ertheless, it is worth noting that under no condition is the reten-tion of aggregates at the poles absent, given that the fracreten-tion of aggregates found between nucleoids is always much smaller than that expected by chance. While the observation that smaller nucle-oids lead to a decrease in the ability to segregate to and then retain aggregates at the poles might have been expected, it can be argued that the weaker retention of aggregates at the poles in cells with the largest nucleoids was less expected. In the next section, we inves-tigate this further by grouping individual cells according to their relative nucleoid size rather than the experimental conditions and studying the dynamics of individual aggregates in each group of cells.
Dynamics of the aggregates as a function of nucleoid size.
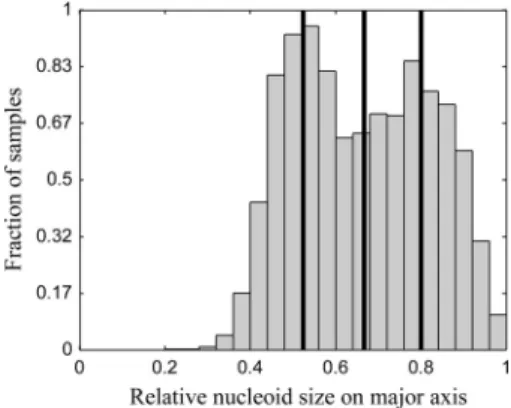
From the results described above, it is apparent that there is a wide cell-to-cell variability in some of the properties studied, even be-tween cells under the same conditions. Thus, in order to study how the changes in nucleoid size affect the dynamics of aggregates, we gathered data from all conditions and partitioned the cells into quartiles based on their relative nucleoid sizes (Fig. 2).Table 3 shows the fraction of cells from each condition that belongs to each quartile. Not surprisingly, cells under different conditions contribute differently, in numbers, to the various quartiles. Nev-ertheless, under all conditions there are at least a few cells in each of the quartiles.
We next compared the spatial distributions and dynamics of
TABLE 2Fraction of aggregates located between the centers of the nucleoids in cells with two nucleoids the moment prior to divisiona
Condition
No. of aggregates
Fraction of aggregates between nucleoids (10⫺1)
Expected fraction if uniformly distributed
Distance between nucleoid
centers along major axis Pvalue
LB, Chlor 5,027 2.8 0.5 1.0⫾0.1 ⬍10⫺3
LB, no AB 3,492 3.2 0.5 1.0⫾0.1
LB, Rif 604 2.7 0.5 1.0⫾0.1 ⬍10⫺2
TB, no AB 1,434 2.7 0.5 1.1⫾0.1 ⬍10⫺3
M63, no AB 1,527 3.6 0.5 1.1⫾0.1 ⬍10⫺2
aShown are the total number of aggregates, the mean fraction of aggregates between the centers of the two nucleoids in each cell, the expected fraction if the aggregates were
distributed uniformly along the major cell axis, and the distances (means and standard deviations) along the major cell axis between the nucleoid centers (normalized by half the cell length). Also shown are thePvalues for the fractions of aggregates between nucleoids in cells in LB medium and no antibiotic and cells under other conditions from the same binomial distribution. Cell size along the major axis is normalized to equal 2. Finally, we performed statistical tests of comparison to determine whether the distributions of aggregate numbers found between the centers of the nucleoids differ between conditions. Results are shown in Table S6 in the supplemental material.
FIG 2Distribution of relative nucleoid sizes. The distribution of relative nu-cleoid sizes obtained from cells under all conditions described inTable 1are shown. The black lines separate the quartiles of relative nucleoid size.
TABLE 3Fraction of cells in each quartile of nucleoid sizea
Condition
Fraction of cells in indicated quartile
1st 2nd 3rd 4th
LB, Chlor 0.6 0.4 0.0 2.7⫻10⫺4
LB, no AB 0.1 0.3 0.3 0.2
LB, Rif 3⫻10⫺3 0.1 0.3 0.6
TB, no AB 0.0 0.1 0.3 0.5
M63, no AB 5⫻10⫺3 0.1 0.2 0.7
aFraction of cells from each condition whose relative nucleoid size belongs to each of
the quartiles in the distribution shown in Fig. 2.
on May 8, 2018 by B-ON FCCN TRIAL
http://jb.asm.org/
aggregates of cells in different quartiles of nucleoid size. First, we investigated whether the location of the nucleoid borders along the major cell axis is related to the position along the same axis of the local maxima of positive anisotropy in the motion of the ag-gregates, which is responsible for their accumulation at the poles (21). Anisotropy curves extracted from the motion of aggregates in cells of each quartile are shown in Fig. S5 in the supplemental material. From these, we extracted the location on the major cell axis where the maximum peak of positive anisotropy occurs (Ta-ble 4). Also inTable 4are the number of aggregates analyzed per quartile, fraction of aggregates at the poles, and means and stan-dard deviations of the relative nucleoid sizes along the major and minor axes.
First, as shown inTable 4, the fraction of aggregates in the poles differs between quartiles. This was expected given, among other things, the definition of pole and the differences in relative pole size. More importantly, the location of the peak of positive anisot-ropy (see Fig. S5 in the supplemental material) follows the same trend as that of the relative position of the nucleoid borders. Namely, as the latter become relatively closer to the cell extremi-ties, so do the positive peaks of anisotropy.
Nevertheless, it is worth noting that while for cells of the 2nd quartile the peak of anisotropy is closer to the cell extremity than the nucleoid border, for cells of the 3rd quartile the peak of an-isotropy and the nucleoid border match in position, and for cells of the 4th quartile the peak of anisotropy is closer to the cell center than to the nucleoid border. We hypothesize that this reflects the increasing space constraints, which in cells of the 4th quartile may
force aggregates to move more often into the midcell region while not necessarily entering the nucleoidper se.
Also, interestingly, we were unable to find a clear anisotropy peak in cells of the 1st quartile. We hypothesize that the relatively smaller nucleoid of these cells causes the retention of aggregates at the poles by nucleoid exclusion to be weaker. Further, the fraction of events between consecutive microscopy frames that correspond to encounters between an aggregate and the nucleoid become rarer (due to reduced relative nucleoid size). This is in agreement with the above-described observation that, under conditions where cells have relatively smaller nucleoids, the aggregates more likely locate between nucleoids prior to division.
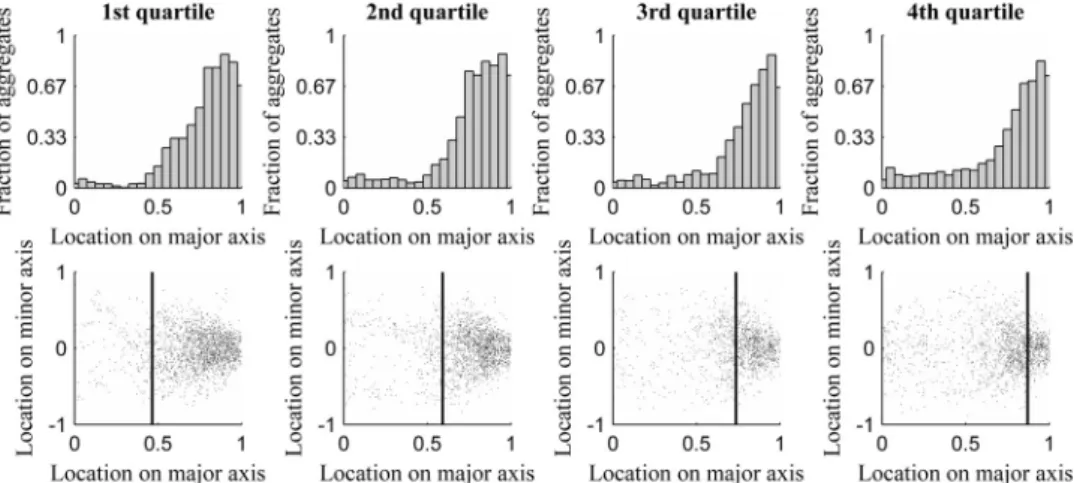
We next studied the extent to which the retention of aggregates at the poles differs between cells of different quartiles. InFig. 3, we show the distribution of locations of aggregates along the major cell axis (from all time points) in cells of each quartile (top row). Also shown (bottom row) is their location along the major and minor cell axes along with the mean position of the nucleoid bor-der (vertical line).
Finally, in Table S7 in the supplemental material, we present the results of KS tests of comparison between the distributions of aggregate positioning along the major cell axis from cells of differ-ent quartiles. The results show that all pairs of distributions differ in a statistical sense.
Figure 3(bottom) suggests that in cells with the smallest nucle-oids (1st quartile), there is little interaction between aggregates and nucleoids, as aggregates rarely locate close to the nucleoid borders or at midcell. Meanwhile, in the cells with the largest
TABLE 4Aggregate positioning and dynamics along the major cell axis in cells having different quartiles of nucleoid sizea
Quartile No. of aggregates Fraction of aggregates in poles
Relative nucleoid size along:
Peak location along major axis of anisotropy curve (10⫺1)
Major axis Minor axis
1st 2,404 0.9 0.5⫾0.0 0.6⫾0.1 (⬃0.03)
2nd 2,681 0.9 0.6⫾0.0 0.7⫾0.1 7.1
3rd 2,104 0.7 0.7⫾0.0 0.8⫾0.1 7.4
4th 2,147 0.4 0.9⫾0.0 0.9⫾0.1 7.7
aThe table shows the number of aggregates analyzed in cells of each quartile, the fraction of aggregates at the poles, the relative nucleoid size (means and standard deviations) along
the major and minor axes, and the location of the positive maximum peak of anisotropy along the major cell axis. The total number of cells observed was 2,138.
FIG 3(Top) Distribution of aggregate location along the major cell axis as a function of nucleoid size. (Bottom) Scatter plots of aggregate locations along the major and minor cell axes. (Top) Number of aggregates in each position along the major cell axis for each quartile of relative nucleoid size. (Bottom) Positions occupied by aggregates along the major and minor axes, along with the mean relative position of the nucleoid border for each quartile of relative nucleoid size.
on May 8, 2018 by B-ON FCCN TRIAL
http://jb.asm.org/
nucleoids (4th quartile), the aggregates often are found at midcell. This is in agreement with the observation in the previous section of a decrease in retention of aggregates outside the midcell region in cells with larger nucleoids. It is also in agreement with the rela-tionship between the positioning along the major cell axis of the nucleoid size and the peak of positive anisotropy as a function of nucleoid size. Given this, we conclude that the segregation and retention of (visually detectable) aggregates at the poles is most pronounced in cells with mid-sized nucleoids.
Degree of nucleoid exclusion as a function of aggregate size.
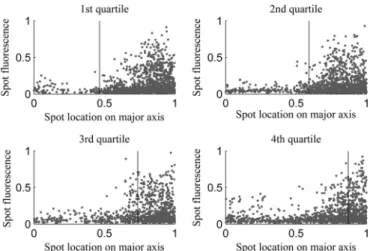
The conclusions described above were obtained from the analysis of the behavior of detectable aggregates as a function of nucleoid size. However, the degree of aggregate exclusion from midcell also may differ significantly as a function of aggregate size within the range of visibility. Thus, we investigated the location of aggregates along the major cell axis as a function of their size (as measured by their fluorescence intensity) for cells from each quartile of nucle-oid size (Fig. 4).
FromFig. 4, we extracted for each set of cells the 10% and 25% smallest aggregates (as measured by their fluorescence intensity) and their location along the major cell axis. We obtained the frac-tion of these that is excluded from midcell. Results are shown in Table 5. Also shown is the fraction of aggregates that would be expected to be excluded from midcell if the aggregates distributed uniformly along the major cell axis and accounting for the relative size of the midcell region.
FromTable 5, the spatial distributions of aggregates along the major cell axis do not differ significantly with aggregate size for
any of the quartiles of relative nucleoid size. As such, we conclude that, for the range of aggregate sizes that we can detect, there is no significant difference in their degree of exclusion from midcell.
DISCUSSION
Based on previous studies that identified nucleoid exclusion as the mechanism responsible for the segregation and subsequent reten-tion of protein aggregates at the cell poles inE. coli(21), and given the knowledge that the relative size of nucleoids is sensitive to environmental conditions, we observed cells where both the nu-cleoid and protein aggregates are made visible by fluorescent tag-ging to study how robust, under different medium and stress con-ditions, is the process of the accumulation of aggregates at the poles due to nucleoid occlusion.
We found it to be highly robust under changing conditions, although it was not entirely immune. In particular, while the dis-tribution of aggregates differed widely between conditions, in agreement with the wide changes in relative nucleoid size, under no conditions, even when combining changes in medium richness with antibiotic stresses (which caused, in several cases, combined effects on the relative nucleoid size), was the retention of aggre-gates at the poles completely hampered (although partial loss of retention strength was observed).
The exclusion of aggregates from the space between the repli-cated nucleoids in cells close to division is what causes the aggre-gates to be asymmetrically distributed in the daughter cells (i.e., most will be at the old pole) (5). We observed that for distinct reasons, both increasing as well as decreasing the relative nucleoid size reduced the degree of exclusion of aggregates from midcell, which is likely to affect the degree of asymmetries in the partition-ing of aggregates between cells of future generations and, thus, the aging process of lineages under stress conditions, where cells tend to contain more than one aggregate. Reduced nucleoid size obvi-ously hampers the retention of aggregates at the poles both prior to and after nucleoid partitioning. Meanwhile, increased nucleoid size, perhaps due to increasing the space constraints at the poles, seems to cause aggregates to locate in the relatively enlarged mid-cell region more often, again both prior to and after nucleoid partitioning. Future studies may reveal whether the aggregates enter the midcell region by penetrating an enlarged and perhaps less dense nucleoid or by moving into the regions between the inner cell walls and the nucleoid borders. The use of synthetic aggregates of known, regulated sizes (21) may help answer this question.
It is worth mentioning a previous work which showed that, in
E. coli cells under suboptimal conditions, the morphological asymmetries in cell division are larger (37) because the mean dis-tance between the nucleoids of cells close to division is wider. Such higher asymmetry was shown to have negative functional
conse-FIG 4Individual aggregate intensity versus location along the major cell axes for cells of each quartile. Shown are all positions occupied by aggregates during a cell’s lifetime along with the mean relative position of the nucleoid border in cells of each of the quartiles along the major axis (vertical line).
TABLE 5Aggregate positioning along the major cell axis in cells of different quartiles of nucleoid sizea
Quartile
Relative nucleoid size along major axis
Fraction of aggregates at poles
Fraction of 25% smallest aggregates at poles
Fraction of 10% smallest aggregates at poles
Expected fraction at poles if uniformly distributed
1st 0.5 0.9 0.9 0.9 0.5
2nd 0.6 0.9 0.9 0.9 0.4
3rd 0.7 0.7 0.7 0.7 0.3
4th 0.9 0.4 0.4 0.4 0.1
aShown are the relative nucleoid size along the major cell axis, the mean fraction of aggregates excluded from midcell (i.e., at the poles), the mean fraction of the 25% and of the
10% smallest aggregates excluded from midcell, and the expected fraction if the aggregates were distributed uniformly along the major cell axis.
on May 8, 2018 by B-ON FCCN TRIAL
http://jb.asm.org/
quences, namely, slower mean division times (37). It is interesting to hypothesize that the preferential absence of aggregates from the midcell region also contributes to the symmetry in division by maintaining the space between the nucleoids, where the division septum is to form, free from obstructing objects. Future research should be able to address this issue.
Also of interest, we expect that the fraction of time that a cell has two nucleoids will affect the fraction of aggregates that are at midcell the moment division occurs. This fraction of time is highly dependent on environmental conditions, and one could argue that it at least partially explains the observed differences in the fraction of aggregates at midcell prior to division between the conditions. However, given the lack of evidence that the rate of aggregate formation changes during the cell cycle, and since this preferential appearance at midcell in the presence of two nucle-oids is possible only if there is a nucleoid exclusion mechanism (or else the aggregates would distribute homogenously), it is reason-able to assume that the nucleoid size is, at least partially, also affecting the fraction of aggregates at midcell prior to division. This assumption is further supported by the existence of the clear positive peaks in the anisotropy curves (precisely at the borders of the nucleoids) that show that aggregates move significantly be-tween frames and are excluded from midcell precisely where the nucleoid borders are located. Given this, we argue that the differ-ences between the fractions of aggregates at midcell prior to cell division between the conditions tested are created by both the differences in the ability of the nucleoids (of different relative sizes) to retain the aggregates at midcell and poles and the differ-ences in the mean fraction of time that cells have two nucleoids under the various conditions.
Finally, we also investigated the degree to which the effects of nucleoid exclusion are aggregate size dependent. For the range of aggregate sizes detectable from the images, we were unable to find tangible differences between the spatial distributions of small- and normal-sized aggregates regardless of the nucleoid size. Neverthe-less, we expect that below a certain aggregate size (beyond our detection range), nucleoid exclusion will lose much of its effec-tiveness, particularly given recent evidence that while ribosomes are excluded from the nucleoid, ribosomal subunits are not (43). In this regard, recent studies provided evidence that the aggrega-tion of nonfuncaggrega-tional proteins is an active process (14). Besides benefits such as reducing the possibility of harmful interactions between nonfunctional proteins and other cellular components, active aggregation should guarantee efficient, energy-free nucle-oid occlusion by contributing aggregates to reach sufficient sizes so as to be excluded from the midcell region.
In conclusion, our results suggest that within the set of condi-tions studied, while being a robust process under changing con-ditions, the exclusion from midcell of aggregates (large enough to be detected by the methods employed here) is, on average, more efficient in cells with mid-sized nucleoids, which are the most common ones under optimal growth conditions. This optimality of mid-sized nucleoids undoubtedly is aggregate size dependent, but it should be tangibly perturbed only if there are major failures in the active aggregation process.
ACKNOWLEDGMENTS
The work was supported by the Academy of Finland (257603; A.S.R.), the Portuguese Foundation for Science and Technology (PTDC/BBB-MET/
1084/2012; J.M.F. and A.S.R.), and the Finnish Cultural Foundation (A.G.).
The funders had no role in study design, data collection and analysis, decision to publish, or preparation of the manuscript.
FUNDING INFORMATION
Portuguese Foundation for Science and Technology provided funding to Jose Fonseca under grant number PTDC/BBB-MET/1084/2012. Acad-emy of Finland | Biotieteiden ja Ympäristön Tutkimuksen Toimikunta (Forskningsrådet för Biovetenskap och Miljö) provided funding to Andre S. Ribeiro under grant number 257603.
REFERENCES
1.Stewart EJ, Madden R, Paul G, Taddei F.2005. Aging and death in an organism that reproduces by morphologically symmetric division. PLoS Biol3:e45.http://dx.doi.org/10.1371/journal.pbio.0030045.
2.Maisonneuve E, Ezraty B, Dukan S.2008. Protein aggregates: an aging factor involved in cell death. J Bacteriol190:6070 – 6075.http://dx.doi.org /10.1128/JB.00736-08.
3.Nyström T, Liu B. 2014. The mystery of aging and rejuvenation—a budding topic. Curr Opin Microbiol18:61– 67.http://dx.doi.org/10.1016 /j.mib.2014.02.003.
4.Soti C, Csermely P.2003. Aging and molecular chaperones. Exp Gerontol 38:1037–1040.http://dx.doi.org/10.1016/S0531-5565(03)00185-2. 5.Lindner AB, Madden R, Demarez A, Stewart EJ, Taddei F. 2008.
Asymmetric segregation of protein aggregates is associated with cellular aging and rejuvenation. Proc Natl Acad Sci U S A105:3076 –3081.http: //dx.doi.org/10.1073/pnas.0708931105.
6.Deuerling E, Schulze-Specking A, Tomoyasu T, Mogk A, Bukau B. 1999. Trigger factor and DnaK cooperate in folding of newly synthesized proteins. Nature400:693– 696.http://dx.doi.org/10.1038/23301. 7.Wickner S, Maurizi M, Gottesman S. 1999. Posttranslational quality
control: folding, refolding, and degrading proteins. Science286:1888 – 1893.http://dx.doi.org/10.1126/science.286.5446.1888.
8.Mandelstam J.1960. The intracellular turnover of protein and nucleic acids and its role in biochemical differentiation. Bacteriol Rev24:289 – 308.
9.Goldberg AL.2003. Protein degradation and protection against misfolded or damaged proteins. Nature 426:895– 899. http://dx.doi.org/10.1038 /nature02263.
10. Goldberg AL.1972. Degradation of abnormal proteins in Escherichia coli. Proc Natl Acad Sci U S A69:422– 426.http://dx.doi.org/10.1073/pnas.69 .2.422.
11. Willetts N.1967. Intracellular protein breakdown in non-growing cells of Escherichia coli. Biochem J 453– 461.
12. Tyedmers J, Mogk A, Bukau B.2010. Cellular strategies for controlling protein aggregation. Nat Rev Mol Cell Biol11:777–788.http://dx.doi.org /10.1038/nrm2993.
13. Sabate R, de Groot NS, Ventura S.2010. Protein folding and aggregation in bacteria. Cell Mol Life Sci 67:2695–2715.http://dx.doi.org/10.1007 /s00018-010-0344-4.
14. Govers SK, Dutré P, Aertsen A.2014. In vivo disassembly and reassembly of protein aggregates in Escherichia coli. J Bacteriol196:2325–2332.http: //dx.doi.org/10.1128/JB.01549-14.
15. Dobson CM.2001. The structural basis of protein folding and its links with human disease. Philos Trans R Soc Lond B Biol Sci356:133–145. http://dx.doi.org/10.1098/rstb.2000.0758.
16. Winkler J, Seybert A, König L, Pruggnaller S, Haselmann U, Sourjik V, Weiss M, Frangakis AS, Mogk A, Bukau B. 2010. Quantitative and spatio-temporal features of protein aggregation in Escherichia coli and consequences on protein quality control and cellular ageing. EMBO J29: 910 –923.http://dx.doi.org/10.1038/emboj.2009.412.
17. Coquel A-S, Jacob J-P, Primet M, Demarez A, Dimiccoli M, Julou T, Moisan L, Lindner AB, Berry H.2013. Localization of protein aggrega-tion in Escherichia coli is governed by diffusion and nucleoid macromo-lecular crowding effect. PLoS Comput Biol9:e1003038.http://dx.doi.org /10.1371/journal.pcbi.1003038.
18. Reyes-Lamothe R, Tran T, Meas D, Lee L, Li AM, Sherratt DJ, Tol-masky ME.2014. High-copy bacterial plasmids diffuse in the nucleoid-free space, replicate stochastically and are randomly partitioned at cell division. Nucleic Acids Res42:1042–1051.http://dx.doi.org/10.1093/nar /gkt918.
on May 8, 2018 by B-ON FCCN TRIAL
http://jb.asm.org/
19. Vecchiarelli AG, Mizuuchi K, Funnell BE.2012. Surfing biological sur-faces: exploiting the nucleoid for partition and transport in bacteria. Mol Microbiol86:513–523.http://dx.doi.org/10.1111/mmi.12017.
20. Straight PD, Fischbach MA, Walsh CT, Rudner DZ, Kolter R.2007. A singular enzymatic megacomplex from Bacillus subtilis. Proc Natl Acad Sci U S A104:305–310.http://dx.doi.org/10.1073/pnas.0609073103. 21. Gupta A, Lloyd-Price J, Neeli-Venkata R, Oliveira SMD, Ribeiro AS.
2014. In vivo kinetics of segregation and polar retention of MS2-GFP-RNA complexes in Escherichia coli. Biophys J106:1928 –1937.http://dx .doi.org/10.1016/j.bpj.2014.03.035.
22. Fisher JK, Bourniquel A, Witz G, Weiner B, Prentiss M, Kleckner N. 2013. Four-dimensional imaging of E. coli nucleoid organization and dy-namics in living cells. Cell153:882– 895.http://dx.doi.org/10.1016/j.cell .2013.04.006.
23. Dillon SC, Dorman CJ. 2010. Bacterial nucleoid-associated proteins, nucleoid structure and gene expression. Nat Rev Microbiol8:185–195. http://dx.doi.org/10.1038/nrmicro2261.
24. Cabrera JE, Cagliero C, Quan S, Squires CL, Jin DJ. 2009. Active transcription of rRNA operons condenses the nucleoid in Escherichia coli: examining the effect of transcription on nucleoid structure in the absence of transertion. J Bacteriol191:4180 – 4185.http://dx.doi.org/10.1128/JB .01707-08.
25. Van Helvoort JM, Kool J, Woldringh CL.1996. Chloramphenicol causes fusion of separated nucleoids in Escherichia coli K-12 cells and filaments. J Bacteriol178:4289 – 4293.
26. Chai Q, Singh B, Peisker K, Metzendorf N, Ge X, Dasgupta S, Sanyal S. 2014. Organization of ribosomes and nucleoids in Escherichia coli cells during growth and in quiescence. J Biol Chem289:11342–11352.http://dx .doi.org/10.1074/jbc.M114.557348.
27. Sun Q, Margolin W.2004. Effects of perturbing nucleoid structure on nucleoid occlusion-mediated toporegulation of FtsZ ring assembly. J Bacteriol 186:3951–3959. http://dx.doi.org/10.1128/JB.186.12.3951 -3959.2004.
28. Weber MJ, DeMoss JA.1966. The inhibition by chloramphenicol of nascent protein formation. Proc Natl Acad Sci U S A407:1224 –1230. 29. McClure WR, Cech CL.1978. On the mechanism of rifampicin
inhibi-tion of RNA synthesis. J Biol Chem253:8949 – 8956.
30. Tao H, Bausch C, Richmond C.1999. Functional genomics: expression analysis of Escherichia coli growing on minimal and rich media. J Bacteriol 181:6425– 6440.
31. Cabrera JE, Jin DJ.2003. The distribution of RNA polymerase in Esche-richia coli is dynamic and sensitive to environmental cues. Mol Microbiol 50:1493–1505.http://dx.doi.org/10.1046/j.1365-2958.2003.03805.x.
32. Hadizadeh Yazdi N, Guet CC, Johnson RC, Marko JF.2012. Variation of the folding and dynamics of the Escherichia coli chromosome with growth conditions. Mol Microbiol86:1318 –1333.http://dx.doi.org/10 .1111/mmi.12071.
33. Jin DJ, Cagliero C, Zhou YN.2013. Role of RNA polymerase and tran-scription in the organization of the bacterial nucleoid. Chem Rev113: 8662– 8682.http://dx.doi.org/10.1021/cr4001429.
34. Carrio MM, Corchero JL, Villaverde A. 1998. Dynamics of in vivo protein aggregation: building inclusion bodies in recombinant bacteria. FEMS Microbiol Lett169:9 –15.
35. Huh D, Paulsson J.2011. Random partitioning of molecules at cell divi-sion. Proc Natl Acad Sci U S A108:15004 –15009.http://dx.doi.org/10 .1073/pnas.1013171108.
36. Gupta A, Lloyd-Price J, Ribeiro AS.2015. In silico analysis of division times of Escherichia coli populations as a function of the partitioning scheme of non-functional proteins. In Silico Biol12:9 –21.http://dx.doi .org/10.3233/ISB-140462.
37. Gupta A, Lloyd-Price J, Oliveira SMD, Yli-Harja O, Muthukrishnan AB, Ribeiro AS.2014. Robustness of the division symmetry in Escherichia coli and functional consequences of symmetry breaking. Phys Biol11: 066005.http://dx.doi.org/10.1088/1478-3975/11/6/066005.
38. Chazotte B.2011. Labeling nuclear DNA using DAPI. Cold Spring Harb Protoc1:80 – 82.
39. Bakshi S, Choi H, Rangarajan N, Barns KJ, Bratton BP, Weisshaar JC. 2014. Nonperturbative imaging of nucleoid morphology in live bacterial cells during an antimicrobial peptide attack. Appl Environ Microbiol80: 4977– 4986.http://dx.doi.org/10.1128/AEM.00989-14.
40. Hakkinen A, Muthukrishnan AB, Mora A, Fonseca JM, Ribeiro AS. 2013. CellAging: a tool to study segregation and partitioning in division in cell lineages of Escherichia coli. Bioinformatics29:1708 –1709.http://dx .doi.org/10.1093/bioinformatics/btt194.
41. Chowdhury S, Kandhavelu M, Yli-Harja O, Ribeiro AS. 2013. Cell segmentation by multi-resolution analysis and maximum likelihood esti-mation (MAMLE). BMC Bioinformatics14(Suppl 1):S8.
42. Lloyd-Price J, Häkkinen A. 2012. Asymmetric disposal of individual protein aggregates in Escherichia coli, one aggregate at a time. J Bacteriol 194:1747–1752.http://dx.doi.org/10.1128/JB.06500-11.
43. Sanamrad A, Persson F, Lundius EG, Fange D, Gynnå AH, Elf J.2014. Single-particle tracking reveals that free ribosomal subunits are not ex-cluded from the Escherichia coli nucleoid. Proc Natl Acad Sci U S A111: 11413–11418.http://dx.doi.org/10.1073/pnas.1411558111.