Feature-Family-Based Reliability Analysis of
Software Product Lines
André Luiz Peron Martins Lanna
Tese apresentada como requisito parcial para conclusão do Doutorado em Informática
Orientador
Prof. Dr. Vander Ramos Alves
Coorientadora
Prof.a Dr.a Genaina Nunes Rodrigues
Ficha catalográfica elaborada automaticamente, com os dados fornecidos pelo(a) autor(a)
PSO681f
Peron Martins Lanna, Andre Luiz
Feature-Family-Based Reliability Analysis of Software Product Lines / Andre Luiz Peron Martins Lanna; orientador Vander Ramos Alves; co-orientador Genaina Nunes Rodrigues. - Brasília, 2017.
110 p.
Tese (Doutorado - Doutorado em Informática) --Universidade de Brasília, 2017.
Feature-Family-Based Reliability Analysis of
Software Product Lines
André Luiz Peron Martins Lanna
Tese apresentada como requisito parcial para conclusão do Doutorado em Informática
Prof. Dr. Vander Ramos Alves (Orientador) CIC/UnB
Prof. Dr. Vander Ramos Alves Prof. Dr. Rodrigo Bonifácio
CIC/UnB CIC/UnB
Prof. Dr. Alexandre Cabral Mota Prof. Dr. Cecilia Mary Fischer Rubira
CIN/UFPE Unicamp
Prof. Dr. Bruno Luiggi Macchiavello Espinoza
Coordenador do Programa de Pós-graduação em Informática
Dedicatória
À Deus e aos meus mentores espirituais, à minha esposa Cinthia,
aos meus pais e irmãos e, por fim,
Agradecimentos
À minha amada esposa e sobretudo amiga, Cinthia, que me acompanhou remota e pres-encialmente nas diversas fases de meu doutoramento. Muito obrigado, gatinha, pela compreensão nos momentos em que tive que me ausentar, por levantar meu ânimo e me encorajar nos momentos de desânimo, por celebrar comigo as boas notícias, enfim... Obrigado por estar sempre ao meu lado.
Aos meus pais, irmãos e cunhadas, pela confiança e pelo apoio durante todo esse tempo de estudos e trabalhos. Apesar de muitas vezes ter que abrir mão de estar com todos vocês, eu sempre soube que vocês estavam ali ao lado para o que eu precisasse e isso sempre me trouxe a confiança e o conforto necessários para seguir adiante.
Agradeço de modo muito especial ao meu orientador, Prof. Vander Alves, pelo com-promisso, profissionalismo e pelas inestimáveis contribuições oferecidas ao longo de minha orientação. Obrigado por sempre me oferecer as melhores condições para realizar minha pesquisa, seja através de minha capacitação ao incentivar minha participação em valiosas escolas de versão, seja por fornecer alunos de graduação e mestrado para auxiliar em min-has tarefas. Mas, em especial, agradeço-lhe por entender os momentos difíceis pelos quais passei e que tiveram impacto em minha pesquisa. Por fim, não posso deixar de agradecer por me ensinar através da convivência o modo como um pesquisador sério conduz os seus trabalhos de pesquisa e orientação sempre buscando a investigação de temas relevantes e a excelência nos estudos. Esse ensinamento é, de fato, inestimável!
Agradeço à minha co-orientadora, Profa. Genaina Rodrigues, pelos valiosos comen-tários e sugestões (técnicos e pessoais) ao longo de nossa pesquisa. Por diversas vezes ela contribuiu com idéias a serem consideradas na execução do trabalho mas, também, ao dar dicas de como encarar as dificuldades típicas de um Doutorado. Aproveito para estender meus agradecimentos ao professores Pierre-Yves Schobbens e Sven Apel por disponibi-lizarem um tempo para reunir e contribuir de modo muito significativo com meu tra-balho. Vários outros professores também contribuiram muito para meu trabalho e minha formação dentre eles os professores Azzedine Boukerche, Doron Peled e Tom Mens.
todos vocês pela companhia no dia-a-dia do PPGI discutindo sobre doutorado ou, simples-mente, conversando sobre qualquer coisa que nos pudesse descontrair. Muito obrigado, pessoal!
Resumo
Contexto: Técnicas de verificação têm sido aplicadas para garantir que sistemas de
software atinjam níveis de qualidade desejados e atenda a requisitos funcionais e não-funcionais. Entretanto a aplicação dessas técnicas de verificação em linhas de produto de software é desafiador devido à explosão combinatorial do número de produtos que uma linha de produtos pode instanciar. As técnicas atuais de verificação de linhas de pro-dutos utilizam model checking simbólico e informações sobre variabilidade para otimizar a análise, mas ainda apresentam limitações que as tornam onerosas ou inviáveis. Em particular, as técnicas de verificação do estado da arte para análise de confiabilidade em linhas de produto são enumerativas o que dificulta a aplicabilidade das mesmas devido à explosão combinatorial do espaço de configurações.
Objetivo: Os objetivos dessa tese são os seguintes: (a) apresentar um método eficiente
para calcular a confiabilidade de todas as configurações de uma linha de produtos de sotware composicional ou anotacional à partir de seus modelos comportamentais UML, (b) fornecer uma ferramenta que implemente o método proposto e, (c) relatar um estudo empírico comparando o desempenho de diferentes estratégias de análises de confiabilidade para linhas de produto de software.
Método: Esse trabalho apresenta uma nova estratégia de análisefeature-family-based
para calcular a confiabilidade de todos os produtos de uma linha de produtos de software
(composicional ou anotacional). O passo feature-based da estratégia divide os
mode-los comportamentais em unidades menores para que essas possam ser analisadas mais
eficientemente. O passo family-based realiza o cálculo de confiabilidade para todas as
configurações de uma só vez ao avaliar as expressões de confiabilidade em termos de uma estrutura de dados variacional adequada.
Resultados: Os resulstados empíricos mostram que a estratégiafeature-family-based
para análise de confiabilidade supera, em termos de tempo e espaço, quatro outras es-tratéfias de análise do estado da arte (product-based, family-based, feature-product-based
e family-product-based) para a mesma propriedade. No contexto da avaliação e em
com-paração com as outras estratégias, a estratégia feature-family-based foi a única capaz de
Conclusões: A estratégia feature-family-based utiliza e se beneficia das estratégias feature- e family- ao domar o crescimento dos tamanhos dos modelos a serem analizados e por evitar a enumeração de produtos inerentes a alguns métodos de análise do estado da arte.
Palavras-chave: Linhas de produtos de software, análise de confiabilidade, verificação
Abstract
Context: Verification techniques are being applied to ensure that software systems
achieve desired quality levels and fulfill functional and non-functional requirements. How-ever, applying these techniques to software product lines is challenging, given the expo-nential blowup of the number of products. Current product-line verification techniques leverage symbolic model checking and variability information to optimize the analysis, but still face limitations that make them costly or infeasible. In particular, state-of-the-art verification techniques for product-line reliability analysis are enumerative which hinders their applicability, given the latent exponential blowup of the configuration space.
Objective: The objectives of this thesis are the following: (a) we present a method to
efficiently compute the reliability of all configurations of a compositional or
annotation-based software product line from its UML behavioral models, (b) we provide a tool that implements the proposed method, and (c) we report on an empirical study comparing the performance of different reliability analysis strategies for software product lines.
Method: We present a novel feature-family-based analysis strategy to compute the
reliability of all products of a (compositional or annotation-based) software product line. The feature-based step of our strategy divides the behavioral models into smaller units
that can be analyzed more efficiently. The family-based step performs the reliability
computation for all configurations at once by evaluating reliability expressions in terms of a suitable variational data structure.
Results: Our empirical results show that our feature-family-based strategy for reli-ability analysis outperforms, in terms of time and space, four state-of-the-art strategies (product-based, family-based, feature-product-based, and family-product-based) for the same property. In the evaluation’s context and in comparison with the other evaluation strategies, it is the only one that could be scaled to a 220-fold increase in the size of the
configuration space.
Summary
1 Introduction mylinkcolor!100!bl
1.1 Context: . . . mylinkcolor!100!bla 1.2 Solution . . . mylinkcolor!100!bla 1.3 Summary of Goals . . . mylinkcolor!100!bla 1.4 Organization . . . mylinkcolor!100!bla
2 Background mylinkcolor!100!bl
2.1 Software Reliability . . . mylinkcolor!100!bla 2.2 Reliability Analysis . . . mylinkcolor!100!bla 2.2.1 Parametric Probabilistic Reachability . . . mylinkcolor!100!bla 2.3 Algebraic Decision Diagrams . . . mylinkcolor!100!bla 2.4 Software Product Line . . . mylinkcolor!100!bla 2.4.1 Software Product Line Analysis . . . mylinkcolor!100!bla 2.5 Running example . . . mylinkcolor!100!bla 2.6 Conclusion . . . mylinkcolor!100!bla
3 Behavioral Modeling and Reliability of Software Product Lines mylinkcolor!100!bl
3.1 Probabilistic and Variable Behavior Modeling of Software Product Lines . . mylinkcolor!100!bla
3.1.1 UML Activity Diagrams’ Elements . . . mylinkcolor!100!bla
3.1.2 UML Sequence Diagrams . . . mylinkcolor!100!bla 3.2 Reliability of UML Behavioral Models . . . mylinkcolor!100!bla 3.2.1 Reliability of software product line . . . mylinkcolor!100!bla 3.2.2 Reliability of activity diagram elements . . . mylinkcolor!100!bla 3.2.3 Reliability of sequence diagram models . . . mylinkcolor!100!bla
3.3 Transformation from UML to FDTMC . . . mylinkcolor!100!bla
3.4.2 Reliability equivalence for sequence diagram . . . mylinkcolor!100!bla 3.5 Conclusion . . . mylinkcolor!100!bla
4 Feature-Family-based Reliability Analysis mylinkcolor!100!bl
4.1 Transformation . . . mylinkcolor!100!bla 4.1.1 Behavioral Models . . . mylinkcolor!100!bla
4.2 Runtime dependency graph (RDG) . . . mylinkcolor!100!bla
4.3 Feature-Based analysis . . . mylinkcolor!100!bla 4.4 Family-Based Analysis . . . mylinkcolor!100!bla 4.5 Conclusion . . . mylinkcolor!100!bla
5 Proposal Evaluation mylinkcolor!100!bl
5.1 Implementation . . . mylinkcolor!100!bla 5.2 Analytical Complexity . . . mylinkcolor!100!bla 5.3 Empirical Evaluation . . . mylinkcolor!100!bla 5.3.1 Subject Systems and Experiment Design . . . mylinkcolor!100!bla 5.3.2 Experiment setup . . . mylinkcolor!100!bla 5.3.3 Results and analysis . . . mylinkcolor!100!bla 5.3.4 Discussion . . . mylinkcolor!100!bla 5.4 Threats to validity . . . mylinkcolor!100!bla
6 Conclusion mylinkcolor!100!bl
6.1 Future Work . . . mylinkcolor!100!bla 6.2 Related works . . . mylinkcolor!100!bla 6.2.1 Comparison to a Feature-Product-based Strategy . . . mylinkcolor!100!bla 6.2.2 Other Related Work . . . mylinkcolor!100!bla
Referências mylinkcolor!100!bl
Appendix mylinkcolor!100!bl
A Experiment Data mylinkcolor!100!bl
List of Figures
2.1 Elimination of states in the algorithm by [mycitecolor!100!black38] . . . . mylinkcolor!100!bla
2.2 ADDAf representing the Boolean functionf . . . mylinkcolor!100!bla
2.3 BSN-SPL Feature Model . . . mylinkcolor!100!bla 2.4 Behavioral diagrams for BSN-SPL . . . mylinkcolor!100!bla
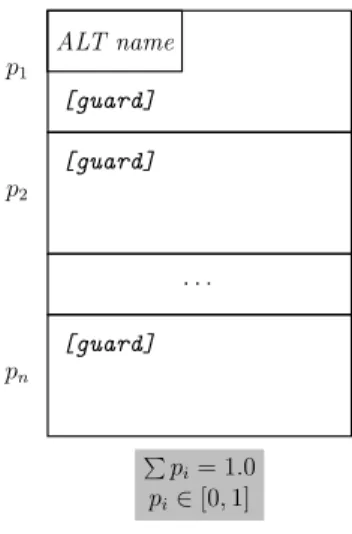
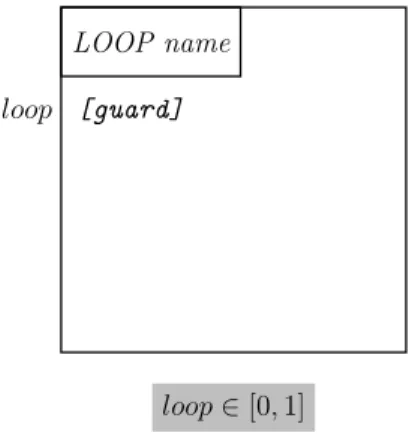
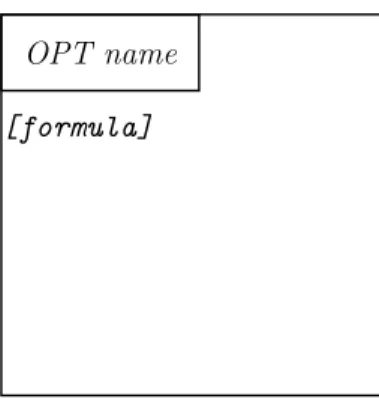
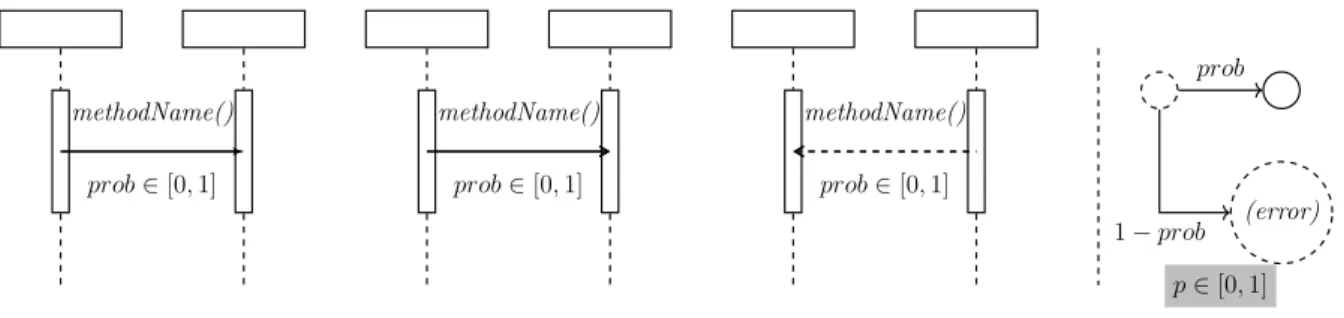
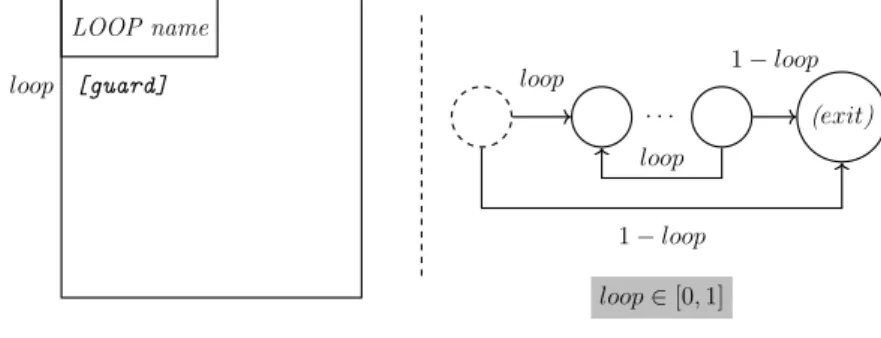
3.1 Initial node of a UML Activity Diagram . . . mylinkcolor!100!bla 3.2 Activity node of a UML Activity Diagram . . . mylinkcolor!100!bla 3.3 Decision node of a UML Activity Diagram . . . mylinkcolor!100!bla 3.4 Merge node of a UML Activity Diagram . . . mylinkcolor!100!bla 3.5 End node of a UML Activity Diagram . . . mylinkcolor!100!bla 3.6 Messages types of a UML sequence diagram . . . mylinkcolor!100!bla 3.7 Alternative fragment of a UML sequence diagram . . . mylinkcolor!100!bla 3.8 Loop fragment of a UML sequence diagram . . . mylinkcolor!100!bla 3.9 Optional fragment of a UML sequence diagram . . . mylinkcolor!100!bla 3.10 Associations between behavioral fragments, sequence diagrams and
Optio-nal combined fragments . . . mylinkcolor!100!bla 3.11 Transformation rule for an initial node of an activity diagram . . . mylinkcolor!100!bla 3.12 Transformation rule for an activity node of an activity diagram . . . mylinkcolor!100!bla 3.13 Transformation rule for a decision node of an activity diagram . . . mylinkcolor!100!bla 3.14 Transformation rule for a merge node of an activity diagram . . . mylinkcolor!100!bla 3.15 Transformation rule for an end node of an activity diagram . . . mylinkcolor!100!bla 3.16 Transformation rule for a synchrounous, asynchronous and reply messages
of a sequence diagram . . . mylinkcolor!100!bla 3.17 Transformation rule for an alternative fragment of an sequence diagram . . mylinkcolor!100!bla 3.18 Transformation rule for a loop fragment of a sequence diagram . . . mylinkcolor!100!bla 3.19 Transformation rule for an optional combined fragment of a sequence diagrammylinkcolor!100!bla 3.20 Intuition of the reliability equivalence of UML and FDTMCs models . . . . mylinkcolor!100!bla 3.21 Derivation tree and reliability formula computed for the activity diagram
3.23 Derivation tree of reliability definitions for the Sqlite feature . . . mylinkcolor!100!bla 3.24 FDTMC of theSqlite feature . . . mylinkcolor!100!bla
3.25 Derivation tree of reliability definitions for the Oxygenation and
Tempera-ture sequence diagrams . . . mylinkcolor!100!bla
3.26 FDTMC of theOxygenation and Temperature sequence diagrams . . . mylinkcolor!100!bla
4.1 Feature-family-based approach for efficient reliability analysis of product
lines . . . mylinkcolor!100!bla 4.2 Resulting FDTMCs . . . mylinkcolor!100!bla 4.3 RDG excerpt for the BSN product line . . . mylinkcolor!100!bla 4.4 ADDs for the running example . . . mylinkcolor!100!bla
5.1 Evolution of subject systems accomplished by the SPL-Generator tool . . . mylinkcolor!100!bla
5.2 Time and memory required by different analysis strategies when evaluating
evolutions of Email System . . . mylinkcolor!100!bla
5.3 Time and memory required by different analysis strategies when evaluating
evolutions of MinePump System . . . mylinkcolor!100!bla
5.4 Time and memory required by different analysis strategies when evaluating
evolutions of BSN-SPL . . . mylinkcolor!100!bla
5.5 Time and memory required by different analysis strategies when evaluating
evolutions of Lift System . . . mylinkcolor!100!bla
5.6 Time and memory required by different analysis strategies when evaluating
evolutions of InterCloud System . . . mylinkcolor!100!bla
5.7 Time and memory required by different analysis strategies when evaluating
List of Tables
4.1 Reliability of rOxygenation, rTemperature and rSituation fragments . . mylinkcolor!100!bla
5.1 Initial version of product lines used for empirical evaluation . . . mylinkcolor!100!bla 5.2 Probabilistic models statistics . . . mylinkcolor!100!bla
Chapter 1
Introduction
Achieving a high quality, low costs, and a short time to market are the driving goals of software product line engineering. It aims at developing a number of software products sharing a common and managed set of features [1]. A software product line [2] is created to take advantage of the commonalities and variabilities of a specific application domain, by reusing artifacts when instantiating individual software products (a.k.a.variantsor simply
products). A domain variability is expressed in terms of features, which are distinguishable characteristics relevant to some stakeholder of the domain [3]. Nowadays software product line engineering is widely accepted in both industry [4,5] and academia [6,2, 7,1].
Quality assurance of product lines has drawn growing attention [8,9]. Model checking
is a verification technique that systematically explores the possible states in a formal model of the system in order to find out whether a given property is satisfied or not by software[10].
Such an analysis is realized by an automated evaluation method that performs an exhaustive search over the state space that represents the software’s behavior. The fulfill-ment of the property under investigation is formally verified in each reachable state such the model checker answersyesin case it is satisfied orno, otherwise. For the last case, the model checker also presents a counter-example to indicate how the unexpected result can be reached again [10]. The models considered and verified by model checkinng techniques are usually finite-state automata. In such models, each state represents the conditions reached by the software after each actions it takes, and such actions are associated to every transition between two states.
unity has elapsed. Parametric Markov Chains (PMC) extend DTMCs with the ability to represent variable transition probabilities. Whereas probabilistic choices are fixed at modeling time and represent possible behavior that is unknown until run time, variable transitions represent behavior that is unknown already at modeling time. These variable transition probabilities is useful to represent probabilities in a model whose values varies according to software or the context [11, 12].
Particularly, model checking techniques for product lines explore the space of all
pro-ducts in a product line by searching for execution states where functional [13, 14, 15] or
non-functional [16, 11, 17, 18, 12] properties are violated [19]. Nevertheless, employing
model checking techniques to verify product lines is a complex task, posing a twofold chal-lenge [14]: (1) the number of variants whowm need to be verified may grow exponentially with the number of features, which gives rise to anexponential blowupof the configuration
space [20, 15, 21, 6]; and (2) model checking is inherently prone to the state-explosion
problem [10, 19] given the size (often huge) of the models to be evaluated. Therefore, model checking all products of a product line is often not feasible in practice [9].
Dependability is a non-functional software property that should be considered in a pro-babilistic sense and which encompasses attributes such as availability and reliability[22].
The authors stress the probabilistic nature of dependability when state “the extent to
which a system possesses the attributes of dependability should be considered in a proba-bilistic sense” [22]. From the probabilistic perspective, the reliability can be defined as a probabilistic existence property [23] whereby the result of measuring the probability of reaching some desired states in a stochastic model will indicate the probability of a software successfully accomplishes its tasks.
1.1
Context:
In previous work, model checking techniques have been applied to analyze probabilistic
properties of product lines, in particular, the reliability [11, 12, 18]. These approaches
attenuate the complexity of analyzing probabilistic properties by exploiting, to some ex-tent, reuse in modeling and analysis. On the one hand, non-compositional techniques exploit commonalities across products resulting into a single model representing the va-riability and the behavior of the product line as a whole (covering the behaviors of all products), but it may not scale due to the large state space of models generated by this
modeling approach [12, 18]. On the other hand, a compositional alternative is to
cre-ate and analyze isolcre-ated models for each feature and then evalucre-ate them jointly for each configuration [11]. This approach is space-efficient, but faces the exponential blowup of
sca-lability issues. In essence, both approaches have limitations in reusing analysis effort in
product lines. As a result, state-of-the-art verification techniques for product-line relia-bility analysis are enumerative (a.k.a. product-based), which hinders their applicability, given the latent exponential blowup of the configuration space. Consequently,
unwan-ted redundant computational effort is wasted on modeling and analyzing product line’s
models [11].
Reduce or eliminate the redundant effort when verifying SPL’s models worth to be
investigated due the need of scalar model checking approaches able to evaluate SPLs within time and space constraints in case such restrictions needs to be considered by the model checker. For example, Real-time systems are known by having strong time constraints to provide an answer for an event perceived by the system [24]. If such answer is to deploy a new configuration within a specific reliability threshold value, the model checker must be able to verify which SPL’s products can fulfill such constraint within the deadline specified for the real-time system. A particular example is the Ambient Assisted Living (AAL) system which monitors changes at individual’s health conditions in order to identify emergency conditions and performing appropriate actions [25]. According to the individual’s health conditions the AAL must ensure different reliability thresholds are
reached. Thus improve the scalability of reliability verification is relevant and must be investigated. The reuse of software models previously computed and evaluated seems to be a promising approach for taming the SPLs evaluation’s complexity because it may decrease the verification effort, in special it may extinguish the redundant verification
effort.
1.2
Solution
As the key contribution, it is presented a method to efficiently compute the reliability of
all products of both compositional and annotation-based product lines, without enumera-ting and analyzing each of these products. In a brief, the software product line’s behavior is represented by UML behavioral diagrams (namely Activity and Sequence diagrams)
which, by their turn, are composed by different behavioral fragments, each one with a
specific semantics and a guard condition denoting the software’s context that may be ob-served to allow the execution of its behavior. The behavioral variability is represented for
both kinds of software product lines by means of optional behavioral fragments with an
associated propositional formula defined in terms of the features calledpresence condition.
However, they differentiate by the manner how features are associated to such fragments.
Meanwhile a compositional product line has its variability represented by distincts and
defi-ned in different locations and, such variabilities points may also be nested (likewise the
ifdef compilation’s directives) [26]. The method employs a divide-and-conquer strategy
in which pre-computed reliabilities of individual behavioral model fragments associated to one or more features are combined to compute the reliability of the whole product line in a single pass. Each variability point is a behavioral fragment whose guard condition denotes its presence condition by a propositional expression defined in terms of features. In a nutshell, in the first step, a feature-based analysis is applied to build a variable and probabilistic model per behavioral fragment and to analyze each such model using a pa-rametric model checker. In such step, each behavioral fragment of the software product line (denoting a variability or a commonanlity) is analyzed in isolation from others frag-ments, where its UML representation is transformed into a probabilistic model able to represent its variable behavior. Such model is, indeed, a Discrete-Time Markov Chain (DTMC) able to represent variability. Later, in the same step, a parametric model checker is employed in order to analyze the probability of each behavioral fragment reaches its last state, which is understood as the reliability in the context of this work. Such parametrical analysis returns expressions that describe the reliability of fragments, whose parameters in a features’s reliability expression represent the reliabilities of other fragments which
it depends at runtime. In the second step, the method performs a family-based step to
evaluate each expression in terms of Algebraic Decision Diagrams [27] that are used to encode the knowledge about valid feature combinations and the mapping to their corres-ponding reliabilities. Such step is characterized by solving all the resulting expressions from the feature-based step, taking into account the presence condition of each behavi-oral fragment and the well-formedness rules defined by the Feature Model. The result of the family-based evaluation of a behavioral fragment is the reliabilities values for each valid-partial configuration that satisfy both fragment’s presence condition and Feature Model’s rules. Such result is represented in a concise manner by means of Algebraic De-cision Nodes whose structure is a tree having each level associated to a feature and each leaf node to a reliability value. Since the method is a combination of feature-based and family-based analyzes, it is effectively a feature-family-based analysis strategy [9], being
the first of its kind for reliability analysis.
In a brief, the proposed approach differs from prior work [14,11] in that (1) it captures
the runtime feature dependencies from the UML behavioral models, (2) such dependencies are enriched with variability information extracted from the FM, (3) it computes the reliability values each feature may assume by evaluating each stochastic model considering the (partial) variability information and (4) compute the reliability of all SPL’s products by explicitly reusing the reuse of each feature’s evaluations.
Analysis), whose source code is publicly available as a free and open-source software1. The
tool takes as input a set of UML behavioral models annotated with reliability information and the feature model of a product line, and it outputs the reliability values for the valid configurations (i.e., products) of this product line. To evaluate the time-space complexity, 120 experiments were performed to empirically compare the feature-family-based analy-sis strategy with the following state-of-the-art strategies [9]: product-based, family-based,
feature-product-based, and family-product-based. In a brief, such strategies differentiate
by the representativeness of their models and the manner how such models are traversed during the analyzis: at the one hand the feature-based method is an enumerative appro-ach where a probabilistic model is built for eappro-ach product, meanwhile at the other hand the family-based approach consists of a single model representing the whole variability of the software product line. In addition, evaluation strategies may also be comprised of
two or more steps, each one performing a different analysis. The family-product-based
strategy derives a behavioral model for a specific product from the model representing the behavior of whole software product line by solving its variability and then analyzing the resulting model. Other two analyses are the feature-product- and feature-family-based,
which differ only by their last step. Both strategies initially perform a feature-based
analysis where the behavioral fragments associated to one or more features are evaluated in isolation from the others. The second step consists of evaluating the resultant models from the first-step. In the case it is analyzed in an enumerative fashion, such an analysis is performed for all products instantiable by composing its related behavioral fragments, the second-step is performed by following a product-based strategy. Otherwise, in the case all the fragments are evaluated in a single step and results into the reliabilities of the whole configuration space, it is considered a family-based analyzis, so the whole analysis is considered a feature-family-based strategy. All these alternative strategies were
imple-mented as variations of ReAnaand used to analyze twenty variants of each of six publicly
available product-line models: a system for monitoring an individual’s health [12], control systems for mine pumps [28] and lifts [29], an email system [30], inter-cloud configura-tion [31], and a game [30]. These product lines have been used widely as benchmarks; they have configuration spaces of different sizes, ranging from dozens to billions of billions
of products.
The experiment consisted of progressively increasing the number of features and the size of the behavioral models for each of the product lines, analyzing each of the evolved product lines with all analysis strategies. The results indicate that the feature-family-based strategy has the best performance in terms of time and space, being the only one that could be scaled to a 220-fold increase in the size of the configuration space for
1
reliability analysis when compared to four state-of-the-art strategies for the same property: product-based, family-based, feature-product-based, and family-product-based.
In summary, the contributions of this work are the following:
• It introduces a novel feature-family-based strategy for reliability analysis that analy-zes each behavioral fragment (associated to one or more features) in isolation and combines the resulting pieces of information to compute the reliability of a given product line (Chapter 4);
• It provides a novel tool, called ReAna, implementing such feature-family-based
method, to carry out the analysis of reliability of a product line from its UML
behavioral diagrams and its feature model (Section 5.1);
• It reports on an empirical study comparing the performance of our
feature-family-based strategy to other state-of-the-art analysis strategies, implemented as an
ex-tension of our ReAna tool (Section 5.3).
Supplementary material, including theReAna tool and its extensions (which include
all evaluation strategies considered in this work), as well as models used in the empiri-cal evaluation and respective experimental results are publicly available for replication
purposes at http://splmc.github.io/scalabilityAnalysis/.
1.3
Summary of Goals
The research has the following key goals:
• to present how the behavior of software product lines can be modeled by usual UML
behavioral diagrams and evaluated following a divide-and-conquer strategy;
• to provide an evaluation method aimed for the reliability analysis of software product lines;
• to empirically compare the proposed evaluation method with other state-of-the-art
evaluation strategies.
1.4
Organization
The text is organized as follows:
• Chapter2reviews some concepts regarding the model checking techniques and
then some concepts about software product lines and a suitable probabilistic mo-deling suitable for representing its probabilistic and variable behavior. Finally, it presents the running example which will be used along the text, followed by the scope refinement of this work;
• Chapter 3presents in details how the probabilistic and variable behavior of a
soft-ware product line can be represented by means of UML behavioral diagrams and the manner how such diagrams are interrelated. Next, the notion of reliability of software product lines in the scope of UML behavioral models is presented, fol-lowed by the reliability definition of each behavioral element considered in this work. The transformation of UML behavioral diagrams into the fully probabilistic model FDTMC and an informal equivalence notion between such models (UML and FDTMC) are presented in the following.
• Chapter 4 presents the method proposed for the reliability evaluation of software
product lines. Initially, the transformation step to create FDTMCs from UML
models by applying the transformation rules described in Chapter 3 is presented,
followed by the data structure created to jointly represent the behavioral and pro-babilistic information of the software product line. In the following, it is presented
the analysis of the probabilistic models by the feature-based step and the manner
how the reliability of the whole software product line is computed in a single pass
by the family-based step. Finally, the tool support that implements the method is
presented in the following.
• Chapter 5 initially presents how the evaluation method was implemented by an
open and publicly available tool. Then two evaluation methods are described such the first one is an analytical evaluation of the method in contrast to the related work most similar for the evaluation of probabilistic models of software product lines. The other evaluation is an empirical evaluation that compares the evaluation method hereby presented with other 4 state-of-the-art evaluation strategies.
• Chapter 6 presents the final remarks, the comparisons with related works and list
Chapter 2
Background
This chapter provides an overview of fundamental concepts related to the work and a running example to guide the presentation of the evaluation method in later sections.
2.1
Software Reliability
Probabilistic verification techniques have been used in the past to substitute the concept of absolute correctness by bounds on the probability that certain behavior may occur [23]. Based on probabilistic models, it is possible to specify probabilistic system behavior due to, e.g., intrinsically unreliable hardware components and environmental characteristics. Reliability can be defined as a probabilistic existence property [23], in the sense that it is given by the probability of eventually reaching some set ofsuccess states in a probabilistic behavioral model of a system.
This means the reliability of a system is the probability that, starting from an ini-tial state, the system reaches a set of target (also success) states. This value is called
reachability probability. To analyze this property, we first model the system’s behavior as a DTMC—a tuple (S, s0,P, T), where S is a set of states, s0 œ S is the initial state,
P is the transition probability matrix P : S ◊S æ [0,1], and T ™ S is the set of
tar-get states. Moreover, each row of the transition probability matrix sums to 1, that is,
’sœS·P(s, S) = 1, whereP(s, S) =qsÕœSP(s, s
Õ ).
For every state s œ S, we say that a state sÕ is a successor of
s iff P(s, sÕ
) > 0. Accordingly, the set of successor states of s, Succ(s), is defined as Succ(s) = {sÕ
œ S|P(s, sÕ
) > 0}. A DTMC induces an underlying digraph where states act as vertices
and edges link states to their successors. This way, we say that a state sÕ of a DTMC
is reachable from a state s, denoted by s sÕ, i
ff sÕ is reachable from
s in the DTMC’s
underlying digraph. Likewise, we write s ” sÕ to denote that
This notation is also used with respect to a setT of states: s T iffthere is at least one
state sÕ
œT such that s sÕ, and
s ” T otherwise.
The reachability probability for a DTMC can be computed using probabilistic model checking algorithms, implemented by off-the-shelf tools [10, 32]. An intuitive and correct
view of reachability probability, although not well-suited for efficient implementation, is
that a target state is reached either directly or by first transitioning to a state that is able to recursively reach it. We present a formalization of this property, adapted from Baier and Katoen [10], that suits the purpose of this work.
Property 1 (Reachability probability for DTMCs). Given a DTMCD= (S, s0,P, T), a
state s œ S, and a set T ™ S of target states, the probability of reaching a state t œ T
from s satisfies the following property:
P rD(s, T) =
Y _ _ _ _ ] _ _ _ _ [
1 if sœT
0 if s” T
q
sÕœS\T P(s, s
Õ
)·P rD(sÕ
, T) +q
tœT P(s, t) if s /œT ·s T
Whenever T is a singleton {t}, we write P rD(s, t) to denote P rD(s, T).
In a product line, different products give rise to distinct behavioral models. To handle
the behavioral variability that is inherent to product lines, we resort toParametric Markov Chains [33].
2.2
Reliability Analysis
Reliability analysis can be defined as a probabilistic existence property [34]. This means the reliability of a system is the probability that, starting from an initial state, the system reaches a set of target (also success) states. This value is called reachability probability. To analyze this property, we first model the system’s behavior as a DTMC—a tuple
(S, s0,P, T), where S is a set of states, s0 œ S is the initial state, P is the transition
probability matrix P: S◊S æ[0,1], andT ™S is the set of target states.1 Moreover,
each row of the transition probability matrix sums to 1, that is,’sœS·P(s, S) = 1, where
P(s, S) =q
sÕœSP(s, s
Õ ).
For every state s œ S, we say that a state sÕ is a successor of
s iff P(s, sÕ
) > 0. Accordingly, the set of successor states of s, Succ(s), is defined as Succ(s) = {sÕ
œ S|P(s, sÕ
) > 0}. A DTMC induces an underlying digraph where states act as vertices
1
and edges link states to their successors. This way, we say that a state sÕ of a DTMC
is reachable from a state s, denoted by s sÕ, i
ff sÕ is reachable from
s in the DTMC’s
underlying digraph. Likewise, we write s ” sÕ to denote that
sÕ is unreachable from s.
This notation is also used with respect to a setT of states: s T iffthere is at least one
state sÕ
œT such that s sÕ, and
s ” T otherwise.
The reachability probability for a DTMC can be computed using probabilistic model checking algorithms, implemented by off-the-shelf tools [10, 32]. An intuitive and correct
view of reachability probability, although not well-suited for efficient implementation, is
that a target state is reached either directly or by first transitioning to a state that is able to recursively reach it. We present a formalization of this property, adapted from Baier and Katoen [10], that suits the purpose of this work.
Property 2 (Reachability probability for DTMCs). Given a DTMCD= (S, s0,P, T), a
state s œ S, and a set T ™ S of target states, the probability of reaching a state t œ T
from s satisfies the following property:
P rD(s, T) =
Y _ _ _ _ ] _ _ _ _ [
1 if sœT
0 if s” T
q
sÕœS\T P(s, s
Õ
)·P rD(sÕ
, T) +q
tœT P(s, t) if s /œT ·s T
Whenever T is a singleton {t}, we write P rD(s, t) to denote P rD(s, T).
In a product line, different products give rise to distinct behavioral models. To handle
the behavioral variability that is inherent to product lines, we resort toParametric Markov Chains [33].
Parametric Markov Chains (PMC) extend DTMCs with the ability to represent
va-riable transition probabilities. Whereas probabilistic choices are fixed at modeling time and represent possible behavior that is unknown until run time, variable transitions re-present behavior that is unknown already at modeling time. These variable transition probabilities can be leveraged to represent product-line variability [35, 36, 37].
Definition 1 [Parametric Markov Chain] A Parametric Markov Chain [38] is defined
as a tuple P = (S, s0, X,P, T), where S is a set of states, s0 is the initial state, X ={x1, . . . , xn}is a finite set of parameters, P is the transition probability matrix
P : S ◊S æ FX, and T ™ S is the set of target (or success) states. The set FX
comprises the rational expressions over R with variables in X, that is, fractions of
polynomials with Real coefficients. This way, the semantics of a rational expression
Á is arational function fε(x1, . . . , xn) = p1(x1,...,x n)
p2(x1,...,xn) fromR
n toR, wherep
Real polynomials. For brevity, we hereafter refer to rational expressions simply as
expressions.
By attributing values to the variables, it is possible to obtain an ordinary
(non-parametric) DTMC. Parameters are given values by means of an evaluation, which is
a total function2
u : X æ R for a set X of variables. For an expression Á œ FX and
an evaluation u : XÕ
æ R (where XÕ is a set of variables), we define
Á[X/u] to denote
the expression obtained by replacing every occurrence of x œ XflXÕ in
Á by u(x), also
denoted by Á[x1/u(x1), . . . , xn/u(xn)].
For instance, suppose we have sets of variablesX ={x, y}and XÕ
={x, y, z}, and an evaluation u={x ‘æ2, y ‘æ5, z ‘æ 3}. If ÁœFX is the rational expressionx≠2y, then
Á[X/u] =Á[x/2, y/5] = 2≠2·5 =≠8. Note that, if u’s domain, XÕ, is di
fferent from the
set X of variables in Á, then Á[X/u] =Á[(XflXÕ)/u].
This definition can be extended to substitutions by other expressions. Given two
variable sets X and XÕ, their respective induced sets of expressions
FX and FXÕ, and
an expression Á œ FX, a generalized evaluation function u : X æ FXÕ substitutes each
variable in X for an expression in FXÕ. The generalized evaluationÁ[X/u] then yields an
expression ÁÕ œ FXÕ. Moreover, successive expression evaluations can be thought of as
rational function compositions: for u:X æFXÕ and uÕ :XÕ æR,
Á[X/u][XÕ /uÕ
] =Á[x1/u(x1)[XÕ/uÕ], . . . , xk/u(xk)[X
Õ /uÕ
]] (2.1)
for x1, . . . , xk œX (since u is a total function, we do not need to consider non-evaluated
variables).
The PMC induced by an evaluation u is denoted by Pu = (S, s0,ÿ,Pu, T)
(alternati-vely, P[X/u]), where Pu(s, sÕ) = P(s, sÕ)[X/u] for all s, sÕ œ S. To ensure the resulting
chain after evaluation is indeed a valid DTMC, one must use a well-defined evaluation.
Definition 2 [Well-defined evaluation] An evaluationu:X æRiswell-defined for
a PMC P = (S, s0, X,P, T) iff, for all s, sÕ œS, it holds that
• Pu(s, sÕ)œ[0,1] (all transitions evaluate to valid probabilities)
• Pu(s, S) = 1 (stochastic property—the probability of disjoint events must add
up to 1)
2
Hereafter, we drop explicit mentions to well-definedness whenever we consider an evaluation or a DTMC induced by one, because we are only interested in this class of evaluations. Nonetheless, we still need to prove that specific evaluations are indeed well-defined.
2.2.1
Parametric Probabilistic Reachability
To compute the reachability probability in a model with variable transitions, we use a parametric probabilistic reachability algorithm. A parametric model checking algorithm
for probabilistic reachability takes a PMC P as input and outputs a corresponding
ex-pression Á representing the probability of reaching its set T of target states. Hahn et.
al [38] present such an algorithm and prove that evaluating Áwith an evaluation u yields
the reachability probability for the DTMC induced in P by the same evaluation u.
Figure2.1[38] illustrates a single step of this parametric probabilistic reachability algo-rithm. The main idea is that, for a given states, the probability of one of its predecessors
(s1) reaching one of its successors (s2) is given by the sum of the probability of
transi-tioning through s and the probability of bypassing it. In this example, other states and
respective transitions are omitted. Note that, since there is a self-loop with probabilitypc,
there are infinite possible paths going through s, each corresponding to a number of times the loop transition is taken before transitioning to s2. Hence, the sum of probabilities for
these paths correspond to the infinite sum qŒ
i=0pa(pc)ipb =pa(q
Œ
i=0pic)pb =pa1≠1pcpb.
3
Definition 3 [State elimination step] Given a PMC P = (S, s0, X,P, T) and an
arbitrary state s œ S, a state elimination step of the algorithm by [38] updates the
transition matrix Pto PÕ, such that, for all states
s1, s2 œS\ {s},
PÕ(s1, s2) = P(s1, s2) +P(s1, s)·
1
1≠P(s, s)·P(s, s2)
The soundness of the parametric probabilistic reachability algorithm [38] is expressed by the following lemma.
Lemma 1 (Parametric probabilistic reachability soundness). Let P = (S, s0, X,P, T)
be a PMC, u be a well-defined evaluation for P, and Á be the output of the parametric
probabilistic reachability algorithm by Hahn et. al [38] forP andT. Then,P rPu
(s0, T) = Á[X/u].
3
Whenever0< x <1, we have the following convergent sum: q∞
i=0x i
s1 s s2
s1 s2
papc pb pd
pa1≠1pcpb+pd
Figure 2.1: Elimination of states in the algorithm by [38]
Demonstração. The elimination algorithm [38] is based on eliminating states until only the initial and the target ones remain. Its proof consists of showing that each elimination step preserves the reachability probability. We refer the reader to the work by Hahn et. al. [38] for more details on the algorithm itself and the proof mechanics.
2.3
Algebraic Decision Diagrams
An Algebraic Decision Diagram (ADD) [39] is a data structure that encodesk-ary Boolean
functions Bk æ R. As an example, Figure 2.2 depicts an ADD representing a binary
function f.
f(x, y) =
Y _ _ ]
_ _ [
0.9 if x·y 0.8 if x·¬y
0 otherwise
x
y
0.8
0.9 0
Figure 2.2: ADD Af representing the Boolean function f
Each internal node in the ADD (one of the circular nodes) marks a decision over a single parameter. Function application is achieved by walking the ADD along a path that denotes this decision over the values of actual parameters: if the parameter represented by the node at hand is 1(true), we take the solid edge; otherwise, if the actual parameter
is0(false), we take the dashed edge. The evaluation ends when we reach a terminal node
(one of the square nodes at the bottom).
In the example, to evaluatef(1,0), we start in thex node, take the solid edge to node y(since the actual parameterxis1), then take the dashed edge to the terminal0.8. Thus, f(1,0) = 0.8. Henceforth, we will use a function application notation for ADDs, meaning
For brevity, we also denote indexed parameters b1, . . . , bk as ¯b, and the application A(¯b)
by JAK¯b.
ADDs have several applications, two of which are of direct interest to this work. The first one is the efficient application of arithmetics over Boolean functions. We employ
Bo-olean functions to represent mappings from product-line configurations (BoBo-olean tuples) to their respective reliabilities. An important aspect that motivated the use of ADDs for this variability-aware arithmetics is that the enumeration of all configurations to per-form Real arithmetics on the corresponding reliabilities is usually subject to exponential blowup. ADD arithmetic operations are linear in the input size, which, in turn, can also be exponential in the number of Boolean parameters (i.e., ADD variables), in the worst case. However, given a suitable variable ordering, ADD sizes are often polynomial, or
even linear [39]. Thus, for most practical cases, ADD operations are more efficient than
enumeration.
An arithmetic operation over ADDs is equivalent to performing the same operation on corresponding terminals of the operands. Thus, we denote ADD arithmetics by corres-ponding real arithmetics operators. Formally, given a valuation for Boolean parameters
¯
b =b1, . . . , bkœBk, it holds that:
1. ’§œ{+,≠,◊,÷}·(A1§A2)(¯b) = A1(¯b)§A2(¯b)
2. ’iœN·Ai1(¯b) =A1(¯b)i
The second application of interest is the algorithmic encoding of the result of an
if-then-else operation over ADDs again as another ADD. For the ADDs Acond, Atrue, and Afalse, we define the ternary operator ITE(if-then-else) as
ITE(Acond, Atrue, Afalse)(c) =
Y _ ]
_ [
Atrue(c) if Acond(c)”= 0
Afalse(c) if Acond(c) = 0
More details on the algorithms for ADD operations are outside the scope of this work and can be found elsewhere [39].
2.4
Software Product Line
A Software Product Line is defined as a set of software-intensive systems that share a common, managed set of features satisfying the specific needs of a particular market seg-ment or mission and that are developed from a common set of core assets in a prescribed way [2].
The main element in the software product-line engineering is to manage the variability which means having the ability to change or customize a system [5]. Such a variability is usually expressed in terms of features which are used to specify and communicate
commonalities and differences of the products the software product line can instantiate.
They are represented graphically by a feature diagram, which is a feature model [3, 40]
depicted as a tree that captures the existing dependencies and constraints among the features [6]. A product of a product line is specified by a valid feature selection that fulfills all feature dependencies.
A software product line can be built using an annotation-based in case each feature is marked accordingly in a common code base, such a product is formed by removing codes related to features that do not comprise the product. Also, a software product lin can be build by a compositional approach, where each feature is implemented in a distinct unit and a product is build by composing the elements regarding its feature selection [26].
In addition, each product instantiated from a software product line has different
at-tributes and characteristics which can be subject to some kind of analysis, in special its non-functional requirements. Some analysis techniques usually employed to the analysis of usual software are being adapted to analyze the products a software product line may instantiate as, for example, type checking, model checking, static analysis and theorem proving [9]. In particular, such task may not be feasible in practice [14] since the number of products a software product line may instantiate can be huge, sometimes it is expo-nential to the number of features (indeed a software product line may, in the worst case, instantiate 2|F| products, where|F| denotes the number of features.
2.4.1
Software Product Line Analysis
To analyze the behavior of a product line, it is useful to embed its inherent
variabi-lity in such a probabilistic model. A possible approach is to use parametric DTMCs
(PDTMC) [41], which augment DTMCs with transition probabilities that can be expres-sed as variables. A PDTMC is a DTMC whose probability matrix takes values from a set
X of strictly positive parameters. A PDTMC gives rise to a family of DTMCs by
instan-tiating the formal parameters to values with an instantiation functionŸ:Q+fiX ‘æ[0,1].
For a parametric DTMC DX and an instantiation function Ÿ,Ÿ(Dx)denotes the DTMC
whose probability matrix is given by instantiatingDX’s formal parameters. For PDTMCs,
which outputs a rational expression (a fraction of two polynomials) on the same variables as the ones in the input parametric model. The idea behind this technique is that evalua-ting the variables in the rational expression yields the reliability value of the DTMC that would be obtained by an equivalent evaluation of the variables in the PDTMC. However, this behavioral representation does not take a variability model (e.g., a feature model) into account, and thus is not sufficient for representingpossible behavior in a product line
(i.e, behavior of actual products).
Several analysis techniques have been proposed by researchers for software product lines, each one taking a particular property into account. To help researchers and practi-tioners understand the similarities and differences among such techniques, Thüm et. al [9]
propose a classification of the existing techniques, which is followed in this work. In this
context, a product-based reliability analysis operates only on derived (non-variable) UML
behavioral models, whereas the variability model may be used to generate the models. As it is a brute-force strategy, it is only feasible for product lines with few products. In contrast, the family-based strategy for reliability analysis operates over variant-rich UML behavioral models and incorporates the knowledge about valid feature combinations. In afeature-based analysis strategy, the reliability of UML behavioral models related to each individual feature is analyzed in isolation from the others, i.e., interactions among fea-tures and the knowledge about valid feature combinations are not incorporated into the analysis.
Other evaluation strategies may be formed by combining two or more strategies afore-mentioned [9]. For instance, afeature-product analysis consists of a feature-based analysis step followed by a product-based analysis, such that the result of the feature-based analy-sis is reused by the product-based analyanaly-sis. In the context of reliability, the reliability of UML behavioral models related to each feature is first evaluated in isolation and then the analysis result is reused when enumerating and evaluating the reliability of each
non-variant UML behavioral model of the product line. In the opposite, the feature-family
based consists of evaluating each feature in isolation (ie. a feature-based step) followed by the family-based evaluation step when each features evaluation’s results are reused jointly with the knowledge about all valid configurations. Both evaluation strategies follows a compositional strategy to face the scalability issues. The compositional analysis allows to evaluate models’ fragments in isolation from the others and compose such partial results in a latter step, what diminishes the evaluation effort in comparison to non-compositional
analysis [42].
Although other combined evaluation strategies are possible, the aforementioned stra-tegies suffice as contrast to the hereby proposed strategy. For more information regarding
Featured Discrete-time Markov Chains (FDTMC) [12] are probabilistic models that properly handle product-line variability. They can be thought as DTMCs that, instead of transition probabilities, have transitionprobability profiles. These profiles are functions
JFMK æ[0,1] that map a configuration to a probability value, whereJFMK denotes the
set of valid configurations of the feature model FM. Rodrigues et. al. [12] proposed
a method to encode an FDTMC as a PDTMC, enabling its analysis by off-the-shelf
parametric model checkers. The present work leverages the view of Rodrigues et. al. [12] of FDTMCs as PDTMCs for the purpose of compositional reliability analysis.
2.5
Running example
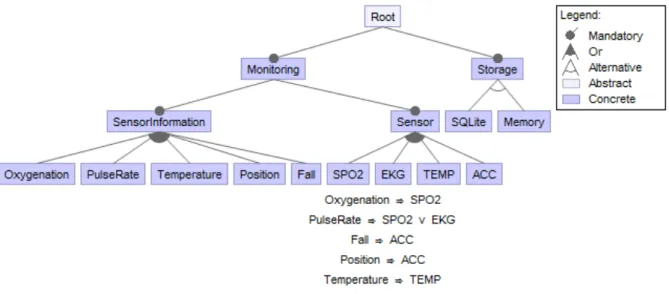
To illustrate the concepts presented throughout this thesis, it will be considered an exam-ple of a simexam-ple product line within the medical domain, for which reliability is considered the major requirement [43]: the Body Sensor Network (BSN) product line is a network of connected sensors that capture vital signs from an individual and send them to a cen-tral system to analyze the collected data and identify critical health situations [12]. This product line has software components that interpret data provided by the sensors and analyze an individual’s health situation, as well as components for data persistence in a database or memory. The set of possible configurations for this product line is defined by
its feature model (Figure 2.3), in which wireless sensors are grouped by feature Sensor,
software components for interpreting health information are grouped by feature
Senso-rInformation, and the alternatives for data persistence are grouped by feature Storage.
Figure 2.3: BSN-SPL Feature Model
information about the health condition, identify health goal changes, and reconfigure the system if necessary. This control loop represents the coarse-grained behavior of the
BSN product line and it is modeled by the activity diagram shown in Figure 2.4a, with
each activity being represented in detail by an associated sequence diagram involving the software components and their behavior. The underlined words in the activities nodes are the terms by each activity will be referred along this text. Every product instantiated from the BSN product line executes this control loop and, whenever the individual’s health condition changes and this triggers a quality-of-service (QoS) goal change, another product is instantiated from this product line with the desired behavior to reach the desired QoS goal. By its turn, the behavioral representation provided by sequence diagrams is considered fine-grained since its elements are able to represent the software components enrolled in a task execution, the manner how the interactions between such components happens, in addition to behavioral branches, loops and variability. In special, sequence diagrams play the role of representing the behavioral variability due the software product line where necessary by means of guard conditions involving the presence of features (a.k.a
presence conditions [44]).
For instance, Figures2.4b and2.4cpresent an excerpt of the sequence diagram
associ-ated with the activity System identifies situation (Figure 2.4a). This activity consists of processing and persisting data regarding the individual’s health condition, in particular
sensor information, represented by feature SensorInformation and its child features in
Figure2.3. Figure2.4b depicts the behavior associated with the computation and
persis-tence of the individual’s oxygenation. Such a behavior is defined by the messages
exchan-ged between five software components, whose roles are data processing (Oxygenation) and
persistence (P ersistence,SQLiteandM emory—P ersistencedispatches calls to the
con-crete persistence engines), and components for communication and coordination (Bus).
Each message is named according to its task and has an associated probability valueprob
to represent the reliability of the communication channel between the components com-prising the interaction. The reliability is given by the product of (a) the probability that the required message arrives at the receiver component and (b) the receiver component’s reliability (i.e., the probability that it performs the required task without failure). For the
BSN product line, we assume that all channels have the minimal reliability 0.999. The
same understanding described above applies to the sequence diagram of Figure 2.4csince
it processes and persists data regarding the individual’s temperature.
The guard condition at the top level of the sequence diagram presented in Figure2.4bis
the atomic propositionOxygenation. This means that the enclosed behavior is associated
with the presence of the Oxygenation feature in a given configuration. This behavior, in
System captures vital signal
System identifies situation
Compute new QoS goal
Was there any QoS goal change?
System reconfiguration
to achieve new QoS goal
yes
no
(a) Activity Diagram representing the control loop of BSN-SPL
(b) Sequence diagram (excerpt) associated with the activitysystem identifies situation, for
processing and persisting Oxygenation information.
(c) Sequence diagram (excerpt) associated with the activity system identifies situation, for
optional fragment whose guard condition is SQLite models the behavior of persisting
data in a database whenever feature SQLite is part of a configuration. Likewise, the
optional fragment associated to the presence of the feature Memory (i.e., the fragment
with theMemoryguard) models persistence on secondary memory. In an analogous way the
sequence diagram represented in Figure 2.4cis associated to the presence of Oxygenation
feature, since its presence condition is defined by the atom Oxygenation. It also has two
variability points for data persistence related toSQLiteandMemoryfeatures, respectively.
Note that the dynamic behavior of the BSN product line does not affect the method
to reliability analysis, since it only considers the execution of tasks up to reconfiguration
(Figure 2.4a). Moreover, the approach is entirely based on design-time artifacts. For a
deeper discussion of how the BSN product line is engineered for reconfiguration and of how the reliability computation affects this dynamic behavior, please refer to [45]
2.6
Conclusion
This chapter presented the main topics related to the verification of probabilistic proper-ties of software product line. The verification of such properproper-ties is indeed important to ensure the desired quality level of the products a software product line. For such verifi-cation the model checking techniques play a major role but it faces challenges regarding the sizes of the configuration space and the evaluated models. Nowadays evaluation
tech-niques propose some improvements in order to reduce the evaluation effort, like the use
of symbolic model checkers, but there is still space for improvements.
The work hereby presented is, thus, aimed to explore the verification of probabilistic properties in the context of software product lines, in special, the reliability property. Such property can be evaluated on probabilistic models as the reachability measure of states considered successfull. For such evaluation, the proposed evaluation method seeks to tame
the required effort by employing a feature-family strategy that divides the behavioral
Chapter 3
Behavioral Modeling and Reliability
of Software Product Lines
To evaluate probabilistic properties of a software product line, reliability in particular, initially it is necessary representing the variable behavior jointly with the probabilistic information. Briefly, such an information represents the success and failure probabilities of executing the communications between software components. Both behavioral variability and probabilistic information of software product lines can be represented by the UML activity and sequence diagrams. Later, such diagrams can be transformed into their respective fully probabilistic models (FDTMCs), which must represent the states variation of the context comprising all products of the software product line.
The software product line’s behavior can be considered at two abstraction levels. The high level is a coarse-grained representation that employs the UML activity diagram for
modeling the set of activities executed by all products. The low level is a fine-grained
representation whose role is to model the whole variable and probabilistic behavior of a software product line. Since the variable behavior is defined by the interaction among software components, such behavior is modeled by means of UML sequence diagrams. To represent the probabilistic information of the behavior represented by both activity and sequence diagrams, their semantics can be extended by the UML MARTE [46] profile. Thus, the joint representation of behavioral variability and probabilistic information in UML behavioral diagrams is the suitable notation for modeling the probabilistic behavior of a software product line.
with variability for representing all products’ behavior (c.f. Section 2.4.1), while the reliability property is defined as the reachability measure that expresses the probability of reaching a set of sucessfull states on a probabilistic model [23].
This chapter presents how the variable and probabilistic behavior of a software pro-duct line can be modeled by UML behavioral diagrams (activity and sequence diagrams) and later transformed into FDTMCs. The behavioral modeling of software product lines is addressed in Section3.1that introduces the coarse-grained behavioral representation by
UML activity diagrams (Section 3.1.1), followed by the probabilistic and variable
beha-vioral representation provided by UML sequence diagrams (Section 3.1.2). Section 3.2
introduces the reliability notion using DTMCs for UML behavioral diagrams and how it is considered in the context of software product lines. Section 3.3 presents a set of
trans-formation rules for creating FDTMC models from UML behavioral models. Section 3.4
demonstrates evidences that the reliability computed based on UML behavioral diagrams and the reliability computed based on its corresponding FDTMCs are equivalent, which
supports the correctness of transformation rules. Finally, Section 3.5 presents concluding
remarks.
3.1
Probabilistic and Variable Behavior Modeling of
Software Product Lines
Representing the software’s characteristics by models is useful to preview and to analyze its diverse properties and behavior. Among the notations for software representation the Unified Modeling Language (UML) stands out as it provides manifold diagrams to
address the different software’s characteristics. Within the range of UML diagrams the
activity diagram is a high level and coarse-grained behavioral representation that is usually employed to represent the software’s main tasks and their execution order. The sequence diagram is a fine-grained behavioral representation that details how software components interact during a task execution. The UML MARTE profile augments the semantics of activity and sequence diagrams by associating probabilistic information to their behavioral elements.
The representation of the software product line’s behavior resembles the behavioral representation of an usual software. The differences arise because the behavioral