A probabilistic capacity spectrum strategy for the
reliability analysis of bridge pile shafts considering soil structure
interaction
Abstract
This paper presents a probabilistic capacity spectrum strat-egy for the reliability analysis of a bridge pile shaft, account-ing for uncertainties in design factors in the analysis and the soil-structure interaction (SSI). Monte Carlo simulation method (MCS) is adopted to determine the probabilities of failure by comparing the responses with defined limit states. The analysis considers the soil structure interaction together with the probabilistic application of the capacity spectrum method for different types of limit states. A cast-in-drilled-hole (CIDH) extended reinforced concrete pile shaft of a bridge is analysed using the proposed strategy. The results of the analysis show that the SSI can lead to increase or de-crease of the structure’s probability of failure depending on the definition of the limit states.
Keywords
pile shaft, capacity spectrum method, reliability analysis, soil-structure interaction, probability of failure.
Dookie Kima,∗,
Sandeep Chaudharya,b, Charito Fe Nocetea,
Feng Wanga and
Do Hyung Leec
a
Department of Civil and Environmental Engineering, Kunsan National University, Jeonbuk – Korea
b
Department of Structural Engineering, Malaviya National Institute of Technology Jaipur, Jaipur – India
c
Department of Civil, Environment and Railroad Engineering, Paichai University, Daejeon – Korea
Received 27 Dec 2010; In revised form 11 May 2011
∗Author email: [email protected]
1 INTRODUCTION
Bridges and highways are affected by earthquakes. For instance, during the Loma Prieta, Northridge and Kobe earthquakes a large number of bridges supported on piles collapsed. Wei et al. [31] have presented a summary on the damage of bridges supported on pile foundations caused by major earthquakes. Additional forces are generated by the soil-pile-superstructure interaction which has been found to be a critical factor. In practical design different response modification factors must be used for foundations and pile bents [1]. However, SSI factors may lead to either conservative designs or under designs [14]. Therefore, there is a need for efficient and accurate strategies for the proper analysis and design of bridge piles subjected to earthquakes that take into account SSI effects.
292 D. Kim et al / A probabilistic capacity spectrum strategy for the analysis of bridge shafts considering soil interaction
motion. The conventional CSM is a deterministic method for assessing a structure’s perfor-mance to earthquake demands and does not account for uncertainties of design parameters like material properties and loads.
However, the design parameters have always exhibited randomness or uncertainties. Thus, randomness in design factors has to be considered in the engineering analysis. In the prob-abilistic analysis, the structural performance can be expressed in terms of the probability of failure. With the randomness of the design parameters taken into account in the analysis, the result is also expected to be random in nature.
Recently, Thomos and Trezos [30] examined the probabilistic response of reinforced concrete structures using static non-linear analysis coupled with sampling techniques. In their study, the randomness of various material properties and loads for reinforced concrete frames under several analysis cases was taken into account. Although seismic motion and soil properties are also random in nature, these were not considered in their study. A probabilistic CSM was suggested by Choi and Kim [6] to determine the probability of failure of concrete piers of multi-span continuous bridges. This study by Choi and Kim incorporated the probabilistic properties of the concrete compressive strength and ground acceleration into the standard equations of the probability density functions (PDF) of the capacity and demand curves, respectively. However, soil-structure interaction effects were not considered.
The process in which the response of the soil (to forces, e.g. earthquake) influences the motion of the structure, and vice versa, is called soil-structure interaction (SSI). Conventional structural analysis usually assumes a fixed base condition neglecting SSI effects. However, it has been generally recognized that SSI can affect the response of structures, especially those founded on relatively flexible soil. Numerous guidelines exist recognizing the importance of considering soil-structure interaction (SSI) effects for design or evaluation purposes [5, 10–12]. Like all structural design parameters, soil properties are also random in nature. Various sources of uncertainty of soil properties may be the spatial variability of soil properties (where patterns of variability may be either continuous or discrete), limited soil survey and laboratory or in situ testing, inaccuracies of soil investigation methods and erroneous interpretation of investigation results [23]. Although a number of publications are available on the stochastic analysis of structure interaction [22, 25], the reliability analysis of structures, including soil-structure interaction is rarely addressed [17]. Studies have been carried out by Harnpornchai and Pansamdaeng [17] for the reliability analysis of structures subjected to earthquake. The dynamic soil-pile-structure was accounted for in the study, and it was found that the effect of pile-to-pile interaction on the behavior is very small and can be neglected to make the analysis more efficient.
It is therefore, observed from the review of the studies carried out that there is a need for probability based capacity spectrum method for the seismic analysis of the bridge pile shafts which can take into account the SSI also.
shaft of a bridge structure. Uncertainties in parameters such as material properties, ground acceleration, and soil properties are considered in the analysis. The probability of failure of the shaft is obtained according to limit states specified in the study. Analysis is carried out considering and neglecting the SSI to establish the effect of SSI.
2 PROBABILISTIC CAPACITY SPECTRUM METHOD
The Capacity Spectrum Method (CSM) compares the capacity of a structure with the demands of earthquake ground motion on the structure by a graphical procedure. Simplified seismic performance evaluation procedures based on the CSM have been presented in ATC-40 [3] and FEMA-274 [9]. A review of the development of the capacity spectrum method (CSM) has been given by Freeman [13]. Several researches have been conducted on the study, application and improvement of the CSM [7, 8, 24, 32]. The conventional CSM obtains a deterministic expected structural response to earthquake. However, there are certain uncertainties present in the geometry, material, load parameters and structural model. An accurate evaluation of the performance of structural systems, therefore, requires a probabilistic approach.
Monte Carlo simulation (MCS) may be employed in the general procedure of the CSM. MCS are intended for various numerical problems such as solving ordinary stochastic differential equations, ordinary differential equations with random entries, boundary value problems for partial differential equations, integral equations, and evaluation of high dimensional integrals, including path-dependent integrals [26, 29].
Monte Carlo simulation may be defined by six essential elements [16]: (1) definition of the problem in terms of random variables; (ii) quantifying the probabilistic characteristics of all the random variables; (iii) generating values of random variables; (iv) evaluating the problem deterministically for each set of realizations; (v) extracting probabilistic information form such realizations; and (vi) determining the accuracy of simulation.
As a simple simulation technique, MCS can calculate the probability of failure for ex-plicit and imex-plicit limit state functions of the random variables. The random variables are sampled several times in MCS to represent its real distribution according to its probabilistic characteristics [16, 20].
294 D. Kim et al / A probabilistic capacity spectrum strategy for the analysis of bridge shafts considering soil interaction
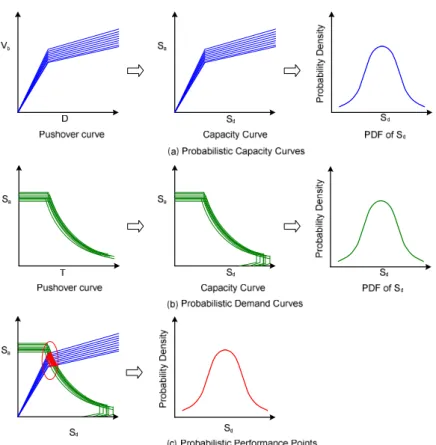
Figure 1 General procedure of the probabilistic CSM.
of performance points, also has a random character. The probabilistic characteristics of these points can also be obtained. The performance points are compared with a limiting value defined by a performance function. Finally, the probability of failure of the structure can be evaluated using the limit states.
For the present study, the global displacement ductility limit state and structural drift limit states have been considered. The displacement ductility can be defined as
µ∆=
∆max
∆y
(1)
where ∆y is the yield displacement and ∆max is the maximum expected displacement. Two
displacement ductility limit states are used in this study: µ∆ = 2 and µ∆ = 1. The first
limit state is based on the serviceability limit state. For bridges, this may be taken as that occurring when traffic is stopped, or restricted after an earthquake, while remedial measures are undertaken. Spalling of concrete should not have occurred, and crack widths should be sufficiently small so that injection grouting is not necessary. A value ofµ∆=2 is typical for this
For the structural drift limit state, a structural drift ratio of 2.5% is used in this study. In previous works [19], an ultimate drift ratio of less than 8% was found to be appropriate in order to limit the residual drift ratio to less than 1%, which is an ideal limit to keep a structure serviceable.
The limit state function is then defined as
g=∆max−∆T (2)
where ∆T is the expected top displacement or the performance point as established by the
intersection of the capacity and demand diagrams. A value ofg<0 indicates failure.
In MCS, the probability of failure is obtained using the following equation
Pf =
Nf
N (3)
where Nf is the number of simulation cycles when g <0 indicating a failure state, and N is
the total number of simulation cycles.
3 ANALYSIS MODEL
3.1 Model description
The structure studied in this paper is a cast-in-drilled-hole (CIDH) extended reinforced con-crete pile shaft of a bridge as illustrated in Fig. 2a [28]. The single-column bent is 12 m high above the ground and extends to a depth of 15 m below the ground with uniform dimensions and reinforcement details. It carries a total weight of 8,000 kN that is assumed to act at a superstructure midheight of 11 m above ground level. To account for the influence of soil flexibility, the model includes nonlinear p-y soil springs at different depths as shown in Figs. 2(b) and 2(c). The nonlinear p-y soil spring elements used in the model are based on a study reported by Boulanger et al. [4]. These elements are capable of accounting for the effects of gap formation and gap closure between the pile and soil as well as the effects of radiation damping in the soil. The column is assumed to be reinforced with 30, 36-mm dia longitudinal bars and 19-mm dia spiral bars with a pitch of 115 mm (Fig. 2d). The pile is modeled as a nonlinear beam-column element with a discretized fiber section using OpenSees software [27]. The ele-ment is based on the iterative force formulation and considers the spread of plasticity along the element. The integration along the element is based on the Gauss-Lobatto quadrature rule [27]. The element is divided transversally into fibers and longitudinally into segments. This type of finite element can provide better accuracy in the calculation of the nonlinear behavior of the column [27]. Each fiber of each segment corresponds to unconfined or confined concrete, or reinforcing steel.
296 D. Kim et al / A probabilistic capacity spectrum strategy for the analysis of bridge shafts considering soil interaction
Figure 2 Analysis model: elevation and cross-section [28].
3.2 Random variables
Table 1 shows the random variables and their assumed probabilistic characteristics as used in this study. Mean values are generally based on design values while the coefficients of variance (COV) are based on a report by Haukaas and Kiureghian [18].
Table 1 Random variables.
Parameter Mean Distribution COV
Concrete compressive strength 24.1 MPa Lognormal 0.15 Steel yield strength 414 MPa Lognormal 0.1 Steel modulus of elasticity 200 GPa Lognormal 0.05 Soil properties
Unit weight 19 kN/m3
Lognormal 0.05
Friction angle 42○ Lognormal 0.1
Earthquake response spectral acceleration 0.60-1.25g Gumbel 0.15-0.30
For the construction of the elastic response spectra, the mapped spectral accelerations in the International Building Code [21] are taken as the mean values. These are assumed to follow the Type I extreme value distribution (Gumbel distribution) with COV values that could range between 0.15-0.30 depending on the site location [15]. A number of response spectra are constructed, using MCS, following the NEHRP guidelines stipulated in FEMA-356 [12]. In this study, different spectral accelerations for the earthquake demand are considered for the different limit states to be evaluated. The smaller earthquake represents a smaller demand for which the bridge is expected to remain elastic. Here, the generated probabilistic demand curves intersect the capacity spectrum around the yield point. The larger one represents a major earthquake which has been adjusted by an appropriate damping factor to represent inelastic response.
4 RESULTS AND DISCUSSION
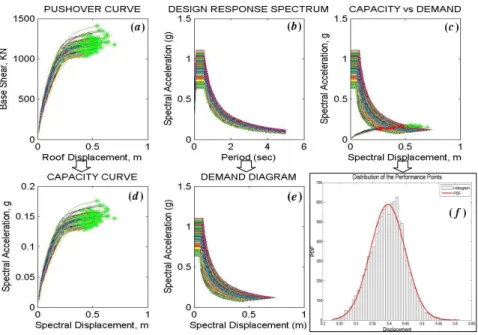
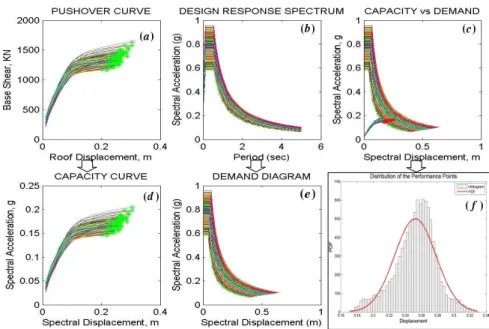
Figs. 3 and 4 show the results obtained for the flexible and fixed base conditions, respectively, for the µ∆ =2 displacement ductility limit state. The conversion from pushover to capacity
curves and elastic design response spectra to demand diagrams are shown in these figures. Figs. 3(c) and 4(c) show the “overlaying” of the capacity with demand diagrams. Their inter-sections, also known as the performance points, are plotted as red points. The probabilistic characteristics of the obtained performance points are shown in the Figs. 3(f) and 4(f), repre-sented by a histogram and a fitted probability density function (PDF) curve. The probabilistic CSM plots for theµ∆=1 and 2.5% drift limit states are shown in Fig. 5.
298 D. Kim et al / A probabilistic capacity spectrum strategy for the analysis of bridge shafts considering soil interaction
Figure 4 Fixed base model analysis results for limit stateµ∆=2.
The resulting values of the Pf’s are summarized in Table 2. It is observed, for the
dis-placement ductility limit states, that the model with the fixed base condition has a higher Pf
compared to the model with a flexible base condition. However, for the structural drift limit state, the flexible base condition has a higherPf.
Table 2 Probability of failure (Pf) results.
Type of Base Limit States
µ∆=2 µ∆=1 2.5% drift Flexible base 0.0567 0.5388 0.9703
Fixed base 0.5700 0.9027 0.5388
The difference in the probabilities of failure of the two different foundation models for the different limit states can be seen more clearly in Fig. 6, where Pf is plotted against the total
number of simulation cycles,N, for each limit state.
It can be seen that as N increases, the value of Pf slowly becomes consistent, indicating
stability of the results. Increasing N further would increase the accuracy of the estimate, but would also result to a costly calculation time. In this study, there were a total of 10,000 simulations for each foundation condition as there were 100 capacity and 100 demand curves generated. For the limit states based on the global displacement ductility ratio (µ∆ =2 and
µ∆ =1), the Pf for the fixed base condition (dashed line) is higher than that of the flexible
base (solid line). This means that for a certain desired value ofPf, the fixed base model would
require greater values of the design parameters than the flexible base model. This could lead to a more conservative structural design. The displacement ductility limit state is dependent on the structural strength or capacity. Thus, when design is based on capacity limit states, the more conservative foundation assumption would be the fixed base condition. This finding is consistent with that of Hutchinson et al. [19], where it was found that a conservative design for the structural strength would assume stiffer soil conditions (or fixed base assumptions).
For the structural drift limit state however, it is the flexible base condition that yields a greater probability of failure compared to the fixed base condition. This means that if the design is made considering the structural drift limit state, the flexible base assumption is the more conservative approach. This result is also in agreement with the finding of Hutchinson et. al. [19], that a conservative design to limit structural drift would assume softer soil conditions (or flexible base assumptions).
Comparing the two foundation conditions, it can be seen that the Pf is affected by the
foundation modeling assumption used. These changes in the value of Pf illustrate the effect
300 D. Kim et al / A probabilistic capacity spectrum strategy for the analysis of bridge shafts considering soil interaction
5 CONCLUSIONS
A probabilistic capacity spectrum strategy was presented for the reliability analysis of bridge pile shafts with the consideration of the uncertainties in material properties, earthquake re-sponse acceleration, and soil-structure interaction effects. Studies were carried out using the proposed strategy for a cast-in-drilled-hole (CIDH) extended reinforced concrete pile shaft of a bridge. With predefined limit states, the probability of failure was calculated by Monte Carlo simulation.
The conclusions drawn from this study are as follows:
1. Inclusion of SSI and the randomness of soil properties in the analysis can affect the structure’s probability of failure depending on the defined limit states.
2. In the capacity limit states, the fixed base model yielded a greater probability of failure. This means that if the design is based on structural strength, assuming a fixed base condition is the more conservative approach.
3. In the structural drift limit state, it is the flexible base model that yielded a greater probability of failure. Thus, a conservative design to limit structural drift would assume softer soil conditions (or a flexible base assumption).
4. SSI inclusion may not always be conservative for seismic design, in contrast to the com-mon expectation.
Studies may be carried out in future for establishing the effect of the parameters like the rotatory inertias of the pier cap at the top and of the column itself, the eccentricity of the axial load applied at the top end, the distance from the top end of the column or pier to the centroid of the top cap and the imperfections of the column.
AcknowledgementsThis research was supported by a grant (Construction Technology Inno-vation Program) from “Development of Nonlinear Earthquake Performance Evaluation Tool including Soil-Structure Interaction” funded by Ministry of Land, Transport and Maritime Affairs (MLTM) of Korean government.
References
[1] AASHTO. AASHTO LRFD bridge design specifications. American Association of State Highway and Transport Officials, Washington, DC, 1998.
[2] American Petroleum Institute (API), Washington, DC. API recommended practice for planning, designing, and constructing fixed offshore platforms, API Recommended Practice 2A (RP2A), 17th edition, 1987.
[3] Applied Technology Council, California.Seismic evaluation and retrofit of concrete buildings, 1996. Report ATC-40.
[4] R.W. Boulanger, C.J. Curras, B.L. Kutter, D.W. Wilson, and A. Abghari. Seismic soil-pile-structure interaction experiments and analyses.Journal of Geotechnical and Geoenvironmental Engineering, ASCE, 125(9):750–59, 1999.
302 D. Kim et al / A probabilistic capacity spectrum strategy for the analysis of bridge shafts considering soil interaction
[6] J.S. Choi and J.K. Kim. Development of failure probability analysis method for concrete piers of multi-span continuous bridges using the probabilistic capacity spectrum method. InANCER Annual Meeting, Hawaii, 2004.
[7] A.K. Chopra and R.K. Goel. Capacity-demand-diagram methods based on inelastic design spectrum. Earthquake Spectra, 15:637–656, 1999.
[8] P. Fajfar. Capacity spectrum method based on inelastic demand spectra. Earthquake Engineering and Structural Dynamics, 28:979–993, 1999.
[9] FEMA. NEHRP commentary on the guidelines for the seismic rehabilitation of buildings (FEMA-274). Federal Emergency Management Agency, Washington, DC, 1997.
[10] FEMA.NEHRP Guidelines for the Seismic Rehabilitation of Buildings (FEMA-273). Federal Emergency Manage-ment Agency, Washington, DC, 1997.
[11] FEMA.Prestandard and Commentary for the Seismic Rehabilitation of Buildings (FEMA-356). Federal Emergency Management Agency, Washington, DC, 2000.
[12] FEMA.Improvement of Nonlinear Static Analysis Procedures (FEMA-440). Applied Technology Council, California, USA, 2005.
[13] S. Freeman. Review of the development of the capacity spectrum method.ISET Journal of Earthquake Technology, 41:1–13, 2004.
[14] R.B. Gajer and V.P. Wagh. Bridge design for seismic performance category B. The problem with foundation design. InThe 11th International Bridge Conference, Pittsburgh, PA, 1994. Paper IBC-94-62.
[15] M. Ghosn, F. Moses, and J. Wang. Design of highway bridges for extreme events. Technical Report NCHRP Report 489, NCHRP Project 12-48, Transportation Research Board of the National Academies, Washington, DC, 2003.
[16] A. Haldar and S. Mahadevan. Reliability assessment using stochastic finite element analysis. John Wiley and Sons, Inc., New York, USA, 2000.
[17] N. Harnpornchai and P. Pansamdaeng. Reliability analysis of structures subjected to earthquake with dynamic soil-pile-structure interaction. InInter. Conf. on Structural Safety and Reliability (ICOSSAR ’01), California, USA, 2001.
[18] T. Haukaas and A.D. Kiureghian. Finite element reliability and sensitivity methods for performance-based earthquake engineering. Technical Report PEER Report 2003/14, Pacific Earthquake Engineering Research Center, UC Berkeley, 2004.
[19] T.C. Hutchinson, R.W. Boulanger, Y.H. Chai, and I.M. Idriss. Inelastic seismic response of extended pile shaft supported bridge structures. Technical Report PEER Report 2002/14, Pacific Earthquake Engineering Research Center, UC Berkeley, 2002.
[20] S.M. Ibrahim, N.A. Siddiqui, and S.Q.A. Naqvi. A simple procedure for reliability assessment of thin composite plates against buckling.Latin American Journal of Solids and Structures, 4:267–297, 2007.
[21] International Code Council (ICC), USA.International building code (IBC), 2003.
[22] S. Jin, L.D. Lutes, and S. Sarkani. Response variability for a structure with soil-structure interactions and uncertain soil properties.Probabilistic Engineering Mechanics, 15:175–183, 2000.
[23] Joint Committee on Structural Safety (JCSS). Probabilistic Model Code Section 3.7: Soil properties, 2006. revised version, Internet publication, http://www.jcss.eth.ch.
[24] Y.Y. Lin and K.C. Chang. An improved capacity spectrum method for ATC-40. Earthquake Engineering and Structural Dynamics, 32:2013–2025, 2003.
[25] L.D. Lutes, S. Sarkani, and S. Jin. Response variability of an ssi system with uncertain structural and soil properties. Engineering Structures, 22:605–620, 2000.
[26] S.A. Maidanov and A. Naraikin. Making the monte carlo approach even easier and faster. Intel Software Articles, 2008.
[27] S. Mazzoni, F. McKenna, M. Scott, and G. Fenves. OpenSees command language manual. Pacific Earthquake Engineering Research Center, UC Berkeley, 2006.
[29] S.M. Ross. Simulation. Academic Press, 1997.
[30] G. Thomos and C.G. Trezos. Examination of the probabilistic response of reinforced concrete structures under static non-linear analysis. Engineering Structures, 28:120–133, 2004.
[31] X. Wei, Q.Q. Wang, and J.J. Wang. Damage patterns and failure mechanisms of bridge pile foundation under earthquake. InThe 14th World Conference on Earthquake Engineering, Beijing, China, 2008.
![Figure 2 Analysis model: elevation and cross-section [28].](https://thumb-eu.123doks.com/thumbv2/123dok_br/18884422.423488/6.892.214.745.105.511/figure-analysis-model-elevation-and-cross-section.webp)