The role of yolk syncytial layer and blastoderm
movements during gastrulation in zebrafish
Dissertation
zur Erlangung des akademischen Grades
Doctor rerum naturalium
(Dr. rer. nat.)
vorgelegt der
Fakultät Mathematik und Naturwissenschaften der Technischen Universität Dresden
von
Lara Cristina de Jesus Carvalho
geboren am 18. Mai 1979 in Santa Iria de Azóia, Portugal
Gutachter: Prof. Dr. Michael Brand, Technische Universität Dresden
Dr. Carl-Philipp Heisenberg, Max Planck Institute of Molecular Cell Biology and Genetics, Dresden
Prof. Dr. António Jacinto, Universidade de Lisboa, Portugal
Eingereicht am: 13.August 2007
Summary
During gastrulation, a set of highly coordinated morphogenetic movements creates the shape and internal organization of the embryo. In teleostean fishes, these morphogenetic movements involve not only the embryonic progenitor cells (deep cells) but also two extra-embryonic tissues: an outer sheet of epithelial cells (EVL) and a yolk syncytial layer (YSL). Epiboly is characterized by the spreading of the blastoderm (deep cells and EVL) to cover the large yolk cell, whereas convergence and extension leads, respectively, to mediolateral narrowing and anteroposterior elongation of the embryo.
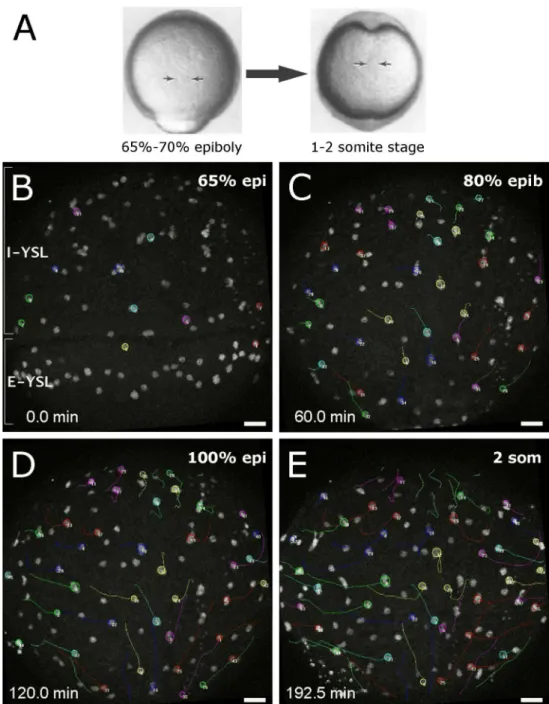
Recent studies have shown that the nuclei of the YSL undergo epiboly and convergence and extension movements similarly to the overlying deep cells, suggesting that these tissues interact during gastrulation. However, it is so far not clear whether and how the movements of YSL nuclei and deep cells influence each other.
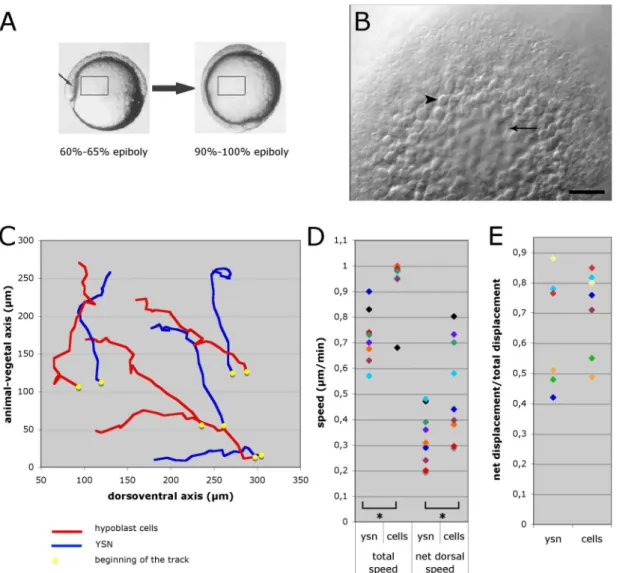
In the first part of this thesis, the convergence and extension movement of YSL nuclei was quantitatively compared to the movement of the overlying mesendodermal progenitor (or “hypoblast)” cells. This revealed that, besides the similarity in the overall direction of movement, YSL nuclei and hypoblast cell movements display differences in speed and directionality.
Next, the interaction between YSL and hypoblast was addressed. The movement of the blastoderm was analyzed when YSL nuclei movement was impaired by interfering with the YSL microtubule cytoskeleton. We found that YSL and blastoderm epiboly were strongly reduced, while convergence and extension were only mildly affected, suggesting that YSL microtubules and YSL nuclei movement are required for epiboly, but not essential for convergence and extension of the blastoderm. We also addressed whether blastodermal cells can influence YSL nuclei movement. In maternal-zygotic
one-eyed pinhead (MZoep) mutant embryos, which lack hypoblast cells, YSL nuclei do not undergo proper convergence movement. Moreover, transplantation of wild type hypoblast cells into these mutants locally rescued the YSL nuclei convergence phenotype, indicating that hypoblast cells can control the movement of YSL nuclei.
Table of contents
T
ABLE OF CONTENTS
T
ITLE01
S
UMMARY02
T
ABLE OF CONTENTS 03I
NDEX OF FIGURES 07A
BBREVIATIONS10
1.
I
NTRODUCTION12
1.1THE ZEBRAFISH AS A MODEL SYSTEM 12
1.2OVERVIEW OF ZEBRAFISH DEVELOPMENT 13
1.3THE YSL 16
1.3.1 FORMATION OF THE YSL 16
1.3.2 YSL FUNCTIONS DURING DEVELOPMENT 17
1.4GASTRULATION MOVEMENTS 20
1.4.1 EPIBOLY 21
1.4.2 HYPOBLAST FORMATION AND MIGRATION 25
1.4.3 CONVERGENCE AND EXTENSION 26
1.5AIMS AND APPROACHES OF THIS THESIS 33
2.
M
ATERIALS ANDM
ETHODS35
2.1MATERIALS 35
2.1.1 TECHNICAL EQUIPMENT 35
2.1.2 CHEMICALS 35
2.1.3 REAGENTS AND BUFFERS 36
2.1.4 MOLECULAR BIOLOGICAL REAGENTS 37
2.1.5 MOLECULAR BIOLOGICAL KITS USED 37
2.1.6 PLASMIDS AND CONSTRUCTS 37
2.1.7 ANTIBODIES 39
2.1.8 MORPHOLINO OLIGONUCLEOTIDES 39
2.2METHODS 40
Table of contents
2.2.2 INJECTION OF MRNA, MORPHOLINOS AND DYES INTO EMBRYOS 40
2.2.3 CELL TRANSPLANTATION 41
2.2.4 IMPLANTATION OF POLYSTYRENE BEADS IN THE YSL 42 2.2.5 INCUBATION OF EMBRYOS IN BODIPY CERAMIDE AND ER-TRACKER 43
2.2.6 INCUBATION OF EMBRYOS IN PACLITAXEL 43
2.2.7 GENERATION OF PLASMIDS FOR MRNA INJECTIONS AND ANTISENSE
RIBOPROBES 44
2.2.8 SYNTHESIS OF MRNA FOR INJECTION 44
2.2.9 SYNTHESIS OF DIG LABELED PROBES FOR IN SITU HYBRIDIZATION 44
2.2.10 WHOLE MOUNT IN SITU HYBRIDIZATION 45
2.2.11 BIOTIN DETECTION OF TRANSPLANTED CELLS 45
2.2.12 WHOLE MOUNT ANTIBODY STAINING 46
2.2.13 IMMUNOHISTOCHEMISTRY ON PARAFFIN SECTIONS 46
2.2.14 ELECTRON MICROSCOPY 47
2.2.15 MOUNTING OF LIVE EMBRYOS IN AGAROSE FOR TIME-LAPSE
MICROSCOPY 47
2.2.16 DIC LIVE IMAGING 48
2.2.17 TWO-PHOTON CONFOCAL TIME-LAPSE IMAGING 49
2.2.18 ANALYSIS AND QUANTIFICATION OF YSL NUCLEI MOVEMENT OBTAINED WITH TWO-PHOTON CONFOCAL TIME-LAPSE IMAGING 49
3.
R
ESULTS51
3.1YSL NUCLEI MOVEMENT DURING GASTRULATION 51 3.1.1 I-YSL NUCLEI UNDERGO CONVERGENCE AND EXTENSION
MOVEMENT SIMILAR TO HYPOBLAST CELLS DURING GASTRULATION 51 3.1.2 QUANTITATIVE ANALYSIS OF YSL NUCLEI MOVEMENT 53
3.2SUBCELLULAR ORGANIZATION OF THE YSL 56
3.2.1 SECRETORY MACHINERY 56
3.2.2 YSL MEMBRANE ORGANIZATION 58
3.3ORGANIZATION OF THE MICROTUBULE CYTOSKELETON IN THE YSL 62 3.3.1 ANALYSIS OF MICROTUBULE CYTOSKELETON LOCALIZATION 62 3.3.2 ORIENTATION OF MICROTUBULE GROWTH AND ITS RELATION TO
Table of contents
3.4EVIDENCE OF CYTOPLASMIC STREAMING WITHIN THE I-YSL 66
3.5REGULATION OF BLASTODERMAL CELL MOVEMENT BY YSL NUCLEI
MOVEMENT 68
3.6REGULATION OF YSL NUCLEI MOVEMENT BY THE OVERLYING
HYPOBLAST 72
3.6.1 I-YSL NUCLEI CONVERGENCE MOVEMENT IS REDUCED IN THE ABSENCE OF HYPOBLAST CELLS IN MATERNAL ZYGOTIC OEP
MUTANT EMBRYOS 72
3.6.2 OEP EXPRESSION WITHIN THE YSL IS NOT SUFFICIENT FOR YSL NUCLEI MOVEMENT IN MZOEP MUTANT EMBRYOS 75 3.6.3 TRANSPLANTED HYPOBLAST-LIKE CELLS PARTIALLY RESCUE THE
CONVERGENCE OF I-YSL NUCLEI IN MZOEP MUTANT EMBRYOS 76 3.6.4 CONVERGENCE OF I-YSL NUCLEI IS REDUCED IN SLB/PPT
LOSS-OF-FUNCTION 79
3.7E-CADHERIN LINKS HYPOBLAST MOVEMENT TO I-YSL NUCLEI
MOVEMENT 81
3.7.1 E-CADHERIN IS NECESSARY FOR PROPER I-YSL NUCLEI MOVEMENT 82 3.7.2 E-CADHERIN IS NECESSARY FOR THE COORDINATION BETWEEN
I-YSL NUCLEI AND HYPOBLAST CELL MOVEMENTS 86
4.
D
ISCUSSION 894.1RELEVANCE OF STUDYING YSL NUCLEI MOVEMENT FOR
UNDERSTANDING NUCLEAR MIGRATION IN OTHER SYSTEMS 89
4.2I-YSL NUCLEI UNDERGO CONVERGENCE AND EXTENSION MOVEMENT
SIMILAR TO HYPOBLAST CELLS 90
4.3YSL NUCLEI MOVEMENT VERSUSYSL MOVEMENT 91
4.4HOW DO NUCLEI MOVE WITHIN THE YSL? 91
4.4.1 THE ROLE OF MICROTUBULES FOR YSL NUCLEI MOVEMENT 92 4.4.2 CYTOPLASMIC STREAMING AND I-YSL NUCLEI MOVEMENT 94
4.5IMPORTANCE OF YSL NUCLEI MOVEMENT DURING GASTRULATION 96 4.5.1 ROLE OF NUCLEAR MOVEMENT FOR YSL AND BLASTODERM
EPIBOLY 96
Table of contents
4.5.3 IS THE MOVEMENT OF I-YSL NUCLEI IMPORTANT FOR BLASTODERM
CONVERGENCE AND EXTENSION MOVEMENT? 098
4.6INFLUENCE OF THE BLASTODERM ON I-YSL NUCLEI MOVEMENT 100 4.6.1 HYPOBLAST MOVEMENT IS NECESSARY FOR I-YSL NUCLEI
CONVERGENCE MOVEMENT 100
4.6.2 E-CADHERIN AS A LINK BETWEEN HYPOBLAST AND I-YSL 102
4.7 SIGNIFICANCE OF I-YSL NUCLEI MOVEMENT FOR EMBRYONIC
DEVELOPMENT 104
5.
R
EFERENCES106
6.
A
PPENDIX 1206.1 EXPRESSION OF DORSAL AND MESNEDODERMAL MARKERS IN
HYPOBLAST-LIKE CELLS TRANSPLANTED INTO MZOEP EMBRYOS 120 6.2 EXPRESSION OF SEVERAL PATTERNING GENES IN CDH1
YSL-MORPHANTS COMPARED TO WILD-TYPE CONTROL EMBRYOS 121
6.3 MOVIE LEGENDS 122
7.
A
CKNOWLEDGMENTS125
Index of figures
Index of figures
Figure 1.1 Development of the zebrafish 14
Figure 1.2 Formation of the YSL 17
Figure 1.3 Patterning roles of the YSL 19
Figure 1.4 Gastrulation movements in the zebrafish embryo 20 Figure 1.5 Epiboly movements in the zebrafish embryo 21 Figure 1.6 Morphogenesis and organization of the cytoskeleton in the YSL 23 Figure 1.7 Internalization and anterior migration of mesendodermal
progenitor cells at the onset of gastrulation 26 Figure 1.8 Cell movement trajectories in ventral, lateral and dorsal
convergence and extension domains 28
Figure 1.9 Scheme of mediolateral intercalation of axial cells at late stages
of gastrulation 30
Figure 1.10 Detailed diagram of YSL nuclei movement during gastrulation 31 Figure 3.1 Comparison between the movements of hypoblast cells and
I-YSL nuclei during wild type gastrulation by time-lapse imaging
using Nomarski optics 52
Figure 3.2 Two-photon confocal time-lapse imaging of YSL nuclei during gastrulation in a wild-type embryo
55
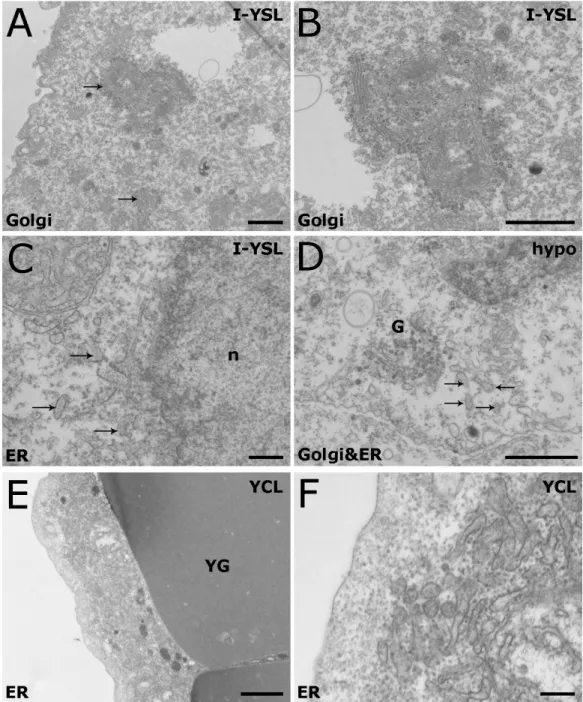
Figure 3.3 Organization of the Golgi apparatus and ER in the YSL of shield
stage embryos visualized by TEM 57
Figure 3.4 Organization of the Golgi apparatus and ER in the YSL of live
shield stage embryos 58
Figure 3.5 Membrane specializations in the YSL of shield stage embryos
visualized by TEM 59
Figure 3.6 Membrane specializations in the YSL at blastula and
mid-gastrula stages visualized by TEM 61
Figure 3.7 Organization of YSL microtubules during blastula and gastrula stages by single-photon confocal microscopy performed in fixed embryos
Index of figures
Figure 3.8 Organization of I-YSL microtubules during gastrulation in the
live embryo 64
Figure 3.9 Organization of E-YSL microtubules during gastrulation in the
live embryo 64
Figure 3.10 Dynamics of microtubule plus-ends in the blastoderm and YSL
during gastrulation 65
Figure 3.11 Movement of beads in the YSL during gastrulation 67 Figure 3.12 Treatment of gastrulating embryos with paclitaxel interferes with
E-YSL and YCL microtubules but not with actin 69 Figure 3.13 Treatment of gastrulating embryos with paclitaxel interferes with
YSL nuclei movement 71
Figure 3.14 I-YSL nuclei movement during gastrulation in MZoep embryos
using Nomarski optics 73
Figure 3.15 Two-photon confocal time-lapse imaging of YSL nuclei
movement during gastrulation in MZoep embryos 74 Figure 3.16 Comparison of the speed of I-YSL nuclei movement between
wild-type and MZoep embryos during gastrulation 74 Figure 3.17 Localization of oep mRNA in shield stage wild-type embryos 75 Figure 3.18 I-YSL nuclei movement in MZoep mutant embryos ectopically
expressing oep mRNA in the YSL 76
Figure 3.19 Transplantation of hypoblast-like cells into MZoep mutant
embryos induces convergence movement of I-YSL nuclei 78 Figure 3.20 Analysis of I-YSL nuclei and hypoblast cell movements during
gastrulation in slb/ppt embryos 80
Figure 3.21 Cadherin localization during gastrulation 82 Figure 3.22 Two-photon confocal time-lapse imaging of YSL nuclei
movement during gastrulation in cdh1 YSL-morphant and
cdh1/hab mutant embryos 84
Figure 3.23 Comparison of the speed of I-YSL nuclei movement between wild-type and cdh1 YSL-morphant and cdh1/hab mutant
Index of figures
Figure 3.24 Comparison of hypoblast cell and I-YSL nuclei movements
between wild-type and cdh1/hab mutants during gastrulation 87 Figure 3.25 Comparison of I-YSL nuclei and hypoblast cell movements
between wild-type and cdh1 YSL-morphants during gastrulation 88 Figure 4.1 Model of how E-cadherin-mediated adhesion might regulate
I-YSL nuclei movements. 103
Figure 6.1 Expression of dorsal and mesendodermal markers in MZoep and
MZoep mutant embryos transplanted with hypoblast-like cells 120 Figure 6.2 Expression of several patterning genes in cdh1 YSL-morphants
Abbreviations
Abbreviations
SI units and symbols of standard multiples and symbols of chemical elements are not listed here; gene names and protein/gene family names are explained in the text.
2D Two-dimensional
3D Three-dimensional
AVE Anterior visceral endoderm
BSA Bovine serum albumin
cDNA Complementary DNA
DAB 3’-3’-Diaminobenzidine
DEL Deep cell layer
DIC Differential interference contrast (Nomarski) optics
DIG Digoxygenin
DMSO Dimethylsulfoxide
DNase Desoxyribonuclease
dpf Days post-fertilization
ECM Extracellular matrix
e. g. exemplu gratii (Latin): for example
EGFP Enhanced green fluorescent protein
EMT Epithelial to mesenchymal transition
ER Endoplasmic reticulum
EVL Enveloping layer
E-YSL External yolk syncytial layer
GFP Green fluorescent protein
h Hours
HEPES 4-(2-hydroxyethyl)-1-piperazineethanesulfonic acid
hpf Hours post-fertilization
IgG Immnoglobulin G
I-YSL Internal yolk syncytial layer
kDa kilo Dalton; protein weight
LMP Low melting point agarose
min Minutes
mo Morpholino oligonucleotide
mRNA messenger RNA
MAB Maleic acid buffer
MW Molar weight
MTOC Microtubule organizing center
MZ Maternal and zygotic mutant
n Number
NA Numerical aperture
Abbreviations
NMJ Neuromuscular junction
p Probability value (Student’s t test)
PBS Phosphate buffered saline
PCP Planar cell polarity
PCR Polymerase chain reaction
PFA Paraformaldheyde
RNase Ribonuclease
SSC Sodium chloride solution supplemented with citrate
SDS Sodium dodecyl sulfate
TEM Transmission electron microscopy
UTR Untranslated region of messenger RNA
UV Ultraviolet light
YCL Yolk cytoplasmic layer
Introduction
1. Introduction
1.1 The zebrafish as a model system
Teleosts, such as the killifish (Fundulus heteroclitus), the medaka (Oryzias latipes) and the zebrafish (Danio rerio), have been used since the late 1800s for biological studies. More recently, the zebrafish embryo has come into focus to answer developmental and physiological questions. This was initiated mainly by George Streisinger and colleagues, who began genetic analysis in the zebrafish and established the methodological foundation allowing its use as a vertebrate model organism (Streisinger et al., 1981; Westerfield, 2000).
Indeed, the zebrafish embryo offers many advantages to study embryonic development compared to other organisms. It is very easy to handle; it develops externally and it is relatively large, which facilitates the execution of experimental manipulations such as microinjection and cell transplantations. Its transparency allows the use of live microscopy. In addition, the adult zebrafish can be readily bred, embryonic development takes place within only two days, and the fish are sexually mature after three months of development. Furthermore, following a particular light-dark cycle, adult female fish generate large, synchronized clutches of eggs.
Very importantly, the zebrafish is amenable to genetic analysis and has therefore been subject of two large-scale genetic screens that identified essential genes controlling a wide range of biological processes (Driever et al., 1996; Haffter et al., 1996). The vast and rapid expansion of new tools and resources in the last decades has also motivated the increasing use of zebrafish to study cell biology in vivo. Important advances include the analysis of gene expression and protein localization in the live embryo with fluorescently tagged proteins and transgenes, and the use of confocal time-lapse microscopy (Amsterdam et al., 1995; Cooper et al., 1999; Peters et al., 1995).
Introduction
1.2 Overview of zebrafish development
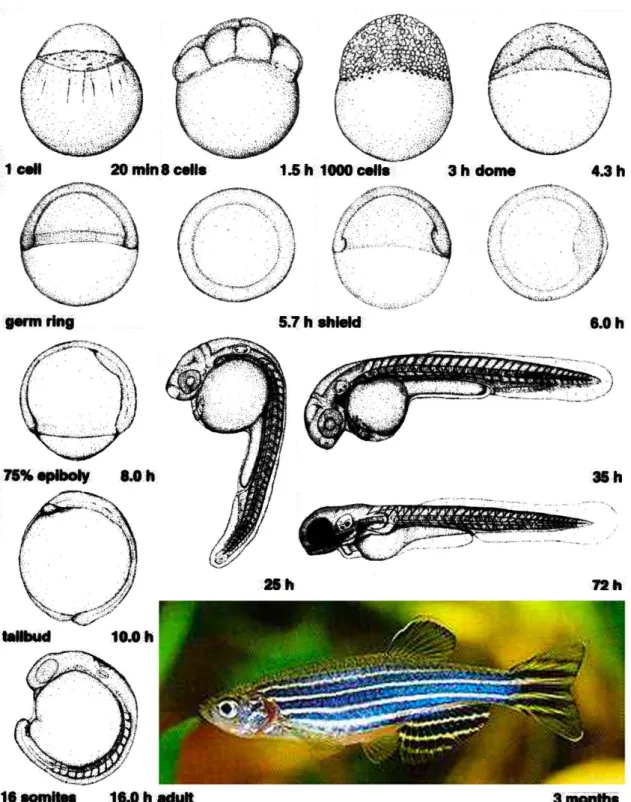
The zebrafish embryo develops in a typical teleost manner and morphological aspects of its development, as well as defined stages, have already been described in detail (Kimmel et al., 1995; see Fig. 1.1). Still, we will briefly describe the main features of the early zebrafish embryonic development.
When the teleolecithal eggs are laid, yolk and cytoplasm are mixed and the zygote is surrounded by a transparent chorion. External fertilization occurs by the entrance of the sperm into the oocyte at the future animal pole side. At this stage (“one-cell stage”), contractile forces cause yolk-free cytoplasm to accumulate at the animal pole of the zygote, segregating it from the large yolk mass. About 30 minutes after fertilization, the blastodisc has formed at the animal pole, while a big yolk mass constitutes the vegetal portion of the egg. During early cleavage stages, the zygote starts to divide in a discoidal-meroblastic manner, with marginal vegetal blastomeres maintaining large cytoplasmic bridges with the yolk cell (Kimmel and Law, 1985a; Wilson, 1889). Cell divisions at this stage are rapid and synchronous.
Introduction
Introduction
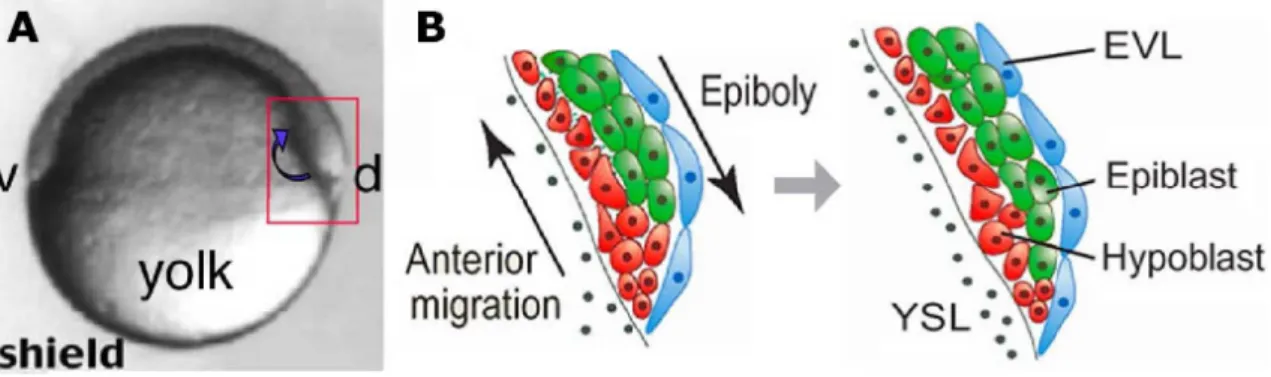
At late blastula stages, the first cellular rearrangements begin to reshape the blastoderm into a characteristic vertebrate body plan. In the process of epiboly, radial cell intercalation leads to the thinning of the blastoderm as it spreads over the entire yolk. The extent of yolk cell coverage (“percent epiboly”) provides a convenient measure of the embryo’s developmental stage. At 50% epiboly, additional morphogenetic cell movements start, hallmarking the onset of gastrulation. During gastrulation, a combination of patterning events and tissue movements specifies the three germs layers (ecto-, meso- and endoderm), and establish the embryonic body axes. The marginal-most DEL cells internalize and form the so-called “hypoblast”, which contains the precursors of mesoderm and endoderm, while the “epiblast layer” on the outside of the embryo will give rise to the ectoderm. At the same time, lateral and ventral cells converge to the prospective dorsal side of the embryo, leading to the formation of a localized thickening termed “embryonic shield”. The shield is the functional equivalent to the dorsal blastopore lip of amphibians and the node in mammals and birds, since it can organize a secondary embryonic axis when transplanted into a host embryo (Ho, 1992; Oppenheimer, 1936). In addition to convergence movements along the dorsal-ventral axis, extension occurs along the anterior-posterior axis, and acts in concert with epiboly to elongate the embryo. At the end of gastrulation, the yolk is completely covered by the blastoderm and dorsal-ventral and anterior-posterior axes are established.
Introduction
1.3 The YSL
1.3.1 Formation of the YSL
A unique and fascinating feature of early teleost development is the formation of a syncytium at the surface of the yolk cell during cleavage stages. This syncytium, originally known as “periblast”, is now called “yolk syncytial layer” (YSL; Betchaku and Trinkaus, 1978). The formation of the YSL was first discovered by Agassiz and Whitman (1884) in Ctenolabrus and described in more detail by Wilson (1889) in
Serranus. More recently, its has been carefully studied in Fundulus heteroclitus
(Trinkaus, 1993) and in zebrafish (Kimmel and Law, 1985b).
During late cleavage stages, the cytoplasm of some marginal blastomeres is confluent with the yolk cell cytoplasm, as a result of the incomplete, meroblastic, pattern of cleavage typical of teleosts. These cytoplasmic bridges have already been pointed out by Wilson (1889), and were later confirmed by electron microscopy in
Introduction
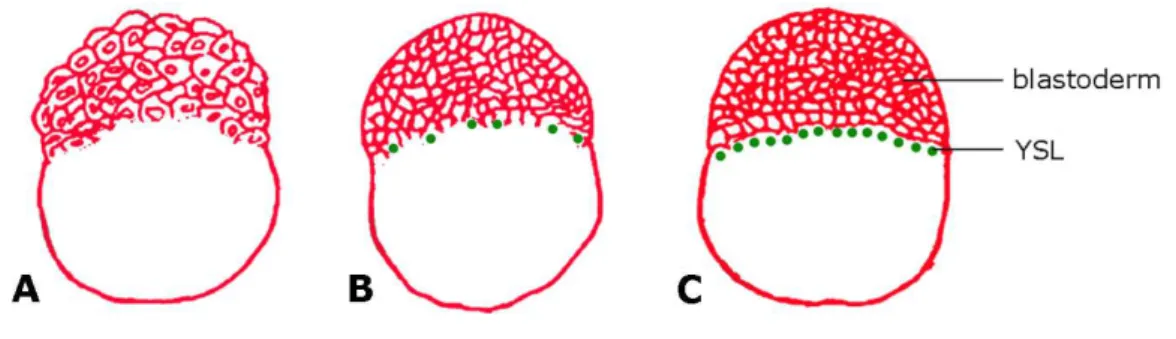
Figure 1.2 – Formation of the YSL. (A) 216-cell stage. The blastodisc has the form of a half ball sitting on top of the yolk cell. At this stage, blastomeres are still connected to the yolk by cytoplasmic bridges. (B) 512-cell stage, the beginning of the midblastula transition. Upon entering the tenth mitosis, marginal blastomeres begin to lose their lower borders where they join the yolk cell. This event marks the beginning of YSL formation. (C) High stage. The blastoderm has lost its cytoplasmic connections to the yolk cell and the YSL forms a thin ring at the margin. Adapted from Zalik et al., 1999.
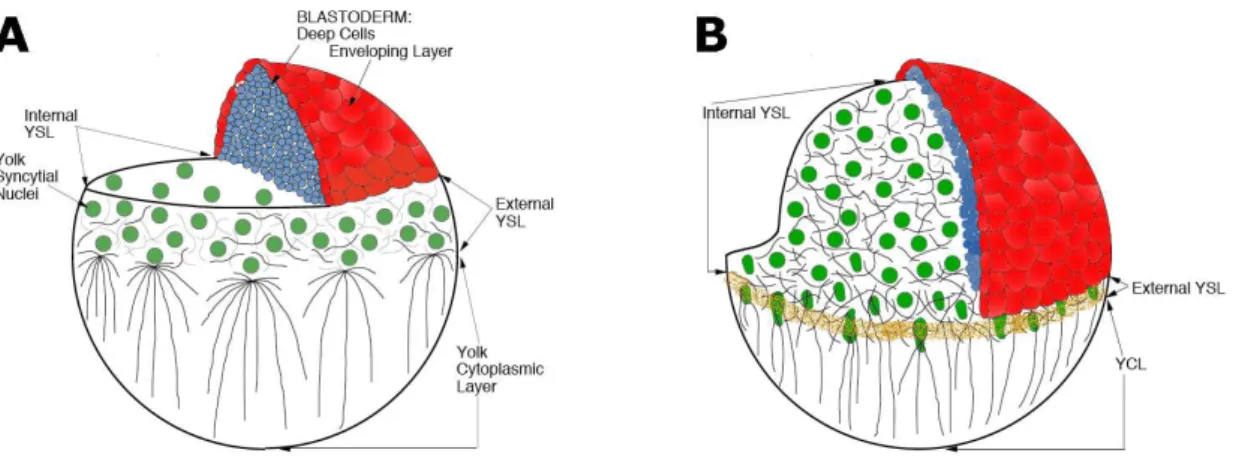
After the YSL is formed, its nuclei typically divide three to five more times without cytokinesis and in a metachronous manner (Kane et al., 1992; Kimmel et al., 1995; Trinkaus, 1993). When epiboly starts, the nuclei become strictly post-mitotic and increase in size, which may indicate that they are actively transcribing RNA. Indeed, it has been suggested that the YSL nuclei possess high transcriptional activity, as based on elevated transgene activities in this compartment of the embryo (Williams et al., 1996). During the nuclear divisions, nuclei spread underneath the blastoderm, forming the so-called “internal YSL” (I-YSL) already visible at sphere stage (D’Amico and Cooper, 2001). Nuclei remaining at the margin become part of the “external YSL” (E-YSL; Trinkaus, 1993).
An interesting aspect of YSL formation is its variability. As mentioned before, both the lineage and number of blastomeres that contribute to the YSL vary significantly between embryos, as does timing of YSL formation. This leads to a considerable variation in the total number of nuclei in the definitive YSL. Yet, this variation does not seem to interfere with the development of the embryo, suggesting that the precise mode of YSL formation is not crucial (Kimmel and Law, 1985b; Trinkaus, 1993).
1.3.2 YSL functions during development
Introduction
yolk material and for transfer of nutrients to the embryonic blastoderm and larval tissues (Lentz and Trinkaus, 1967; Mani-Ponset et al., 1996; Sire et al., 1994; Trinkaus and Drake, 1956; Van der Ghinst, 1935; Walzer and Schönenberger, 1979). In zebrafish, a more recent study has demonstrated that Ferroportin1, a vertebrate-conserved transmembrane iron exporter, is specifically expressed in the YSL and plays a crucial role in the transport of iron from the yolk to the embryo (Donovan et al., 2000).
The YSL has also a role in regulating the migration of the heart precursor cells to the midline of the embryo. A recent study has shown that the homeobox transcription factor mtx1, which is expressed exclusively in the YSL during gastrulation, regulates fibronectin expression in the embryonic tissue. Fibronectin expression is then necessary for the assembly of a proper extracellular matrix, which is used by the heart precursor cells as a substrate for migration (Sakaguchi et al., 2006).
Furthermore, the YSL serves critical inductive and patterning functions (illustrated in Fig. 1.3). Transplantation experiments support the idea that the dorsal YSL in teleosts is equivalent to the amphibian Nieuwkoop center present in the dorsovegetal region of the endoderm, and is responsible for the induction of the Spemann-Mangold organizer (Mizuno et al., 1999). When an isolated yolk cell was transplanted onto the animal pole of a host embryo, it induced the expression of dorsal specific genes such as goosecoid
(gsc) in the surrounding cells. In addition, the dharma/bozozok gene, a transcription factor necessary for the organizer function, is expressed in the dorsal YSL before gastrulation (Koos and Ho, 1998; Yamanaka et al., 1998). dharma mutants can be rescued by injection of dharma mRNA into the YSL, showing that YSL expression of this gene is sufficient to induce the organizer (Fekany et al., 1999). However, the dorsal blastoderm can also autonomously develop dorsal fates, since abolishing all endogenous mRNA activity in the YSL via injection of RNase does not inhibit dharma or gsc
Introduction
Furthermore, similar yolk cell transplantation experiments have demonstrated that the YSL can induce mesoderm and endoderm in the surrounding blastomeres, as evidenced by the ectopic expression of mesodermal (no tail) and endodermal (gata5) in host embryos (Mizuno et al., 1996; Mizuno et al., 1999; Ober and Schulte-Merker, 1999; Rodaway et al., 1999). As in the case of the organizer function, the requirement of the YSL for mesodermal and endodermal induction was also analyzed by RNase treatment of the YSL. Interestingly, RNase injected embryos do not develop ventrolateral mesoderm and endoderm, while dorsal regions are unaffected (Chen and Kimelman, 2000). This indicates that the YSL is necessary and sufficient to induce at least ventrolateral mesoderm and endoderm in zebrafish.
Another interesting aspect of YSL function involves the homeobox gene hhex, which is expressed in the dorsal half of the YSL during gastrulation (Bischof and Driever, 2004; Ho et al., 1999; Liao et al., 2000). Over-expression experiments have demonstrated that Hhex antagonizes ventralizing and posteriorizing factors such as Bmp2b and Wnt8 in the overlying blastoderm (Ho et al., 1999). Homologues of hhex in mouse and Xenopus are expressed in tissues responsible for organizing anterior structures, namely the anterior visceral endoderm (AVE) and anterior endomesoderm (Jones et al., 1999; Thomas et al., 1998). Since the mouse AVE and the amphibian anterior endomesoderm express homologous genes and are both implicated in head and heart induction, it has been proposed that they are functionally equivalent structures (Beddington and Robertson, 1998; Bouwmeester and Leyns, 1997; Jones et al., 1999; Martinez-Barbera et al., 2000). Following this rationale, the dorsal YSL of the zebrafish gastrula has been proposed to be the teleost equivalent of the mouse AVE (Beddington and Robertson, 1998; Bouwmeester and Leyns, 1997; Ho et al., 1999; Viebahn, 1999), and might thus be important for inducing and/or patterning anterior neural tissues.
Introduction
In addition, the E-YSL has been suggested to be essential for epibolic movement of the blastoderm (Chen and Kimelman, 2000; Cheng et al., 2004; Solnica-Krezel and Driever, 1994; Strähle and Jesuthasan, 1993; Trinkaus, 1951). This will be discussed in more detail in section 1.4.1 of this Introduction.
1.4 Gastrulation movements
Gastrulation entails a set of morphogenetic processes that create the internal organization and the external shape of developing animals (Leptin, 2005; Solnica-Krezel. 2005). In the course of gastrulation, the precursors of the three germ layers are repositioned from the surface of the blastula, placing the mesoderm between the internal endoderm and the superficial ectoderm. Moreover, the embryo is molded into a body rudiment with anteroposterior and dorsoventral asymmetries. Vertebrate gastrulation involves four evolutionarily conserved types of morphogenetic movements (Fig. 1.4): “epiboly”, which leads to spreading and typically thinning of the tissue; “internalization”, which occurs at the blastopore and directs mesendodermal precursor cells from the blastula surface to the interior, while prospective ectoderm remains on the exterior of the embryo; “convergence”, which narrows embryonic tissues mediolateraly; and “extension”, which elongates the them anteroposteriorly. These movements require a variety of cellular behaviors, such as directed cell migration, intercalation and cell shape changes. These morphogenetic movements will be discussed in detail in this section.
Introduction
1.4.1 Epiboly
Epiboly is the first morphogenetic movement occurring in the embryo, characterized by the spreading of the blastoderm and YSL over the yolk cell. This process is analogous to that of many organisms that produce teleolecithal eggs, where smaller animal pole-derived cells internalize large, vegetally pole-derived yolky cells (Kane and Adams, 2002; Solnica-Krezel, 2005).
Description of epiboly movements
Epiboly begins at late-blastula stage and completes at tailbud stage, when the entire yolk cell is engulfed by the blastoderm. Before the beginning of these morphogenetic movements, the blastoderm sits on top of a spherical yolk cell as a mound of cells of about six to eight cells thick. At dome stage the blastodisc thins considerably by radial intercalation of cells (Kimmel and Warga, 1987; Warga and Kimmel, 1990; Wilson et al., 1993; Wilson et al., 1995; Fig. 1.5), and at the same time, the yolk cell bulges or “domes” toward the animal pole. Subsequently, EVL, YSL, and deep cells begin to move toward the vegetal pole until the yolk cell is entirely covered.
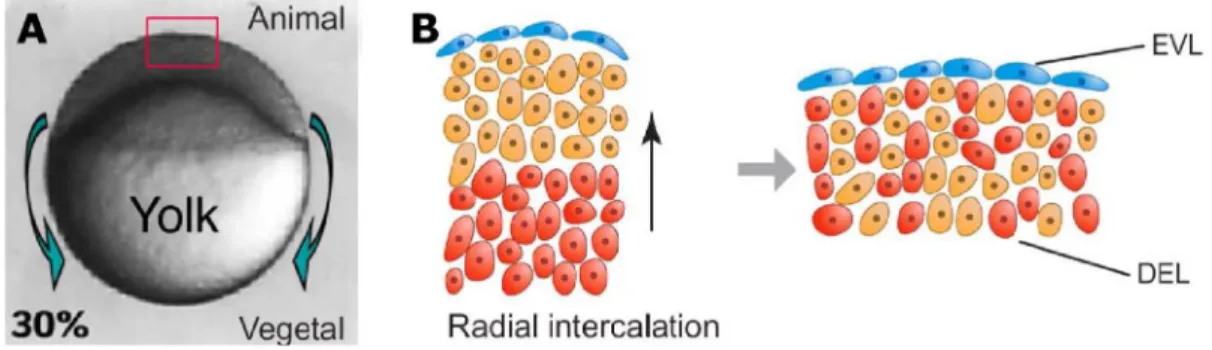
Figure 1.5 – Epiboly movements in the zebrafish embryo. (A) Lateral view of an embryo at 30% epiboly (5 hpf). Epiboly movements are defined by the spreading of the blastoderm over the yolk cell toward the vegetal pole (green arrows). These movements continue until the entire yolk cell is covered by the blastoderm. The red box outlines the embryonic region at the animal pole schematized in (B). (B) Schematic representation of radial intercalation movements. Deepest cells (red) intercalate among more superficial cells (orange). These movements contribute to the flattening of the tissue during epiboly. EVL, Enveloping layer; DEL, deep cell layer. Animal pole is on top; vegetal pole is at the bottom. Adapted from Montero and Heisenberg (2004).
Introduction
Philip Trinkaus has shown that epiboly of the YSL is completely autonomous and independent of the EVL and DEL. Surprisingly, when the blastoderm of an embryo was removed before the onset of epiboly, the YSL proceeded normally towards the vegetal pole; indeed, the first phase of YSL epiboly was even faster than in a normal embryo, suggesting that EVL and/or DEL actually inhibit the onset of YSL epiboly (Trinkaus, 1951; Trinkaus, 1984). Moreover, it has been demonstrated that tight junctions develop between the E-YSL and the EVL (Betchaku and Trinkaus, 1978) and suggested that epiboly starts when the E-YSL contracts and narrows, pulling the I-YSL and the attached EVL vegetally (Trinkaus, 1984). Endocytosis might also be part of the epiboly motor. YSL plasma membrane is endocytosed near the advancing margin of the blastoderm, leading to the disappearance of the YCL (Betchaku and Trinkaus, 1978; Betchaku and Trinkaus, 1986; Trinkaus, 1984). Localized endocytosis at the margin of the E-YSL has also been observed in zebrafish (Solnica-Krezel and Driever, 1994). To account for I-YSL expansion, Betchaku and Trinkaus (1978) have postulated that it comes from the membrane of the numerous, long microvilli present in the I-YSL at the onset of epiboly, which gradually disappear. Furthermore, the EVL undergoes active cell rearrangements during epiboly. Some of the leading edge cells leave the margin and intercalate amongst more animal cells, and other cells constrict while others become wider (Keller and Trinkaus, 1987; Köppen et al., 2006; Zalik et al., 1999). This indicates that the EVL is not a totally passive component of epiboly.
Role of the cytoskeleton in epiboly movements
Introduction
tissues of the embryo, the role of microtubules in the YSL has not been specifically addressed. However, a recent study has shown that a high level of polymerized microtubules in the YSL is essential for proper epiboly movements. Specifically blocking the function of the steroidogenic enzyme Cyp11a1 in the YSL, which catalyzes the conversion of colesterol to pregnenolone, decreases the level of polymerized microtubules in the YSL and consequently blocks epiboly movements without affecting early embryonic patterning (Hsu et al., 2006).
In addition to microtubules, the actin cytoskeleton likely serves a critical function during zebrafish epiboly movements (Cheng et al., 2004; Köppen et al., 2006; Zalik et al., 1999). These studies show that the leading edge of the E-YSL contains a punctate band of actin and myosin (Fig. 1.6), which might function as a contractile ring that pulls the YSL, and consequently EVL and DEL, towards the vegetal pole, as proposed for
Fundulus (Trinkaus, 1984).
Introduction
Role of E-cadherin in epiboly
To date, no experiment has demonstrated the role of the DEL in epiboly. At the onset of epiboly movements, the deep cells undergo considerable cell mixing, which can be explained as driven both by the doming of the yolk or by intrinsic behaviors of the cells (Wilson et al., 1995). Despite this, mutants for zebrafish e-cadherin ( cadherin1/half-baked, cdh1/hab), as well as morpholino antisense inhibition of cdh1 translation, demonstrate that at least some aspects of epiboly of the deep cells are under a separate genetic control from the EVL and YSL (Babb and Marrs, 2004; Kane et al., 1996; Kane et al., 2005; McFarland et al., 2005; Montero et al., 2005; Shimizu et al., 2005). These mutants/morphants show an arrest in epiboly movement of the DEL at about 70%-80% epiboly, while EVL and YSL are unaffected.
More careful analysis of cdh1/hab mutants has revealed that radial intercalation of epiblast cells is impaired, suggesting that these cell movements are important for epiboly of the DEL (Kane et al., 2005). Electron microscopy analysis of mutants for the
cdh1/habrk3 allele show adhesion defects between deep cells and EVL, which is indicative of a role of EVL/DEL adhesion in epiboly (Shimizu et al., 2005).
Another interesting aspect is that impairment of E-cadherin function does not seem to significantly affect the actin bands present at the leading edge of the epibolizing EVL and DEL, indicating that the function of E-cadherin in epiboly might be independent of these structures (Köppen et al., 2006; Shimizu et al., 2005).
Transcriptional and translational control of epiboly
A number of transcription factors are also involved in epiboly. The T-box
eomesodermin (eomes) and the homeobox mtx2 transcription factors are some of the already characterized genes. Eomes function is necessary from the early stages of epiboly, at least partially by promoting the expression of the mtx2 gene, which is only expressed in the YSL (Bruce et al., 2005; Hirato et al., 2000). Epibolic movements are also reduced in maternal-zygotic spiel ohne grenzen (spg)/pou5f1 mutants (Reim et al., 2004; Reim and Brand, 2006). In contrast to Eomes and Mtx2 loss-of-function,
Introduction
spg/pou5f1 mutants do not show any effect on cdh1 transcription, and thus it is not clear by which mechanism this transcription factor regulates epiboly (Reim and Brand, 2006). A recent study has shown that embryos deficient in maternal and zygotic function of the Dicer enzyme, which produces microRNAs, exhibit slow epiboly with respect to mesendodermal cell internalization (Giraldez et al., 2005). This suggests that regulation of translation is required for normal epiboly.
Further insight into the molecular control of epiboly awaits the molecular analysis of recently isolated maternal-effect mutants showing epiboly defects (Wagner et al., 2004).
1.4.2 Hypoblast formation and migration
When epiboly has progressed to cover about 50% of the yolk cell, the first mesendodermal progenitors are induced at the margin of the blastoderm, forming a thickening around the circumference of the blastoderm, known as the “germ ring” (Warga and Kimmel, 1990). Germ ring formation starts when cells close to the margin of the blastoderm slow down their epibolic movement. These cells then move as a continuous stream over the margin towards the yolk cell and become the hypoblast layer. This shares similarities with the involution movement of the mesodermal and endodermal germ layers at the onset of Xenopus gastrulation (for a review see Winklbauer et al., 1996). Simultaneously, convergence of blastodermal cells leads to a compaction of cells at the dorsal side of the germ ring, where the embryonic organizer (the “shield”) forms (Fig. 1.7).
Introduction
margin, suggesting that ingression of hypoblast cells is restricted to the marginal region of the germ ring. Further evidence supporting this model comes from transplantation experiments, revealing that single hypoblast cells transplanted into mutant embryos that do not form hypoblast (maternal-zygotic one-eyed pinhead mutants) ingress in a cell-autonomous manner (Carmany-Rampey and Schier, 2001).
In conclusion, it seems that hypoblast cells ingress as single cells in a locally coordinated way, which might give the impression of a flow of cells, the previously alleged involution-like movement (Fig. 1.7B). It has thus been proposed that we call this internalization process by “synchronized ingression” (Solnica-Krezel, 2006).
Figure 1.7 – Internalization and anterior migration of mesendodermal progenitor cells at the onset of gastrulation. (A)Lateral view of an embryo at shield stage (6 hpf). Animal pole is on top; vegetal pole at the bottom; ventral (v) to the left; and dorsal (d) to the right. Internalization of hypoblast cells occurs at the germ ring margin by synchronized ingression (blue arrow). The red box outlines the dorsal marginal region schematized in (B). (B) Schematic representation of internalization and anterior migration of hypoblast cells at the dorsal margin. Ingressing hypoblast cells (red) move toward the animal pole by active migration, forming the hypoblast layer. Overlying epiblast cells (green) do not internalize and continue epiboly movement toward the vegetal pole. EVL, enveloping layer; YSL, yolk syncytial layer. Adapted from Montero and Heisenberg (2004).
1.4.3 Convergence and extension
Introduction
Different modes of convergence and extension movements have been observed in various organisms. In the frog gastrula, convergence and extension are simultaneous and interdependent processes, thus leading to the use of the term “convergent extension”. However, in the zebrafish gastrula, convergence can lead to tissue thickening without extension. Alternatively, a tissue might extend and at the same time decrease its thickness (Solnica-Krezel and Cooper, 2002). In zebrafish, convergence and extension seem to be genetically separable processes (Myers et al., 2000b). For example, in no tail and somitabun mutants, in which convergence is impaired, extension continues relatively normally (Glickman et al., 2003).
Distinct domains of convergence and extension
In the zebrafish, the majority of convergence and extension movements occur at gastrula stages and in all the three germ layers of the embryo (Myers et al., 2002a; Myers et al., 2002b; Warga and Nüsslein-Volhard, 1999). However, these movements differ according to the observed germ layer. In the dorsal region, extension of mesendoderm exceeds that of ectoderm and, eventually, most of the mesendodermal cells gather dorsally, leaving a zone depleted of cells in the ventral region. In contrast, convergence and extension of prospective neuroectoderm is accompanied by mediolateral expansion of non-neural ectoderm, which in the end occupies the ventral side of the gastrula (Concha and Adams, 1998; Woo and Fraser, 1995). Another aspect that varies is the cellular organization. Prospective ectodermal cells migrate as a sheet at the beginning of gastrulation, forming pronounced cell-cell contacts (Concha and Adams, 1998). On the contrary, mesodermal cells move individually or as small groups, while endodermal cells move exclusively as individuals (Trinkaus et al., 1992; Warga and Nüsslein-Volhard, 1999).
Introduction
1992; Trinkaus, 1998). More dorsally, both hypoblast and epiblast undergo strong extension movements and only limited convergence. In lateral regions, cells initially converge and extend slowly, but the speed increases as they approach the dorsal side. On the other hand, convergence and extension of mesodermal cells is almost absent in the ventral side (Sepich et al., 2000).
Figure 1.8 - Cell movement trajectories in ventral, lateral and dorsal convergence and extension (C&E) domains. (a) Cells in the ventral side of the embryo show zig-zaging movements towards the future tailbud, with no net dorsal speed. (b) Lateral cells far away from the dorsal side undergo slow C&E and meander significantly with slow net dorsal speed. (c) Lateral cells closer to the dorsal side undergo fast C&E, displaying straighter trajectories. (d) The paths of dorsal cells are oriented dorsally and biased towards anterior or posterior, depending on their position along the animal-vegetal axis. Their net dorsal speed is reduced compared to lateral cells participating in fast C&E movements. Scale bar, 100 µm. D, dorsal; V, ventral. Adapted from Myers et al. (2002b).
Migration of prechordal plate mesoderm cells
As outlined above, dorsal hypoblast formation is initiated when prospective prechordal plate mesoderm cells (prospective head mesoderm) internalize at the dorsal germ ring margin by synchronized ingression. These cells then migrate as a cohesive group toward the animal pole using the epiblast as a substrate (Montero et al., 2005). Therefore, prechordal plate progenitor cells have to move in a highly dynamic manner to obtain some net movement in the opposite direction of the epiblast.
Introduction
In addition, anterior migration of prechordal plate progenitors is regulated by the non-canonical Wnt signaling (Ulrich et al., 2003; Ulrich et al., 2005). Wnt11 was shown to function non-autonomously in orienting filopodial-like protrusions and movement direction of hypoblast cells at the onset of gastrulation by regulating E-cadherin mediated-adhesion. Witzel and colleagues have recently proposed that Wnt11 locally functions at the plasma membrane by accumulating its receptor Frizzled 7 and the intracellular mediator Dishevelled, thereby modulating local cell contact persistence during gastrulation (Witzel et al., 2006).
Despite these insights into the coordination of prechordal plate movement, it remains a mystery what determines the global direction of this tissue in the embryo. One of the hypotheses is that attractive guidance cues are involved, since the behavior of these cells resembles chemotatic cell movements. Supporting this notion, activation of Stat3-dependent signaling on the dorsal side of the embryo is cell-autonomously required for anterior migration of these cells (Yamashita et al., 2002). This signaling pathway is typically activated in response to cytokines and growth factors (Kisseleva et al., 2002). Alternatively, anterior migration could be a more passive process, generated by continuous ingression of cells at the germ ring margin. Evidence that a community effect directs anterior migration of mesendodermal cells resulted from the transplantation of single wild type cells into the margin of maternal-zygotic one-eyed pinhead embryos (which essentially lack all mesendodermal cells): while able to internalize, the single cells failed to move to the animal pole as in normal wild-type embryos (Carmany-Rampey and Schier, 2001).
Mediolateral cell intercalation in axial mesodermal cells
Introduction
(Concha and Adams, 1998). However, it has recently been shown that mutants for the T-box gene no tail have defects in convergence and mediolateral intercalation but not in extension of axial mesodermal cells (Glickman et al., 2003). These observations suggested that besides mediolateral intercalation, epiboly movements are also important for the extension of the notochord.
Figure 1.9 – Scheme of mediolateral intercalation of axial cells at late stages of of gastrulation. Convergence and extension movements of axial cells are mainly driven by mediolateral intercalation, where bipolar protrusive activity of mediolaterally-elongated cells results in their intercalation between their medial (dorsal) and lateral neighbors. Adapted from Myers et al., 2002b.
Migration of lateral mesendodermal cells
Introduction
Convergence and extension movements of nuclei within the YSL
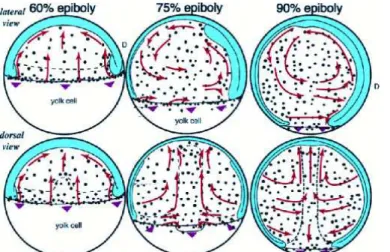
A study by D’Amico and Cooper (2001) has recently revealed that besides the three germ layers, the extra-embryonic YSL nuclei also undergo long-range convergence and extension movements during gastrulation and early segmentation (Fig. 1.10). Already at the onset of gastrulation, two spatially distinct domains of YSL nuclei with different morphogenetic behaviors become apparent. Nuclei located more animally start to move to the animal pole, while nuclei underneath the margin move to the vegetal pole. At mid-gastrulation, I-YSL nuclei from ventral and lateral regions of the gastrula start to converge to the dorsal side and then extend along the animal-vegetal axis. Nuclei underlying the dorsal midline at the beginning of gastrulation undergo extension movements, either toward the animal or vegetal pole, depending on their latitudinal positions. At the same time, I-YSL nuclei located close to the animal pole become displaced and move ventrally and laterally. Altogether, these movements generate a swirling flow pattern within the YSL. These patterns globally resemble those of the morphogenetic movements undertaken by the overlying hypoblast cells (D’Amico and Cooper, 2001; Solnica-Krezel and Cooper; 2002).
Figure 1.10 - Detailed diagram of YSL nuclei movement during gastrulation. Lateral and dorsal views are shown, from the onset of gastrulation (60% epiboly) until late mid-gastrulation (90% epiboly). Arrows summarize the regional trajectories of YSL nuclei. Dotted lines denote the location of the axial hypoblast and germ ring. Arrowheads represent epibolic progression. Nuclei start converging toward the dorsal midline (D) during mid-gastrulation (75% epiboly). Concurrently, nuclei located in the axial YSL domain extend along the anterior-posterior axis. As the axial YSL domain extends toward the animal pole, it displaces anteriorly located nuclei toward more ventral and lateral positions underlying the future hatching gland and forebrain. Adapted from D’Amico and Cooper (2001).
Introduction
Volhard, 1999). However, no direct evidence for this model was provided.
Molecular control of convergence and extension
Several signaling pathways have been implicated in the regulation of convergence and extension movements in the zebrafish, such as Eph-ephrin, Slit, calcium, Prostaglandin and cell adhesion molecules (for reviews see Krezel and Cooper, 2002; Solnica-Krezel, 2006). However, non-canonical Wnt signaling is clearly the major mediator of convergence and extension movements in zebrafish as well as in Xenopus (Kuhl, 2002; Tada et al., 2002). This pathway shares many components with the planar cell polarity (PCP) pathway in Drosophila, which regulates cell polarity in an epithelium (for reviews see Adler and Lee, 2001; Seifert and Mlozik, 2007), although in vertebrates it features members not identified on flies, such as the ligands Wnt11 and Wnt5 (Heisenberg et al., 2000; Kilian et al., 2003; Rauch et al., 1997). In both frogs and zebrafish, reduction as well as over-expression of Wnt11 and Wnt5 disrupts convergence and extension typically resulting in a shorter and broader body axis. This indicates that a balance of Wnt signaling is necessary for normal gastrulation movements (Heisenberg et al., 2000; Makita et al., 1998; Moon et al., 1993; Rauch et al., 1997). Other components of this signaling pathway critical for gastrulation movements include the intracellular mediator Dishevelled, the transmembrane protein Strabismus/Vang-like2, the Formin-homology protein Daam1, the small GTPase RhoA, the Rho kinase Rok2, the glypican Knypek, and several others (for more detailed reviews see Myers et al., 2002b; Tada et al., 2002).
Introduction
catenin activation (Yamashita et al., 2002), and upstream or parallel to the Wnt/PCP pathway (Miyagi et al., 2004), supporting the idea that control of cell movement occurs in parallel to cell specification.
In Drosophila, cell polarity is characterized by the asymmetric distribution of PCP components and by cytoskeletal remodeling. In vertebrates, the mechanisms by which Wnt/PCP pathway polarizes cells and promotes convergence and extension movements at the cellular level have only started to be unraveled. So far, the known localization of a few PCP factors indicates that the molecular mechanisms might be more complex in the vertebrate case than for the better characterized Drosophila PCP pathway, hence further studies are required to clarify this question (for a review see Seifert and Mlodzik, 2007).
1.5 Aims and approaches of this thesis
The central aim of this thesis was to understand whether and how YSL nuclei interact with the overlying blastoderm during gastrulation movements in the zebrafish embryo. Our major focus was to study the proposed interaction between the nuclei of the I-YSL and the overlying hypoblast cell layer during their analogous convergence and extension movements, which has not been directly addressed in previous studies. In parallel, we tried to clarify some aspects related to the epiboly movement of E-YSL nuclei and blastoderm.
To gain insight into the internal structure of the YSL syncytium, we started by analyzing its subcellular organization, specially focusing on the microtubule cytoskeleton, by transmission electron microscopy and single-photon confocal microscopy
Introduction
Nomarski interference optics.
To study the influence of the I-YSL nuclei on blastoderm movement, we interfered with the YSL microtubule cytoskeleton. Conversely, to understand how the blastoderm affects I-YSL nuclei movement, we analyzed different mutants that do not develop a proper hypoblast cell layer.
Materials and Methods
2. Materials and methods
2.1 Materials
2.1.1 Technical equipment
Ball-joint-holder WPI
Glass capillaries: Harward GC100F-15 (injection); Harward GC120-10 (transplantation)
Magnet holder: MB-B (Kanetec)
Microbeveler 48000 (WPI)
Microinjectors: PV820 and Pico-Pump with foot pedal (WPI) Micromanipulators: Narishige MN-151; Narishige MO-155
(transplantation)
Needle puller Flaming/Brown P87 Sutter
Pipette holders: MN-151 (injection); MPH3 (transplantation) Glass rings: MNK-145-030K (Fisher Scientific)
Microtome: Ultracut microtome (Leica)
Vibratome Leica VT1000S
Stereomicroscopes: Leica MZ 125 Olympus SZX12 DIC Microscope: Zeiss Axioplan 2 Confocal microscopes: Leica TCS-SP2
Biorad Radiance 2000 with Nikon Eclipse TE300 microscope
Electron microscope: Morgagni (FEI, Eindhoven)
2.1.2 Chemicals
Materials and Methods
2.1.3 Reagents and buffers
E3 medium: 5 mM NaCl, 0.17 mM KCl, 0.33 mM CaCl2 x 2 H2O, 0.33 mM MgSO4 x 7 H2O, 0.2‰ methylene blue, pH 6.5
Danieau’s buffer 58 mM, 0.7 mM KCl, 0.4 mM MgSO4, 0.6 mM Ca(NO3)2, 5 mM HEPES, pH 7.6
Penicillin and streptomycin: 10000 units penicillin/ml and 10000 µg/ml streptomycin (Invitrogen)
Mounting medium: 1% (m/v) LMP agarose (Invitrogen) in E3 medium Hybridization solution (Hyb+): 50% deionized formamide, 5x SSC, 0.1% Tween-20, 0.5 mg/ml torula (yeast) RNA, 50 µg/ml heparin, pH 6.0 (adjusted by adding 92 µl 1M citric acid per 10 ml Hyb+)
MABT: 150 mM NaCl, 100 mM maleic acid, pH 7.5 SSC (20x): 300 mM NaCl, 300 mM Na-Citrate, pH 7.0
PBS: 1.7 mM KH2PO4; 5.2 mM Na2HPO4; 150 mM NaCl
PBST: PBS, 0.1% Tween-20
PBSTT: PBS, 0.1% Tween-20, 0.1% Triton X-100
PFA 4%: 4% (w/v) paraformaldehyde, 81 mM Na2HPO4 19 mM, NaH2PO4
Bodipy ceramide Bodipy® FL C5-ceramide, stock at 1mM in DMSO (D3521, Invitrogen)
ER tracker ER-trackerTM Blue-White DPX dye, stock at 1mM in DMSO (D12353, Invitrogen)
Histone: Histone H1 Alexa Fluor® 488 conjugate; Stock at 10 mg/ml (H13188, Invitrogen)
Mini-ruby Dextran, tetramethylrhodamine and biotin, 10000 MW, lysine fixable, stock at 50 mg/ml (D3312, Invitrogen)
Materials and Methods
2.1.4 Molecular biological reagents
All restriction enzymes used were purchased from New England Biolabs. DNA and RNA ladders were purchased from MBI-Fermentas.
2.1.5 Molecular biological kits used
Name Company Application
BD advantage PCR kit Clontech PCR amplification of DNA
DIG labeling kit Roche Synthesis of in situ hybridization probes Gel extraction kit Qiagen Purification of DNA from agarose gels Message Machine kit Ambion Synthesis of mRNA for injection
Mini/Midi-prep Kit Qiagen small/big scale purification of plasmid DNA from bacteria cultures
PCR purification kit Qiagen purification of PCR and digestion products TOPO-Cloning Kit Invitrogen Sub-cloning of DNA fragments
Vectastain Elite ABC Kit
Vector
Laboratories Detection of biotin in fixed embryos
2.1.6 Plasmids and constructs
Materials and Methods
Antisense riboprobes:
Name Vector backbone Source/Reference
cathepsin L,1b (ctsl1b/ hgg1) pBluescript SK+ Thisse et al., 1994
chordin (chd) pCR2.1 M. Hammerschmidt, MPI-Freiburg
distal-less 3 (dlx3) pBluescript SK+ Akimenko et al., 1994
forkhead box A2 (fkdA2) pBluescript SK+ Strähle et al., 1993
hhex pCS2+ Ho et al., 1999
nkx2.5 pBluescript SK+ Chen et al., 1997
no tail (ntl) pBluescript SK+ Schulte-Merker et al., 1994
one-eyed pinhead (oep) pBluescript SK+ Zhang et al., 1998
sox17 pCRII M. Rhinn, MPI-CBG Dresden
mRNA for injection:
Plasmid name Gene Vector backbone Source
cyc cyclops (ndr2) pCS2+ Rebagliati et al., 1998
EB3-GFP end-binding protein 3 pCS2+ D. Gilmour, EMBL Heidelberg
GAP43-GFP gap43 (mammalian) pCS2+ Okada et al., 1999
oep one-eyed pinhead pSP64T F. Rosa, ENS Paris
tarA* Constitutive active form of taramA
pCS2+ Y. Kikuchi, Nagoya
University, Japan
Materials and Methods
2.1.7 Antibodies
Name Antigen Species Source Dilution
α-tubulin Hybridoma DM1A Mouse monoclonal
Sigma, T6199 1:500
γ-tubulin synthetic peptide, N-terminal region
human γ-tubulin
Rabbit
polyclonal
Sigma, T3559 1:10000
E-cadherin Zebrafish E-cadherin
peptide Rabbit polyclonal MPI-CBG antibody facility 1:200
Pan-cadherin C-terminus of
chicken N-cadherin
Rabbit
polyclonal
Sigma, C3678 1:1000
Alexa Fluor
568-conjugated
anti-mouse IgG
Mouse IgGs Goat
polyclonal
Invitrogen,
A11004
1:1000
Alexa Fluor
488-conjugated
anti-rabbit IgG
Rabbit IgGs Goat
polyclonal
Invitrogen,
A11008
1:1000
Alexa Fluor
546-conjugated
anti-rabbit IgG
Rabbit IgGs Goat
polyclonal Invitrogen, A11010 1:1000 Cy5-conjugated anti-rabbit IgG
Rabbit IgGs Goat
polyclonal
Jackson,
111-175-003
1:1000
2.1.8 Morpholino oligonucleotides
Morpholino oligonucleotides were used to specifically knock-down the translation of speficic mRNAs. All morpholinos used in this study were obtained from Gene Tools (USA) and used according the provided instructions. e-cadherin1/cadherin1 (cdh1) morpholino was described previously (Babb and Marrs, 2004), as well as wnt5/pipetail
Materials and Methods
Name Target site Sequence Injected
amount
cdh1-ATG From ATG
translational
start codon
5’-ATCCCACAGTTGTTACACAAGCCAT-3’ 4-16 ng
wnt5/ppt From ATG
translational
start codon
5’-GTCCTTGGTTCATTCTCACATCCAT-3’ 2 ng
2.2 Methods
2.2.1 Embryo staging and maintenance
Fish maintenance and embryo collection was carried out as described (Westerfield, 2000). Embryos were raised in E3 medium when kept inside their chorion or in Danieau’s buffer 1X with 0.5% of a mixture of penicillin and streptomycin after dechorionation. Embryos were kept at 31˚C and staged according to morphological criteria (Kimmel et al., 1995). Wild-type embryos were taken from TL (Tupfel long fin) and AB backgrounds. silberblick/wnt11tx226 (slb/wnt11tx226; Heisenberg et al., 1996), and half-baked/cadherin1tx230 (hab/cdh1tx230; Kane et al., 1996) carriers were maintained in a TL background, while maternal zygotic one-eyed pinhead (oepz1; Zhang et al., 1998) mutants were maintained in a WIK background. To reduce background variability, slb and hab mutants were only compared to wild-type TL embryos.
2.2.2 Injection of mRNA, morpholinos and dyes into embryos
Preparation of the injection needle
Materials and Methods
injection of a drop of approximately 0.5 nl by regulating the pulse duration of the pressure.
Injection into one-cell stage embryos
To prepare the mRNA dilution for injection, stock mRNA was thawed and diluted on ice using RNAse-free water. Morpholinos were incubated for 10 minutes at 65˚C to dissolve precipitations, followed by 5 minutes of centrifugation. Embryos were injected into the yolk just underneath the first cell through the chorion.
Injection into the YSL
Blastula stage embryos were dechorionated in 2 mg/ml of pronase for 10 minutes, washed and maintained in Danieau’s buffer 1X with 0.5% (v/v) of a mixture of penicillin and streptomycin, in 2% agarose-coated Petri dishes. For the injection procedure, a special agarose chamber containing vertical furrows was prepared as described (Westerfield, 1995). The embryos were aligned in the furrows and oriented in a lateral position. One or two drops with a volume of 0.5 nl were injected in the centre of the YSL by inserting the needle through the yolk, in embryos between high and sphere stage.
To label YSL nuclei, 1 mg/ml of Histone H1 conjugated to Alexa Fluor® 488 (Invitrogen) was injected into the YSL. Whenever morpholinos against chd1 were injected into the YSL, histone was mixed in the injection solution to give a final concentration of 1 mg/ml. To look at YSL microtubules and microtubule plus-ends, 100 pg of tau-GFP or 100 pg EB3-GFP mRNA respectively were injected into the YSL. In these cases, no histone was added to the solution. When fluorescent beads were used, histone was diluted in the solution containing the beads and 0.5 nl were injected into the YSL.
2.2.3 Cell transplantation
Preparation of the transplantation setup
Materials and Methods
angle to facilitate penetration into the embryo. The diameter of the tip was slightly larger than the size of a cell (approximately 60 µm). The needle was placed on a micropipette holder attached to a syringe with an airtight tube. The holder was mounted on a micromanipulator and by varying the air pressure with the syringe, cells could be sucked in and transferred from donor to host embryos. To immobilize the embryos, a special agarose chamber was used. The lid of a Petri dish was coated with 2% agarose and a plexiglass mould was used to create squared shaped depressions beveled on one side, where one embryo could fit.
For transplantation experiments, MZoep mutants were used as host embryos. To be able to later follow YSL nuclei movements in these embryos, histone was injected into the YSL at high stage (see above for detailed procedure). As donors of the cells to be transplanted, one-cell stage wild-type embryos were injected with a mixture of 100 pg of cyclops/ndr2 (cyc/ndr2) mRNA, 100 pg of GAP43-GFP mRNA and 5 mg/ml of dextran conjugated to tetramethylrhodamine and biotin (mini-ruby, Invitrogen). Cyc/ndr2 over-expression was used to induce mesendodermal cell fates ubiquitously;
GAP43-GFP was injected to label the plasma membrane, thus allowing the distinction between transplanted cells and YSL nuclei of the host embryo; mini-ruby was used as a lineage tracer to follow the transplanted cells in the host embryo with low magnification and for their detection after fixation. At high stage, both host and donor embryos were dechorionated with pronase and maintained in Danieau’s buffer with 0.5% (v/v) penicillin and streptomycin (see above). At sphere stage, the embryos were transferred into the depressions in a previously prepared agarose chamber. About 20-30 cells from a donor embryo were transferred into the blastoderm margin of a host MZoep embryo. After transplantation, the embryos were transferred to new agarose-coated Petri dishes and incubated at 31°C until the desired stage.
2.2.4 Implantation of polystyrene beads in the YSL
Materials and Methods
Beads were re-suspended in 0.1 µg/µl of bovine serum albumin to block unspecific binding.
For implantation of 20-µm beads, high stage wild-type embryos were dechorionated with pronase, injected with histone into the YSL and transferred to agarose-coated dishes with small depressions (same procedure as described for transplantation experiments). A few beads were pipeted onto the plate and a small hole was done close to the blastoderm margin of the embryo, with a tungsten needle. A bead was taken with the tip of a fine watchmaker forcep and pushed into the hole until reaching the YSL cytoplasm. The embryos were then transferred to a new agarose-coated dish and incubated at 31ºC until the stage desired for time-lapse imaging. To insert 0.5-µm fluorescent beads, a normal YSL injection procedure was performed (see above).
2.2.5 Incubation of embryos in bodipy ceramide and ER-tracker
To detect the Golgi apparatus and the endoplasmic reticulum (ER), embryos were incubated in specific vital dyes. For the Golgi, sphere stage embryos were incubated in medium containing 1% (v/v) Bodipy® FL C5-ceramide (Invitrogen) for one hour at 22ºC, followed by two hours in medium only at 31ºC. For the ER, sphere stage embryos were incubated in medium containing ER-trackerTM Blue-White DPX dye (Invitrogen) at 0.1% (v/v) for one hour at 31ºC followed by one hour in medium only, at 31ºC. For both experiments, embryos were mounted in 1% agarose and imaged by two-photon confocal microscopy.
2.2.6 Incubation of embryos in paclitaxel
Materials and Methods
2.2.7 Generation of plasmids for mRNA injections and antisense riboprobes
The cloning of DNA fragments was performed according to standard protocols described in Sambrook and Russell (2001). The commercial kits used are listed in the material section and used according to manufacturer’s instructions. All plasmids used in this study are listed in section 2.1.6.
2.2.8 Synthesis of mRNA for injection
Before synthesis of mRNA, DNA from a pCS2+ expression vector containing the desired insert was linearized by digestion with Not1 restriction enzyme for 3 hours at 37ºC. The pCS2+ plasmid contains a Not1 restriction site after the poly (A) signal, which, after mRNA injection into the embryo, mediates the generation of a poly (A) tail at the end of synthetic mRNA, making it more stable. The linearized DNA was purified using PCR purification kit (Qiagen) according to manufacturer’s instructions. The DNA was eluted in RNAse free water, checked for complete linearization by agarose gel electrophoresis and the concentration determined using a UV spectrometer. The DNA was stored at -20ºC.
Linearized plasmid DNA was then taken as a template to synthesize mRNA in vitro using SP6 polymerase reaction. This was performed using the mMessage mMachine kit (Ambion, UK) following the manufacturer’s instructions.
2.2.9 Synthesis of DIG labeled probes for in situ hybridization
Materials and Methods
2.2.10 Whole mount in situ hybridization
In order to detect gene expression in the embryo, whole mount in situ hybridization was performed as previously described (Barth and Wilson, 1995). Briefly, embryos were fixed in 4% PFA overnight at 4ºC. They were then washed in PBST, transferred into 100% methanol and stored at -20ºC. Before hydridization, embryos were re-hydrated and rinsed in PBST. They were then transferred into hybridization solution and incubated for 3-6 houts at 70ºC followed by hydridization with the desired DIG-labeled probe, overnight at 70ºC. Then they were washed in decreasing concentrations of SSC, transferred to MABT, followed by incubation with 2% blocking solution (Roche Diagnostics, Germany) for 5 hours at room temperature. The embryos were then incubated in an α-DIG antibody coupled to alkaline phosphatase (Roche Diagnostics, Germany) overnight at 4ºC. the antibody was washed away with MABT followed by a 5-minute incubation in 0.1 M Tris buffer pH 9.5 to adjust the pH. The probes were then detected with BM Purple solution (Roche Diagnostics, Germany). After detection, the embryos were washed with PBST and re-fixed in 4% PFA. To reduce background, embryos were incubated in a series of glycerol solutions with increasing concentrations. For sections, stained embryos were not incubated in glycerol, but instead equilibrated in gelatine/albumen solution (0.49% gelatine, 30% egg albumen, 20% sucrose in PBS). They were then transferred into an embedding form coated with fresh polymerisation solution (albumen, 25% gluteraldehyde, 10:1) and kept 15 minutes at room temperature to allow polymerization. 20-µm serial sections were taken using a Leica Vibratome
VT1000S. Images of whole-mount embryos were taken on an Olympus SZX12 stereomicroscope attached to an Olympus camera using Spot software. Images of sections were taken on a Zeiss Axioplan 2 microscope using Spot software. Final processing of the images was done with Adobe Photoshop software.
2.2.11 Biotin detection of transplanted cells