J. Aerosp. Technol. Manag., São José dos Campos, Vol.8, No 4, pp.397-407, Oct.-Dec., 2016
ABSTRACT: One of the main problems in micro unmanned aerial vehicles is endurance or light time since the general domain aircraft uses conventional fuel, which is a pollutant, has a limited life and is costly. Then, there is a huge demand for using an unlimited non-exhaustible source of energy. Solar energy is one of the unlimited available renewable energy which can be used to increase the endurance of unmanned aerial vehicle without adding signiicant mass or increasing the size of the fuel system. This paper aims to encourage research on renewable energy sources for aviation considering the basic challenges for a solar-powered aircraft: geographical area of operation, energy collection and storage, payload and design parameters. Hence, a plane is designed for 2 kg, including payload, and is analyzed in various aspects. Besides, the design is optimized starting from airfoil to complete structure for better performance.
KEYWORDS: Solar cell, Unmanned aerial vehicle, Renewable energy, Endurance, Conceptual design.
Design Analysis of Solar-Powered Unmanned
Aerial Vehicle
Karthik Reddy Buchireddy Sri1, Poondla Aneesh1, Kiran Bhanu1, M Natarajan1
INTRODUCTION
In today’s world, there are more than 11,000 unmanned aerial vehicles (UAVs) in service (or planned for future services) by the Military for various purposes (Kumar et al. 2015).hese vehicles can ly remotely as well as autonomously. In spite of their usage in various applications, they lack in performance because of power restrictions, which means they either have to land to refuel or to depend on another UAV to complete the task. Nowadays the ability to ly without using conventional fossil fuels is primarily focused in recent years, both in application point of view and scientiic ield since the major concerns are an increase in global warming and a decrease in natural resources. Since then, the use of electric aircrat has been widespread but here the crucial issue is their high power consumption when compared with their limited energy storage capability, which leads to an endurance that can rarely exceed half an hour. Increasing the size of the battery or incorporating more batteries increases the weight of the plane, which afects the light time of the UAV as it is inversely proportional. So, now, the ability to ly an aircrat to increase the endurance limit has been a key issue in both UAVs and civilian aviation.
One of the possibilities to increase the light time is by using unlimited solar energy through solar cells. hese cells, by connecting them with an electronic circuit, can provide suicient power for motor and the electronics and, if in excess, it can also be stored in the battery; here the battery can be used as a bufer when lying in darkness or under clouds. Hence, the possible solution to enhance the endurance is by using solar-powered aircrat driven by electric-based propulsion systems in which the power is supplied continuously throughout the
doi: 10.5028/jatm.v8i4.666
1.VIT University – School of Mechanical Engineering Mechanical Department – Vellore/Tamil Nadu – India.
Author for correspondence: Karthik Reddy Buchireddy Sri | VIT University – School of Mechanical Engineering Mechanical Department | Near Katpadi Road | Vellore – Tamil Nadu 632014 – India | Email: [email protected]
J. Aerosp. Technol. Manag., São José dos Campos, Vol.8, No 4, pp.397-407, Oct.-Dec., 2016 398 Reddy BSK, Aneesh P, Bhanu K, Natarajan M
day by the unlimited solar energy, which can eliminate fuel and also solve the limited energy storage capability problem.
his paper studies the complete design of a solar-powered UAV, which is mostly designed for low-altitude long-endurance (LALE) applications.
he main principle is to make use of available unlimited solar energy by converting it into electricity through solar cells. When sunlight strikes the solar cell, the cell creates electrons and holes as charge carriers and, when a circuit is made, the free electrons pass through a certain load in order to recombine with holes and, in this way, the current is generated. Here, by arranging solar cells in series on the top of the wing and then wrapping the entire wing with transparent material for the safety of solar cells during light, cells are arranged in series to get the required voltage in order to safely charge the 3S battery; from there, the battery power is supplied to the motor for throttling during constant level light. In this study, the aircrat was assumed to be a glider, which means it also stores the energy in the battery during the gliding period. In this way, both lying the plane by using solar energy alone and storing the energy in the battery in order to extend the light time can be achieved.
DESIGN METHODOLOGY
The design process of the entire aircraft is composed of two phases: conceptual and preliminary. In conceptual design, the basic configuration arrangement, size, weight, and performance are calculated. Then, designing the CAD modeling of individual parts in order to meet the required targets and optimizing it are done in preliminary design. The design requirements are used to guide and evaluate the development of the overall aircraft configuration. There are two simple balances:
• Weight balance: the lift force has to be equal to the weight of all the elements constituting the airplane.
• Energy balance: the energy that is collected during a day from the solar panel has to be equal to or higher than the electrical energy needed by the airplane during its level flight.
MISSION SpECIfICATIONS
One of the main aims of this paper is to check whether the power available from the Sun is required to power an aircrat, which, in turn, helps in increasing the endurance of the aircrat from a couple of minutes to hours. Here the gross weight of the plane
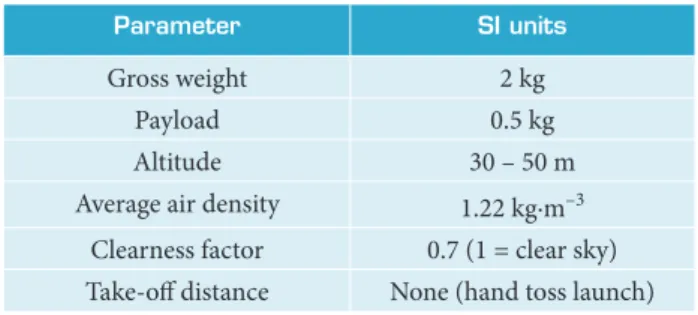
(2 kg) is kept constant (Table 1). here was no range requirement since the goal was simply to remain flying, not to reach any destination.
parameter SI units
Gross weight 2 kg
Payload 0.5 kg
Altitude 30 – 50 m
Average air density 1.22 kg∙m–3
Clearness factor 0.7 (1 = clear sky)
Take-of distance None (hand toss launch)
Table 1. Mission speciications.
ESTIMATION Of THE NuMBER Of SOLAR CELLS REquIRED AND ITS ARRANGEMENT ON THE WING
For this design, 3S battery has been chosen for two reasons: using more lithium polymer (LiPo) cells in series (> 3S) requires more voltage to initiate the charging process, leading to an increase in solar cells and wingspan, which, in turn, increases the weight of the model. On the other hand, if less LiPo cells in series (2S) are used, it will be diicult to supply the required power to achieve a good climb rate.
As for charging the 3S battery, it requires a constant safe charging voltage of about 12.4 V. his voltage has to be supplied by the solar cells; those selected for this design were Sun power C-60 photovoltaic. he Sun power cells were more eicient than most silicon-based ones. he 22% eiciency of the C-60 (Table 2)was signiicantly better than typical silicon solar cells with eiciencies around 15% (Kederoglu et al. 2012). According to Table 2, each solar cell gives out 0.57 V, which means 22 solar cells are required to meet the targeted voltage; here, two more cells are added for safe side. hese 24 cells should be connected in series to achieve the required voltage.
Since the number of cells is ixed, a minimum area of the wing is calculated. Two possible combinations in arranging
parameter SI unit
Mass of Solar cell 0.008 kg
Length and width 0.125 × 0.125 m
Area of single solar panel 0.0150 m2
Eiciency of solar cell 22%
Rated voltage 0.57 V
Rated current 5.37 A
Table 2. Speciications of sun power C-60 solar cell.
J. Aerosp. Technol. Manag., São José dos Campos, Vol.8, No 4, pp.397-407, Oct.-Dec., 2016 399 Design Analysis of Solar-Powered Unmanned Aerial Vehicle
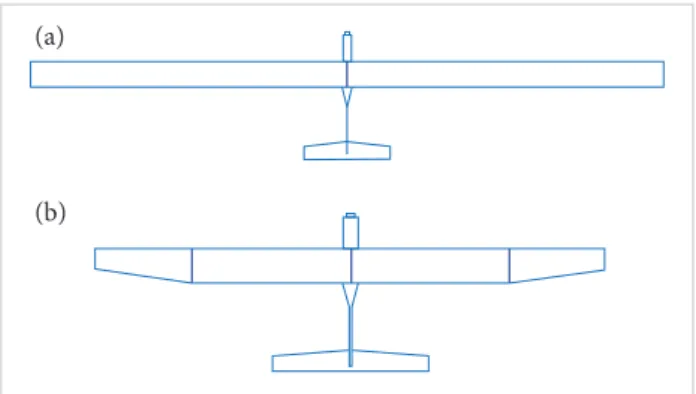
these cells in series (Type 1 and Type 2) over the wing can be seen in Fig. 1.
all parameters. he ends of the wing are tapered from a root chord of 30 cm to a tip one of 20 cm over a length of 50 cm. he aspect ratio of the entire wing is 9.36.
AIRfOIL SELECTION
Ater inalizing the wing design, the airfoil is selected based on the following requirements: high lit coeicient; low drag coeicient; less camber for cell placement. Here, the 4 airfoils are analyzed, which are taken from previous designs (Bruscoli 2011). he approach to ind the airfoil lit and drag is shown in Fig. 3, where the input parameters are aspect ratio (AR) and wingspan (b). he airfoils can be seen in Figs. 4.
For these 4 airfoils, XFLR analysis has been done to select the airfoil with the best performance characteristics. he analysis is done for 30-cm chord length and by keeping the 4-degree angle of attack for all airfoils.
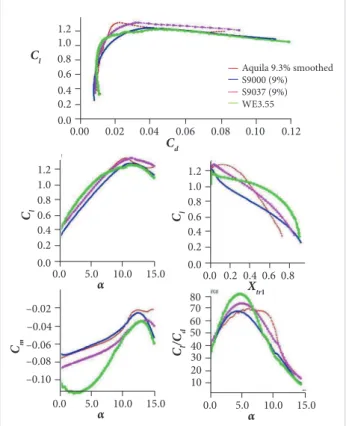
In Fig 5, various graphs have been plotted by comparing the 4 airfoils for the 4-degree angle of attack (α), and the important parameters lift (CL) and drag (CD) coefficients are shown in Table 3. Hence, according to this table, Airfoil-4 WE3.55 is chosen for its best performance as it has high CL/CD ratio, which is the same airfoil designed for Sky-Sailor (Noth 2008).
Wing’s urface
Type 1
+ –
+ – Type 2
Solar cell Tapping wire
InputAR,b
Calculate lift, Reynolds number
Create 2-D lift curve, drag polar pitch in moment curve
Create 3-D lift and drag
Yes No
3-D sweep taper analysis
Output airfoil lift and drag
input Input airfoil
Optimum airfoil
Figure 1. (a) Single row of cells — high-aspect-ratio wing (Type 1); (b) Two rows of cells — medium-aspect-ratio wing (Type 2).
Figure 2. Arrangement and connection of solar cells on the wing. Figure 3. Flowchart to ind airfoil lift and drag. he problems in Fig. 1a are:
• he wing is two long, which requires a tough structure, increasing the weight and cost.
• Controlling will be diicult as it does not have ailerons.
• While connecting the circuit with tapping wire, the 2 ends of the wire are too far, resulting in loss of power eiciency. In Fig. 1b, all these problems are solved as the solar cells are placed only on the mid wing; the end wings are for stability with a polyhedral angle of about 7° on both sides, which also includes ailerons for easy control. In Fig. 2, it is observed that, in Type 1, more tapping wire is used in order to close the circuit, which means more loss while transferring the current. In Type 2, this problem is nulliied as we can close the circuit with the usage of very less wire.
As each solar cell has 0.125 m in length, for 12 solar cells in a row, a wingspan (middle portion) of 1.5 m is required. However, apart from this length, extra space is required for the soldering purpose. Besides, at the ends, at least 2 – 3 cm should be let because there will be abnormal forces at the junction. hen, a central wingspan of 1.63 m was chosen by considering
(a)
J. Aerosp. Technol. Manag., São José dos Campos, Vol.8, No 4, pp.397-407, Oct.-Dec., 2016 400 Reddy BSK, Aneesh P, Bhanu K, Natarajan M
Circuit Diagram
From the circuit diagram shown in Fig. 6, the energy received from the Sun is collected by the solar panel, which converts it into electricity and then there is the maximum power point tracker (MPPT), which helps in tracking the maximum power of any solar cell and provides it at all times. In MPPT, there are 3 terminals: one is connected to the solar panel; the other, to load (motor); and the last one, to the battery. h en, in level l ight, the MPPT sends power directly to the motor from the solar cells and, when gliding, as the motor does not require power, the battery starts charging. If an excess of power is required, during climbing or when the solar intensity is low, the battery supplies the required power, which is stored into the motor. h us, from the battery, the energy goes to the motor, which rotates the propeller and, between them, there is an electronic speed control (ESC) regulating the speed. Besides the present battery, there is an additional small pencil battery to control the avionics; the reason to separate it is, even if there is any problem in the main circuit or else, any damage in the cells still controlling the plane can be done as the control system’s battery is not connected to the main circuit, which helps in safe landing.
Figure 5. Comparison of airfoil performance.
Sun
Solar cells MPPT Battery 2
Battery 1
ESC
Motor
BEC Receiver
Servo 3
(rudder) Servo 2 (elevator)
Servo 1 (aileron)
parameter Aquila 9.3%
Medium S9000
(9%)
S9037
(9%) WE3.55
CL 0.83 0.75 0.83 0.91
CD 0.013 0.01127 0.116 0.0115
CL/CD 64 66.5 71 78.5
Table 3. Comparison of the 4 selected airfoils.
Figure 6. Circuit diagrams for entire plane.
Figure 4. (a) Aquila 9.3%; (b) Medium S9000 (9%); (c) S9037 (9%); (d) WE3.55.
0 .0 0 .1 0.2 0.3 0.4 0.5 0.6 0.7 0.8 0.9 1.0
0.0 0.1 0.2 0.3 0.4 0.5 0.6 0.7 0.8 0.9 1.0
0.0 0.1 0.2 0.3 0.4 0.5 0.6 0.7 0.8 0.9 1.0
0.0 0.1 0.2 0.3 0.4 0.5 0.6 0.7 0.8 0.9 1.0
pOWER REquIRED fOR LEvEL fLIGHT
At steady level l ight, the lit force generated by the wing exactly compensates for the weight, and the propeller thrust, for the drag force (Simons 1994).
(a)
(b)
(c)
(d)
(1)
Aquila 9 .3 % smoothed S9000 (9%) S9037 (9%) WE3.55
0.00 0.0 0.2 0.4 0.6 0.8 1.0 1.2
0.02
0.0 0.0 0.2 0.4 0.6 0.8 1.0 1.2
5.0 10.0 15.0
0.04 0.06 0.08 0.10 0.12
C
d
α C
l
Cl
0.0 –0.10 –0.08 –0.06 –0.04 –0.02
5.0 10.0 15.0
α
Cm
0.0 0.0 0.2 0.4 0.6 0.8 1.0 1.2
0.2 0.4 0.6 0.8
X
tr1 Cl
0.0 10 20 30 40 50 60 70 80
5.0 10.0 15.0
α
Cl
/C
d
where: m is the mass of the aircrat (kg); L is the lit force;
ρ is the air density (kg∙m–3); S is the surface area of the wing (m2); V is the cruise velocity of the aircrat (m∙s–1).
W=mg=L=
ρ2
C
LSV
2
ρ 2
��2
π∗e∗AR
δ =23.45 sin (360
284+n365ω
ϕ × tanδ)
24 π
360n
365
ω
ϕ.sinδ+cosϕ.cosδ.sinω
∙
2
15
(−tanϕ.tanδ)
H
Ho
(
S
Smax
)
ω = (15h − 180)
[
24π(c + d.cosω)
cosω−coswssinws− πws180cosws
λ =
����
Sh∗Lh
S∗c BEC: Battery eliminator circuit.
J. Aerosp. Technol. Manag., São José dos Campos, Vol.8, No 4, pp.397-407, Oct.-Dec., 2016 401 Design Analysis of Solar-Powered Unmanned Aerial Vehicle
he axial thrust is calculated as: ef f iciencies involve d must b e include d: prop el ler ef f icienc y o f 80%, m o t o r e f f i c i e n c y o f 8 0 %, ESC efficiency of 7 0 % and the battery discharge efficiency of 90%, so that it is obtained a total of 40.38%. Here, extra 2 W are added to other losses. Hence, the total power required from the batteries is: (Power required for cruise/Battery to thrust efficiency) + Pother= 27.11 W.
The other circuit was from the battery to solar cells in which solar encapsulation was 90%; solar cells, 22%; cam- ber efficiency, 90%; MPPT efficiency, 90%; and battery charging efficiency, 90%, totaling 14.435%. In order to get this power, the required solar irradiance is: Total power required from batteries/ (Sunlight to battery efficiency × Area of Solar cells) = 451.23 W∙m-2. Hence, 451.23 W∙m-2 of solar irradi-ance is required in order to have a level flight. Now, whether this much amount of solar irradiance is available from the Sun has to be determined.
pOWER AvAILABLE fROM SOLAR ENERGY
Here, the power available from solar energy is calculated for April 1st, 2016 since April and May represent the hottest seasons in which maximum solar radiation occurs (n = 92, as the numeric sequence starts with 1 for January 1st).
Then, the latitude (ϕ) of VIT Vellore, India, for the calculation, is 12.9692°. From this, the declination angle (δ) is calculated (Eq. 5), which represents the angular displacement of the Sun’s rays at the north (or south) of the Equator and is the angle made by the Sun and the Earth with its projection on the equatorial plane.
where: D is the drag force. he induced drag is obtained as:
where: cd is the coeicient of drag of airfoil.
From Bandel et al. (2015), e means Oswald’s eiciency, equal to 1.78 × (1 − 0.045 × AR0.68) − 0.64. The power required for level light is:
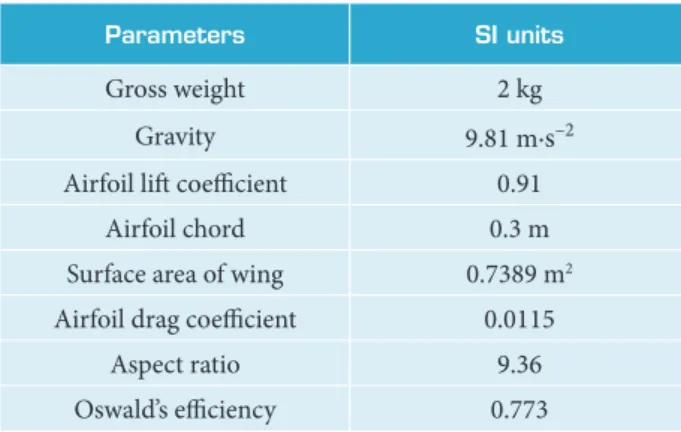
he required parameters for calculating the level light are shown in Table 4. As the mass of the plane was initially ixed as 2 kg, the total weight of the plane becomes 19.6 N. From the above two equations, the cruise velocity of the plane that can be obtained as the lit coeicient for the airfoil is 0.91, and the surface area of the wing can be calculated as the chord equal to 30 cm and the length of 2.63 m, which is 0.8 m2. Hence, the velocity of the plane at cruise is 7.5585 m∙s–2. he total drag is the sum of 3 drags: one caused by the wing cd, which is around 0.2479 N; the other is the induced drag, which accounts for 0.7855 N due to very high lit; and the last one is due to the body (fuselage), which is taken 1.7 times the airfoil drag. hen, the total drag for the entire plane is 1.4646 N. From the total drag force and the cruise velocity, one can ind the power required for a cruise: Preq= T × V = 10.13 W.
In order to get this much power, more power should be extracted from batteries as there are electronics in the circuit for which there will be losses during conversion and
parameters SI units
Gross weight 2 kg
Gravity 9.81 m∙s–2
Airfoil lit coeicient 0.91
Airfoil chord 0.3 m
Surface area of wing 0.7389 m2
Airfoil drag coeicient 0.0115
Aspect ratio 9.36
Oswald’s eiciency 0.773
Table 4. Required parameters for calculating level light.
(2) (3) (4) (5) (6) (7)
By using latitude and declination angle, the hour angle (ωs) can be found, which is the angle through which the Earth
must turn to bring the meridian at a point directly in line with the Sun’s rays. It is equivalent to 15° per hour. From Jashnani
et al. (2013):
ρ 2
T= D=
ρ2
C
DSV
2��2
π∗e∗AR
δ =23.45 sin (360
284+n365ω
ϕ × tanδ)
24 π
360n
365
ω
ϕ.sinδ+cosϕ.cosδ.sinω
∙
2
15
(−tanϕ.tanδ)
H
Ho
(
S
Smax
)
ω = (15h − 180)
[
24π(c + d.cosω)
cosω−coswssinws− πws180cosws
λ =
����
Sh∗Lh
S∗c ρ 2
T= D=
ρ2
C
��2
π∗e∗AR
δ =23.45 sin (360
284+n365ω
ϕ × tanδ)
24 π
360n
365
ω
ϕ.sinδ+cosϕ.cosδ.sinω
∙
2
15
(−tanϕ.tanδ)
H
Ho
(
S
Smax
)
ω = (15h − 180)
[
24π(c + d.cosω)
cosω−coswssinws− πws180cosws
λ =
����
Sh∗Lh
S∗c ρ 2
T= D=
ρ2
C
��2
π∗e∗AR
δ =23.45 sin (360
284+n365ω
ϕ × tanδ)
24 π
360n
365
ω
ϕ.sinδ+cosϕ.cosδ.sinω
∙
2
15
(−tanϕ.tanδ)
H
Ho
(
S
Smax
)
ω = (15h − 180)
[
24π(c + d.cosω)
cosω−coswssinws− πws180cosws
λ =
����
Sh∗Lh
S∗c ρ 2
ρ 2
C
Di=
�� 2 π∗e∗ARδ =23.45 sin (360
284+n365ω
ϕ × tanδ)
24 π
360n
365
ω
ϕ.sinδ+cosϕ.cosδ.sinω
∙
2
15
(−tanϕ.tanδ)
H
Ho
(
S
Smax
)
ω = (15h − 180)
[
24π(c + d.cosω)
cosω−coswssinws− πws180cosws
λ =
����
Sh∗Lh
S∗c ρ 2
ρ 2
C
Di=
�� 2 π∗e∗ARδ =23.45 sin (360
284+n365ω
ϕ × tanδ)
24 π
360n
365
ω
ϕ.sinδ+cosϕ.cosδ.sinω
∙
2
15
(−tanϕ.tanδ)
H
Ho
(
S
Smax
)
ω = (15h − 180)
[
24π(c + d.cosω)
cosω−coswssinws− πws180cosws
λ =
����
Sh∗Lh
S∗c ρ 2
ρ 2
C
Di=
�� 2π∗e∗AR
; C
D= c
d+ C
Diδ =23.45 sin (360
284+n365ω
ϕ × tanδ)
24 π
360n
365
ω
ϕ.sinδ+cosϕ.cosδ.sinω
∙
2
15
(−tanϕ.tanδ)
H
Ho
(
S
Smax
)
ω = (15h − 180)
[
24π(c + d.cosω)
cosω−coswssinws− πws180cosws
λ =
����
Sh∗Lh
S∗c ρ 2
ρ 2
��2
π∗e∗AR
P
req= T×V
δ =23.45 sin (360
284+n365ω
ϕ × tanδ)
24 π
360n
365
ω
ϕ.sinδ+cosϕ.cosδ.sinω
∙
2
15
(−tanϕ.tanδ)
H
Ho
(
S
Smax
)
ω = (15h − 180)
[
24π(c + d.cosω)
cosω−coswssinws− πws180cosws
λ =
����
Sh∗Lh
S∗c
ρ 2
ρ 2
��2
π∗e∗AR
δ =23.45 sin (360
284+n365
)
ω
ϕ × tanδ)
24 π
360n
365
ω
ϕ.sinδ+cosϕ.cosδ.sinω
∙
2
15
(−tanϕ.tanδ)
H
Ho
(
S
Smax
)
ω = (15h − 180)
[
24π(c + d.cosω)
cosω−coswssinws− πws180cosws
λ =
����
Sh∗Lh
S∗c ρ 2
ρ 2
��2
π∗e∗AR
δ =23.45 sin (360
284+n365ω
s= cos
-1(tan
ϕ
× tanδ)
24 π
360n
365
ω
ϕ.sinδ+cosϕ.cosδ.sinω
∙
2
15
(−tanϕ.tanδ)
H
Ho
(
S
Smax
)
ω = (15h − 180)
[
24π(c + d.cosω)
cosω−coswssinws− πws180cosws
λ =
����
Sh∗Lh
S∗c
ρ 2
ρ 2
��2
π∗e∗AR
δ =23.45 sin (360
284+n365ω
ϕ × tanδ)
H
o=
24π
I
sc× 3600(1 + 0.033(cos
360n365
))(
ω
ϕ.sinδ+cosϕ.cosδ.sinω
∙
2
15
(−tanϕ.tanδ)
H
Ho
(
S
Smax
)
ω = (15h − 180)
[
24π(c + d.cosω)
cosω−coswssinws− πws180cosws
λ =
����
Sh∗Lh
S∗c ρ
2
ρ 2
��2
π∗e∗AR
δ =23.45 sin (360
284+n365ω
ϕ × tanδ)
24
π
cos
360n
365
))(
ω
s.sin
ϕ.sinδ+cosϕ.cosδ.sinω
s) kJ/m
2∙
day
2
15
(−tanϕ.tanδ)
H
Ho
(
S
Smax
)
ω = (15h − 180)
[
24π(c + d.cosω)
cosω−coswssinws− πws180cosws
λ =
����
Sh∗Lh
S∗c
hus, daily average irradiance (Ho) is:
J. Aerosp. Technol. Manag., São José dos Campos, Vol.8, No 4, pp.397-407, Oct.-Dec., 2016 402 Reddy BSK, Aneesh P, Bhanu K, Natarajan M
where: Iscis the extra-terrestrial irradiance.
he day length or maximum sunshine hours can be found using:
which was for 12:13. hen, monthly average daily global radiation (H) can be calculated for an altitude of 30 m and estimated using:
where: a = −0.309 + 0.539.cosϕ − 0.0693E + 0.29 (S/Smax);
b = 1.527 − 1.027.cosϕ + 0.0926E − 0.359 (S/Smax); S is the average sunshine hour per day; E is the elevation of the location above mean sea level (200 m — Vellore).
At each hour of the day (h), the instantaneous hour angle for a particular hour can be estimated as (in degrees):
The hourly global solar irradiance can be achieved (in kJ∙m-2∙day-1) by using:
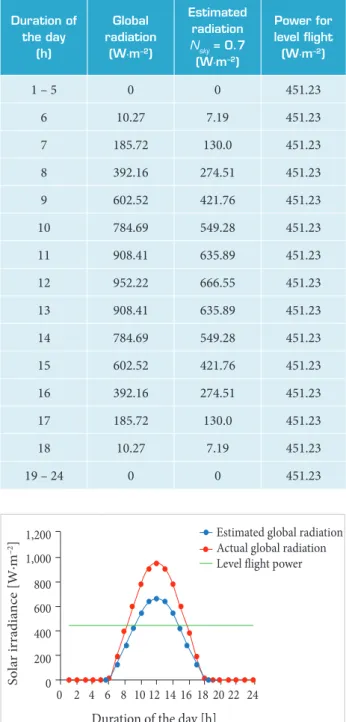
Duration of the day
(h)
Global radiation
(W∙m–2)
Estimated radiation Nsky = 0.7 (W∙m–2)
power for level light (W∙m–2)
1 – 5 0 0 451.23
6 10.27 7.19 451.23
7 185.72 130.0 451.23
8 392.16 274.51 451.23
9 602.52 421.76 451.23
10 784.69 549.28 451.23
11 908.41 635.89 451.23
12 952.22 666.55 451.23
13 908.41 635.89 451.23
14 784.69 549.28 451.23
15 602.52 421.76 451.23
16 392.16 274.51 451.23
17 185.72 130.0 451.23
18 10.27 7.19 451.23
19 – 24 0 0 451.23
Table 6. Estimated global solar radiation on April 1st, 2016
versus power required for level light.
Estimated global radiation
Actual global radiation
Level flight power
Duration of the day [h]
S o la r ir radi an ce [W·m –2] 1,200 1,000 800 600 400 200 0
0 2 4 6 8 10 12 14 16 18 20 22 24
Figure 7. Duration of the day (April 1st, 2016) versus
hourly global solar radiation — level light power.
(8) (9) (10) (11) ρ 2 ρ 2
��2
π∗e∗AR
δ =23.45 sin (360
284+n365ω
ϕ × tanδ)
24 π
360n
365
ω
ϕ.sinδ+cosϕ.cosδ.sinω
∙
S
max=
215
(−tanϕ.tanδ)
H
Ho
(
S
Smax
)
ω = (15h − 180)
[
24π(c + d.cosω)
cosω−coswssinws− πws180cosws
λ =
����
Sh∗Lh
S∗c ρ 2
ρ 2
��2
π∗e∗AR
δ =23.45 sin (360
284+n365ω
ϕ × tanδ)
24 π
360n
365
ω
ϕ.sinδ+cosϕ.cosδ.sinω
∙
S
max=
215
cos
(−tanϕ.tanδ)
H
Ho
(
S
Smax
)
ω = (15h − 180)
[
24π(c + d.cosω)
cosω−coswssinws− πws180cosws
λ =
����
Sh∗Lh
S∗c ρ 2
ρ 2
��2
π∗e∗AR
δ =23.45 sin (360
284+n365ω
ϕ × tanδ)
24 π
360n
365
ω
ϕ.sinδ+cosϕ.cosδ.sinω
∙
S
max=
215
cos
-1
(−tanϕ.tanδ)
H
Ho
(
S
Smax
)
ω = (15h − 180)
[
24π(c + d.cosω)
cosω−coswssinws− πws180cosws
λ =
����
Sh∗Lh
S∗c ρ 2
ρ 2
��2
π∗e∗AR
δ =23.45 sin (360
284+n365ω
ϕ × tanδ)
24 π
360n
365
ω
ϕ.sinδ+cosϕ.cosδ.sinω
∙
2
15
(−tanϕ.tanδ)
H
Ho
= a +
(
SSmax
)
ω = (15h − 180)
[
24π(c + d.cosω)
cosω−coswssinws− πws180cosws
λ =
����
Sh∗Lh
S∗c ρ 2
ρ 2
��2
π∗e∗AR
δ =23.45 sin (360
284+n365ω
ϕ × tanδ)
24 π
360n
365
ω
ϕ.sinδ+cosϕ.cosδ.sinω
∙
2
15
(−tanϕ.tanδ)
H
Ho
= a +
(
SSmax
)
ω = (15h − 180)
[
24π(c + d.cosω)
cosω−coswssinws− πws180cosws
λ =
����
Sh∗Lh
S∗c ρ 2
ρ 2
��2
π∗e∗AR
δ =23.45 sin (360
284+n365ω
ϕ × tanδ)
24 π
360n
365
ω
ϕ.sinδ+cosϕ.cosδ.sinω
∙
2
15
(−tanϕ.tanδ)
H
Ho
= a + b
(
SSmax
)
ω = (15h − 180)
[
24π(c + d.cosω)
cosω−coswssinws− πws180cosws
λ =
����
Sh∗Lh
S∗c ρ 2
ρ 2
��2
π∗e∗AR
δ =23.45 sin (360
284+n365ω
ϕ × tanδ)
24 π
360n
365
ω
ϕ.sinδ+cosϕ.cosδ.sinω
∙
2
15
(−tanϕ.tanδ)
H
Ho
(
S
Smax
)
ω = (15h − 180)
[
24π(c + d.cosω)
cosω−coswssinws− πws180cosws
λ =
����
Sh∗Lh
S∗c
ρ 2
ρ 2
��2
π∗e∗AR
δ =23.45 sin (360
284+n365ω
ϕ × tanδ)
24 π
360n
365
ω
ϕ.sinδ+cosϕ.cosδ.sinω
∙
2
15
(−tanϕ.tanδ)
H
Ho
(
S
Smax
)
ω = (15h − 180)
I
g=
[
π24
(c + d.cosω)
cosω−cosws
sinws− πws180cosws
] × H
λ =
����
Sh∗Lh
S∗c
parameter SI units
Declination angle 4.4139°
Hour angle 91.0186°
Daily average irradiance 37,537 kJ∙m-2∙day-1
Day length 12.13 h
Monthly average daily radiation 24,266 kJ∙m-2∙day-1
Table 5. Calculated solar parametric values. where: c = 0.409 + 0.516 × sin (ω
s − 60)
and d = 0.6609 − 0.4767 × sin (ω s − 60).
he calculated solar parametric values are shown in Table 5 and, by calculating the instantaneous hour angle for a particular hour, global solar irradiance can be found for each solar hour; by taking the clear sky factor (Nsky) as 0.7, the readings in Table 6 are obtained for the entire day.
J. Aerosp. Technol. Manag., São José dos Campos, Vol.8, No 4, pp.397-407, Oct.-Dec., 2016 403 Design Analysis of Solar-Powered Unmanned Aerial Vehicle
PRELIMINARY DESIGN
DESIGN Of THE WINGWing Coniguration
With respect to the angle made with the fuselage, from Fig. 8, the central part of the wing is perpendicular to the fuselage (straight) because it contains the solar cells and, in order to get maximum eiciency, these cells should be parallel to the ground; this kind of wing has high rigidity but poor roll stability. Hence, in order to have a good counter roll and lit, the ends of the main wing are extended by keeping a positive dihedral angle of 7°, which makes an obtuse angle with the main wing.
Regarding the position of the wing on the fuselage, a high wing is selected, which means it is situated over the fuselage; this kind of design helps in having high ground clearance, less interference drag, better ield performance at low speeds and maximum space for having a payload.
The spars will handle the tension and compression forces on the wing and are attached to the fuselage so they can transfer the forces to it; here, the forces will be spread over the entire construction. he ribs (made of lightweight balsa wood) are intended to give the wing the desired airfoil shape and also to stabilize the construction; they provide rigidity and strength to the wing by transferring the forces to the spars. he skin is also a part of the construction to resist the forces on the wing, which covers only the top surface with 1 mm of balsa sheet in order to make a non-conductive lat surface for the integration of solar cells.
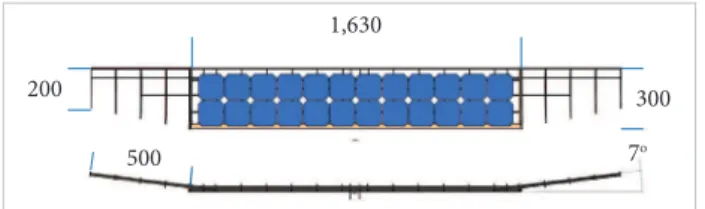
The ends of the wing are tapered from a root chord of 30 cm to a tip chord of 20 cm over a length of 50 cm. This part of the wings includes ailerons in order to have stability and control over the plane; In these parts, two carbon fiber spars are kept in order to give support and help in integrating the tapered parts to the main wing, since, at the junction of two parts of the wing, large forces will act. In Fig. 12, all dimensions are in mm.
DESIGN Of THE TAIL
The airfoil selected for the horizontal and vertical tail is the NACA 0009 (Fig. 9) because it has a symmetrical profile in nature and a maximum lift coefficient of 0.8. For the horizontal tail, the mean chord length is 0.205 m and, for the vertical one, the mean chord length is 0.25 m (AirfoilTools.com 2016).
1,630
300
500 200
7o
Figure 9. NACA 0009 airfoil shape.
Figure 8. A draft model of the entire wing assembly.
(12)
(13)
Taper Ratio
It is the ratio (λ) between the tip and the root chord of the
wings. A trapezoidal shaped (0 < λ < 1) is selected for the
ends of the main wing. Wing tapering is used to improve lift distribution characteristics, which will also result in better lateral control since the mass moment of inertia of the wings around
the longitudinal axis will be less. Here, λ = 0.66.
where: Ctisthe tip chord; Cr is theroot chord.
Structure
In the central part of the wing, the construction consists of spars, ribs, and the skin. As the central part of the wing is 0.0163 m, which has solar cells integrated into it, the main priority is to achieve very small delection. hen, 3 spars have been included, which are made of a carbon iber (zoltac) material; two of them are 6 × 4 mm and the middle one is 4 × 2 mm.
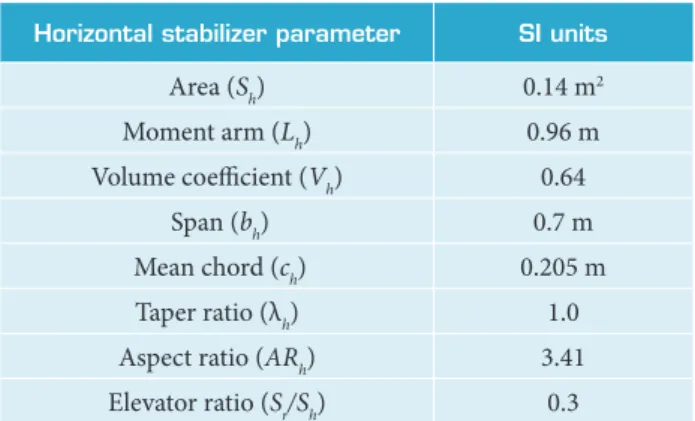
Horizontal Tail
he dominant factors which control the aircrat pitch stability are gravity center (GC) position and horizontal tail size and position. he efectiveness of horizontal tail is measured by horizontal tail volume coeicient (Vh):
where: Shis the horizontal tail area; Lhis the distance from the tail’s aerodynamic center (more of which later) to the
ρ 2
ρ 2
��2
π∗e∗AR
δ =23.45 sin (360
284+n365
ω
ϕ × tanδ)
24 π
360n
365
ω
ϕ.sinδ+cosϕ.cosδ.sinω
∙
2
15
(−tanϕ.tanδ)
H
Ho
(
S
Smax
)
ω = (15h − 180)
[
24π(c + d.cosω)
cosω−coswssinws− πws180cosws
λ =
����
Sh∗Lh
S∗c
ρ 2
ρ 2
��2
π∗e∗AR
δ =23.45 sin (360
284+n365ω
ϕ × tanδ)
24 π
360n
365
ω
ϕ.sinδ+cosϕ.cosδ.sinω
∙
2
15
(−tanϕ.tanδ)
H
Ho
(
S
Smax
)
ω = (15h − 180)
[
24π(c + d.cosω)
cosω−coswssinws− πws180cosws
λ =
����
V
h=
Sh∗LhJ. Aerosp. Technol. Manag., São José dos Campos, Vol.8, No 4, pp.397-407, Oct.-Dec., 2016 404 Reddy BSK, Aneesh P, Bhanu K, Natarajan M
aircrat’s GC; S is the wing area; c is the mean aerodynamic chord.
Ater several iterations, the horizontal stabilizer parameters are shown in Table 7.
a Reynolds number of 150,000 and by using SST k-ω viscous
model. he boundary conditions are given in Table 10.
Horizontal stabilizer parameter SI units
Area (Sh) 0.14 m2
Moment arm (Lh) 0.96 m
Volume coeicient (Vh) 0.64
Span (bh) 0.7 m
Mean chord (ch) 0.205 m
Taper ratio (λh) 1.0
Aspect ratio (ARh) 3.41
Elevator ratio (Sr/Sh) 0.3
Table 7. Horizontal tail coniguration.
Vertical Tail
he role of vertical tail is to control the yaw movement by providing yaw damping. he efectiveness of vertical tail is measured by the vertical tail coeicient (Vv):
where: Sv is the vertical tail area; Lv is the distance from the vertical tail’s aerodynamic center to the aircrat’s GC; b is the wingspan.
Ater several iterations, the vertical stabilizer parameters are shown in Table 8. In Fig. 10, all dimensions are in mm.
fuSELAGE
his part is designed ater a number of iterations in order to improve the lit-to-drag ratio. he trails shown in Table 9 are analyzed in luent sotware as shown in Fig. 11, respectively, for
vertical stabilizer parameters SI units
Area (Sv) 0.075 m2
Moment arm (Lv) 0.85 m
Volume coeicient (Vv) 0.0328
Span (bv) 0.3 m
Mean chord (cv) 0.25 m
Aspect ratio (ARv) 2.4
Taper ratio (λl) 1.0
Rudder ratio (Sr/Sv) 0.3
Table 8. Vertical tail coniguration.
Table 9. Comparison of L/D for different trails.
Trail number Design modiication L/D
1 Basic cuboidal 15.244
2 Tapered front and back 15.498
3 Lightly streamlined 15.72
4 Final design 15.81
Table 10. Boundary conditions.
Edge Type of
boundary Boundary condition
Inlet Velocity 8 m∙s–1 (x direction)
Outlet Pressure Gauge pressure = 0 Pa
Wall Stationary Velocity = 0 m∙s–1
Figure 11. (a) Basic cuboidal (Trail 1); (b) Tapered ends (Trail 2); (c) Streamlined (Trail 3); (d) Final design (Trail 4).
(14)
(a)
(c) (b)
d)
V
v=
Sv∗LvS∗b
ρV
Figure 10. A draft model of the entire tail assembly.
700
J. Aerosp. Technol. Manag., São José dos Campos, Vol.8, No 4, pp.397-407, Oct.-Dec., 2016 405 Design Analysis of Solar-Powered Unmanned Aerial Vehicle
he inal design is selected, having a lit force of 18.06 N and a drag one of 1.142 N. he primary function of the fuselage is to carry the electronics and payload. Hence, a length of 0.65 m and 0.82 m in width and height are obtained for the design. he propulsion system components can be mounted in the front of the fuselage, and the electronics and payload may be shited back or fronted in such a way to adjust the center of gravity position of the plane, which is at a distance of 9 cm from the leading edge of the wing. he tail boom is connected to the back of the fuselage, which is integrated to the main wing through carbon iber rods. In Fig. 12, all dimensions are in meters. Finally, all parts are assembled forming the complete plane, as shown in Fig. 13, in which all the dimensions are in mm.
A sotware has been used to ind the delection and stress using inite element method. In order to validate it, we took a problem which can be solvable by the analytical approach and compared it with the sotware results.
For the validation, a problem (Bansal 2010) has been solved both manually and in the sotware; the deviation was found to be less than 5%. hen, for further complex analyses, the sotware is used to ind the results. he input properties for balsa wood (MakeitFrom.com 2016) and carbon iber (GoodWinds Composites 2016) have been taken for all the analyses.
In the wing deformation, the mid wing excluding the tapered parts is analyzed since mostly the lit force is acted only on the middle section of the wing. hen, a load of 4 kg is applied to the entire wing, taking a factor of safety equal to 2 and keeping the central position of about 10 cm constant since that portion is ixed to the fuselage, as shown in Fig 14. A delection of only 1.4 cm is observed.
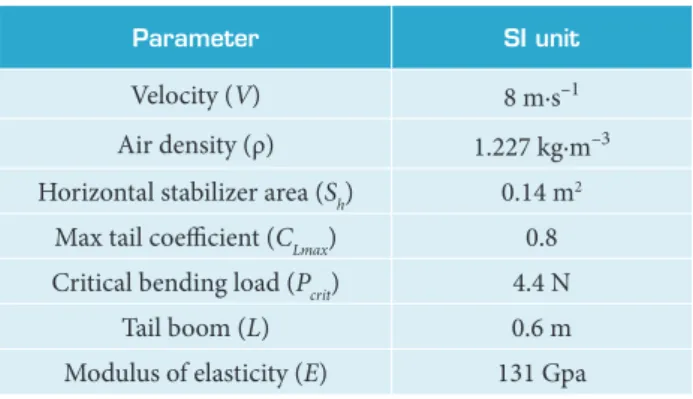
he tail boom has to resist to bending loads, keeping the empennage surfaces at the proper aerodynamic incidence with the wing. If the tail boom lexed too much, control efectiveness would be reduced. Bending load is the greatest on the tail boom when the empennage surfaces operate at a high lit coeicient and the aircrat is lying at a high speed. he bending load on the tail boom could be treated as a point load acting at the end of the tail boom and its critical value can be calculated as:
1,630
1,580 2,630
300
670
700 500
7o
82
900
330
0.650
0.082
Figure 13. Entire plane draft model.
Figure 12. A draft model of the fuselage.
STRuCTuRAL ANALYSIS
he two primary structures for the design are the wing spar and the tail boom. Both of these are analyzed in detail so they could be lightweight but strong enough to support the design loads. he wing spar has to carry 3 primary loads: the wing bending load produced by lit, the transverse shear load caused by wing bending, and the torque load produced by the pitching moment of the wing airfoil. he tail boom has to carry the ben- ding loads produced by the horizontal and vertical stabilizers.
he wing spar and tail boom are made of carbon iber material which can support very high loads before they fail. For aerodynamic surfaces, even a small amount of deformation could potentially upset the stability or control of the airplane. Calculating the structural deformation using an analytical method would have been impractical. Instead, the potential approach is to use inite element analysis to determine how the structures are deformed.
(15)
Sv∗Lv
S∗b
P
crit= (0.5)
ρV
2S
hC
LmaxThe critical bending load characteristics for the tail boom are shown in Table 11. A bending load that we got from the calculation of 4.4 N is applied on one end of the tail, keeping the other end constant. A deflection of 0.8 cm is observed. he fuselage has to carry the payload and electronics, which can weight more than 1 kg. Hence, a force of 30 N, which is
parameter SI unit
Velocity (V) 8 m∙s–1
Air density (ρ) 1.227 kg∙m–3
Horizontal stabilizer area (Sh) 0.14 m2
Max tail coeicient (CLmax) 0.8
Critical bending load (Pcrit) 4.4 N
Tail boom (L) 0.6 m
Modulus of elasticity (E) 131 Gpa
J. Aerosp. Technol. Manag., São José dos Campos, Vol.8, No 4, pp.397-407, Oct.-Dec., 2016 406 Reddy BSK, Aneesh P, Bhanu K, Natarajan M
3 kg (more than the entire plane weight), is applied to the front
section by keeping the end section ixed, as shown in Fig 15. A deformation of 0.279 cm is observed.
Concerning the stress analysis, the fuselage is analyzed to ind out whether the stress is below the permissible range or not for a load of 30 N. Besides, according to the analysis, as shown in Fig. 16, a von Mises stress of 4.4 MPa is observed, which is within the permissible value of 9.6 MPa.
In the middle section of the wing, more stress is acted on the carbon iber rods than that of balsa ribs and skin for a force of 40 N, as shown in Fig. 17. Nevertheless, the stress which is acted
Figure 16. Von Mises stress analysis of the fuselage.
Figure 17. An enlarged view of stress region near the middle portion of the mid-wing.
Figure 15. Delection of the fuselage.
A : s t a t i c s t r u c t u r a l E q u i v a l e n t s t r e s s
Ty p e : e q u i v a l e n t ( v o n M i s e s ) s t r e s s Un i t : P a
T i m e : 1
05- Ap r- 2016 2: 24 p.m.
B: static structural Equivalent stress Type: equivalent (von Mises) stress Unit: MPa Time: 1
07-Apr-2016 11:36 p.m. B: static structural Total deformation Type: total deformation Unit: m
Time: 1
07-Apr-2016 7:02 p.m. A: static structural Total deformation Type: total deformation Unit: m
Time: 1
04-Apr-2016 12:57 p.m.
Figure 14. Delection of mid-wing.
on carbon rods is negligible when compared to its permissible stress. he red portion is only observed on the carbon iber rods, whereas the balsa wood portion is blue in a color which is the minimum stress. Hence, all the parts are under the safer limit even under a factor of safety equal to 2.
RESULTS AND CONCLUSION
J. Aerosp. Technol. Manag., São José dos Campos, Vol.8, No 4, pp.397-407, Oct.-Dec., 2016 407 Design Analysis of Solar-Powered Unmanned Aerial Vehicle
REFERENCES
AirfoilTools.com (2016) Airfoil tools; [accessed 2016 Aug 11]. http://airfoiltools.com/index
Bandel A (2015) Aviation studies design build and fly minor. Amsterdam: University of Applied Sciences.
Bansal RK (2010) A textbook of the strength of materials. Bangalore: Laxmi Publications.
Bruscoli S (2011) Airfoil optimization for a solar powered aircraft (PhD thesis). Pisa: Università degli Studi di Pisa.
GoodWinds Composites (2016) Carbon rods; [accessed 2016 Aug 11]. Available: http://gwcomposites.com/carbon-rods/
Jashnani S, Nada TR, Ishfaq M, Khamker A, Shaholia P (2013) Sizing and preliminary hardware testing of solar-powered UAV. The Egyptian Journal of Remote Sensing and Space Sciences 16(2):189-198. doi: 10.1016/j.ejrs.2013.05.002
Kederoglu OG, Yanbastioglu S, Saraç B, Kocaoğlan MH (2012) Solar powered aircraft: PV Power System Definition & Solution Development Project; [accessed 2016 Aug 11]. http://www. academia.edu/7515954/Solar_Powered_Aircraft_Project
Kumar G, Sepat S, Bansal S (2015) Review paper of solar-powered UAV. International Journal of Scientific & Engineering Research 6(2):41-44.
MakeitFrom.com (2016) Balsa; [accessed 2016 Aug 11]. http:// www.makeitfrom.com/material-properties/Balsa/
Noth A (2008) Design of solar powered airplanes for continuous flight (PhD thesis). Zürich: ETH Zürich.
Simons M (1994) Model aircraft aerodynamics. 3rd edition. Hemel Hempstead: Argus.
lit-to-drag ratio. It was presented a way to calculate a number of solar cells required for giving enough power to the motor lift the 2-kg plane, which can extend for heavier ones. It was performed detailed energy and power analysis to check whether the design would be feasible or not. hen, all the components were designed, considering various factors for better performance, and analyzed for delection and stress to keep the design under the safer limit. his gives a basic foundation in order to fabricate a solar-powered UAV.
ACKNOWLEDGEMENTS
We wish to express our profound gratitude and indebtedness to Prof. M. Natarajan, for his inspiring guidance, and Prof.
Arivazhagan N, for granting permissions to use the required equipment during the course of this research. We would also like to show our gratitude to Team Vimaanas, VIT University, which provided insight and expertise that greatly assisted the research.