Repositório ISCTE-IUL
Deposited in Repositório ISCTE-IUL: 2020-02-26
Deposited version: Post-print
Peer-review status of attached file: Peer-reviewed
Citation for published item:
Gulamhussen, M. A., Pinheiro, C. M. & Pozzolo, A. F. (2017). Do multinational banks create or destroy shareholder value? A cross-country analysis. Financial Markets Institutions and Instruments. 26 (5), 295-313
Further information on publisher's website: 10.1111/fmii.12091
Publisher's copyright statement:
This is the peer reviewed version of the following article: Gulamhussen, M. A., Pinheiro, C. M. & Pozzolo, A. F. (2017). Do multinational banks create or destroy shareholder value? A cross-country analysis. Financial Markets Institutions and Instruments. 26 (5), 295-313, which has been published in final form at https://dx.doi.org/10.1111/fmii.12091. This article may be used for non-commercial purposes in accordance with the Publisher's Terms and Conditions for self-archiving.
Use policy
Creative Commons CC BY 4.0
The full-text may be used and/or reproduced, and given to third parties in any format or medium, without prior permission or charge, for personal research or study, educational, or not-for-profit purposes provided that:
• a full bibliographic reference is made to the original source • a link is made to the metadata record in the Repository • the full-text is not changed in any way
The full-text must not be sold in any format or medium without the formal permission of the copyright holders. Serviços de Informação e Documentação, Instituto Universitário de Lisboa (ISCTE-IUL)
Av. das Forças Armadas, Edifício II, 1649-026 Lisboa Portugal Phone: +(351) 217 903 024 | e-mail: [email protected]
Do multinational banks create or destroy shareholder value?
A cross-country analysis
*M. A. Gulamhussen
(ISCTE-IUL Business School & Vlerick Business School) Carlos Manuel Pinheiro
(Caixa Geral de Depósitos, Lisbon Accounting and Business School) Alberto Franco Pozzolo**
(Università degli Studi del Molise)
Abstract
We question whether the international diversification of multinational banks creates or destroys shareholder value. Based on a sample of 384 listed banks from 56 countries we provide new and robust evidence that bank cross-border activities create shareholder value, as shown by an economically and statistically significant premium for international diversification. Our results are confirmed controlling for bank fixed effects, time-varying bank characteristics, reverse causality, functional diversification, and instrumenting for the choice to expand abroad. The increase in shareholder value is slightly larger for banks in the middle range of international diversification and in the case of expansion towards less developed countries.
JEL classification: F23; G20
Keywords: Foreign Direct Investment; Banks; Tobin’s q
* MAG would like to acknowledge financial support from FCT and administrative support from ISCTE-IUL We thank Ines Chaieb, Roberta De Filippis, Geoffrey Jones, Mara Faccio, Phil Molyneux, Luca Papi, Nikolaos Papanikolaou, Alberto Sorrentino, Larry Wall and seminar participants at Bangor Banking Seminar Series, the 51st annual meeting of the Italian
Economic Association; the XIX International Tor Vergata Conference on Money, Banking and Finance; the 8th Paris
December 2010 Finance Meeting; the 60th Midwest Finance Association 2011 Conference; the International Finance and
Banking Society 2011 Conference; and the International Economic Association 2011 Conference for their comments and suggestions.
**Address for correspondence: Alberto Franco Pozzolo Università degli Studi del Molise, Dipartimento di Economia, gestione, società e istituzioni, Via De Sanctis, 86100 Campobasso, Italy. Phone +390874404334, Fax +39087498043, e-mail [email protected].
2
1.
Introduction and motivationsMultinational corporations are a distinctive feature of today’s global economy. And among multinational corporations, multinational banks have a prominent role: according to Forbes, three of the five largest multinational corporations in the world are banking groups. Indeed, in the years prior to the 2007-2008 financial crisis, global players such as Citigroup (300,000 employees, approximately 16,000 offices and over 200 million customers in 140 different countries) and HSBC (330,000 employees, 8,500 offices and 128 million customers in 86 countries) were viewed as trademarks of globalization.
A large number of studies has analyzed the determinants, the patterns and the consequences of the cross-border expansion of banking groups (Goldberg, 2004), with an increasing attention, after the 2007-2008 financial crisis, to understanding their role in spreading domestic shocks worldwide (Albertazzi and Bottero, 2014; Cetorelli and Goldberg, 2012a and 2012b). However, this large amount of research has not yet lead to a consensus view on international banking. For example, while some studies show that domestic and cross-border expansions of banks are beneficial for the economy (Jayaratne and Strahan, 1996; Morgan and Strahan, 2004; Hauswald and Bruno, 2014), most analyses find weak evidence of economies of scale or scope, efficiency improvements, or an increase in shareholder value (DeLong, 2001, and Cornett et al., 2003). This picture is even less clear when it comes to understanding whether bank internationalization creates or destroys shareholder value. While recent evidence shows the earnings-to-price ratios and the returns of multinational firms in the manufacturing sector are on average above those of other firms (Fillat and Garetto, 2014), no evidence is available for the banking sector.
The discussion on internationalization is part of a broader debate on the benefits and costs of focusing or diversifying the activities of firms, that has a long tradition in the economic and
3
business literatures. From a theoretical point of view, the arguments in favor of diversification can be grouped into three main categories. According to the market power view (Edwards, 1955), firms have an incentive to diversify their lines of business as they can extend their market power from one sector to another through predatory pricing, collusion with other large and diversified companies, and the exclusion of smaller competitors (Montgomery, 1994; Villalonga, 2004a and 2004b). This argument applies also to the case of banks: according to Sharpe (1990) and Rajan (1992), lending relationships give banks a monopoly on information about their borrowers that can be exploited to gain monopoly power across the functional and geographic dimension (e.g., Petersen and Rajan, 1994). For this reason, both functional and geographic internalization predominates in banking with respect to other forms of entry into foreign markets such as licensing and franchising (Jones, 1992). The second argument in favor of diversification is based on better resource management and hinges critically on the presence of economies of scope. In the case of banks, the importance of intangible technical, market-making and managerial assets can be reinforced by the presence of monopolistic information on borrowers. A parallel justification, hinging more on the financial aspects of firm management, is that diversification reduces the effect of idiosyncratic shocks on cash flow variance, thereby increasing the stock market value (Lewellen, 1971). Developing on this idea, Fillat and Garetto (2014) and Fillat et al. (2015) have recently proposed a framework presenting a trade-off between the benefits of international risk diversification and the fixed and sunk costs of entry into foreign markets. Finally, the third argument is based on lower agency costs centers on the functioning of firms’ internal capital markets (Houston et al., 1997). The key insight is that firms’ internal cash flows are a less expensive source of funds than external capital so that better informed insiders can increase firm value by selecting the most remunerative projects instead of paying out dividends that would be invested elsewhere by less informed outsiders (Stein, 1997; Cremers et al., 2008). Clearly, this
4
argument applies also to the case of financial intermediaries (Barba Navaretti et al., 2010; de Haas and Lelyveld, 2010).
An equally large number of arguments oppose the positive view of diversification. Starting from the seminal contribution by Jensen and Meckling (1976), a number of papers have emphasized the role of conflicts of interest between insiders and outsiders (Jensen and Murphy, 1990; Shleifer and Vishny, 1990a and 1990b; Jensen, 1986; Amihud and Lev, 1981). In addition, diversification may also negatively affect firm value by reducing its efficiency, e.g., by introducing expensive additional layers of administrative and corporate control, and by allocating resources inefficiently across different activities. These problems are particularly acute in the case of banks, as their activity is typically less based on hard information and they are therefore more difficult to monitor for external investors (Morgan, 2002).
As the theoretical literature has provided numerous explanations for why diversification can either increase or decrease the value of a firm, the ultimate answer on its actual effects has been actively searched through the empirical analysis. The typical exercise in this literature compares the value of a conglomerate (e.g., its Tobin’s q) with the imputed value obtained considering each segment of its activities as a stand-alone firm, using the so called “chop-shop” approach initially proposed by LeBaron and Speidell (1987). But, unfortunately, also the empirical research provides a rather mixed picture, with evidence both in favor and against the presence of a diversification premium.1
In the case of banks, a number of papers have recently started to study the link between diversification and the value banks using the methodology followed by the literature on manufacturing firms. Using a large set of banks from over 40 countries, Laeven and Levine (2007)
1 See Martin and Sayrak (2003) for a survey of the empirical evidence and Villalonga (2004a and 2004b) for more
5
show that functionally diversified banks have a significantly smaller Tobin’s q than less diversified counterparts. Schmid and Walter (2009) confirm this result for a large sample of U.S. banks. Results focusing on European financial markets are more mixed. Baele et al. (2007) report a positive and strong relationship between measures of lending and nonlending activities, and banks’ Tobin’s q, and a nonlinear relationship between the stated measures and bank-specific risk measured by banks’ stock market excess returns. Moreover, van Lelyveld and Knot (2009) find no evidence of a structural diversification discount when studying a sample of European banks, although they present some evidence that the largest banks have more opportunities for inefficient cross-subsidization across different business lines.
As a specific form of diversification, geographical expansion is a parallel dimension of importance. In the case of manufacturing firms, the extensive literature on the effects of plant and cross-border expansion of manufacturing firms has analyzed nearly all possible dimensions of a firm’s performance (Caves, 1996; Markusen, 2004; Barba Navaretti and Venables, 2004; Helpman, 2006). On the specific issue of the firm’s value, some authors find a low effect of multinationality (Morck and Yeung, 1991; Denis et al., 2002; Moeller and Schlingemann, 2005), while other find a substantial impact on returns and earnings (Fillat and Garetto, 2014).
In the case of banks, the motivations for geographical diversification can be different than that of manufacturing firms (Buckley and Casson, 1976; Williams, 1997), because of factors such as the role of information, the importance of a physical presence to develop the personal relationships that are essential to the supply most retail financial services (Rajan, 1998), the value of intangible assets and reputation, the role of regulation (John et al., 2000), and the importance of the institutional features of countries. However, also in this case, the evidence is far from conclusive. On the one hand, Deng et al. (2007) show that domestically diversified banks pay lower bond spreads and Deng and Elyasiani (2008), in a paper more closely related to ours, show
6
that interstate diversified banks have a higher Tobin’s q, although an increase in the distance between the holding company and its branches has a negative effect on bank value. But, on the other hand, a recent contribution by Goetz et al. (2013), where they exploit exogenous changes in U.S. interstate bank regulation to address the issue of reverse causality, provides convincing evidence of the existence of a geographic diversification discount.
Aside from the fact that the results on the effects of domestic geographic diversification are not yet unequivocal, it would be also rather questionable to extend them to the case of cross-border expansions, because of the rather different nature of the two processes, due for example to the impact of cultural and regulatory differences. Nonetheless, while the tremendous expansion of banks cross-border activities of the last decades has been studied comprehensively in the literature (e.g., Focarelli and Pozzolo, 2001 and 2005; Buch and DeLong, 2004; Claessens and van Horen, 2014; Caiazza et al., 2012), the effects of international diversification on shareholder value have not yet been analyzed in detail, with very few exceptions.2
In this paper, we fill this gap by determining whether international diversification of multinational banks creates or destroys shareholder value. In order to answer our questions, we follow the methodology developed by Laeven and Levine (2007) to study whether the diversity of activities of U.S. banks creates or destroys shareholder value. We compare the value of internationally diversified commercial banks with that of domestically focused banks, construct a measure of each bank’s excess value, and relate the different measures of international diversification to excess values whilst also controlling for a host of institutional and regulatory
2 Outreville (2010) finds a non linear relationship between profitability and international diversification in a sample of
the 50 world largest banks between 2003 and 2006, while Amihud et al. (2002), Cybo-Ottone and Murgia (2000) and Campa and Hernando (2006) provide evidence of negative or null effects of cross-border M&A announcements on stock market prices.
7
influences. Our study, based on a sample of 384 banks from 56 countries between 2001 and 2007, does not allow us to reject our main hypotheses.
We find evidence of a statistically and economically significant increase in shareholder value (international diversification premium): internationally diversified banks can have an excess Tobin’s q nearly twice that of more domestically focused intermediaries. Most notably, our findings remain robust after controlling for bank fixed effects, time-varying bank characteristics, reverse causality, functional diversification, and instrumenting for the choice to expand abroad.
The rest of the paper is organized as follows. Section 2 presents our data and our empirical strategy. The results are presented in Section 3. The final section concludes and discusses some open issues.
2. Data and Empirical Setup 2.1. Data
We collected bank level data from Bankscope (Fitch Ratings, Bureau van Dijk), a comprehensive database for cross-country analyses of banking activity. We focus on commercial banks, which have compelling reasons for international diversification due to the possession of soft information and intangible assets that are extremely difficult to transact via external markets and contractual arrangements.
To assemble our data, we first extracted yearly accounting and market data for the 2001-2007 period on all listed commercial banks available with total assets in excess of US$ 100 million. We excluded smaller banks to avoid introducing noise in the sample as they can face more challenges in international diversification than large banks. We also excluded banks headquartered in off-shore financial centers, such as Bermuda, Gibraltar, the Virgin Islands or the Cayman Islands, as this would hinder comparability across countries. We went through a painstaking effort to clean
8
and complement the information downloaded from Bankscope to avoid incongruent and missing data on crucial accounting and market variables. In particular, when information was not available in Bankscope, we complemented the database using data from Worldscope and individual bank websites, based on ISIN codes. Our data assembling exercise yielded a sample of 577 commercial banks and 4,039 bank-year observations. In matching our initial 577 publicly traded banks with yearly data on bank subsidiaries, we ended up with 384 banks headquartered in 56 countries for which time-varying data on subsidiaries was available.3 The period of analysis spans the years between 2001 and 2007. We stopped our analysis before the beginning of the financial turmoil to avoid that crisis-specific effects and possible structural breaks might confound our results. In fact, empirical studies on crises are mostly limited to the unstable periods (see e.g., De Young and Toma, 2013 for a recent analysis of the 2008-2010 crisis period).
2.2. Empirical Setup
Our empirical model is designed to test the influence of measures of international diversification on the excess shareholder value (increase: premium or decrease: discount) of banks. To test our main hypotheses, we estimate the following general specification:
excess valuejt = α + international diversificationjt + γ controlsjt + εjt, (1)
where the measures of excess value (excess value) and of international diversification (international diversification) refer to bank j at time t; the controls include time-varying bank-specific characteristics and time and country dummy variables; εjt is an error term.
3 The 56 countries in our sample are Australia, Bangladesh, Belgium, Brazil, Canada, China, Colombia, Croatia, Czech
Republic, Denmark, Egypt, Estonia, Finland, France, Germany, Greece, Hong Kong, India, Indonesia, Ireland, Israel, Italy, Japan, Jordan, Kenya, Rep. of Korea, Kuwait, Lebanon, Lithuania, Malaysia, Netherlands, Oman, Pakistan, Peru, Philippines, Poland, Portugal, Qatar, Romania, Saudi Arabia, Singapore, Slovakia, Slovenia, South Africa, Spain, Sri Lanka, Sweden, Switzerland, Taiwan, Thailand, Tunisia, Turkey, United Arab Emirates, United Kingdom, United States, and Venezuela.
9
Dependent variable: Excess value. For each bank j, excess value is defined as a bank’s Tobin’s q
minus its imputed q. We compute the Tobin’s q as the ratio of the sum of the market value of common stocks, the book value of preferential shares and minority interests, and the book value of debt to the book value of total assets (see also Linderberg and Ross, 1981; Sweeney et al., 2001; Goetz et al., 2013).
For the imputed q, we use the well-known “chop-shop” method (adopted also by Dastidar, 2009, and Laeven and Levine, 2007). In the original “chop-shop” approach (LeBaron and Speidell, 1987), the Tobin’s q of each firm is compared with the q that the firm would have if it were “chopped” into separate “shops”. In our setup, we should therefore compare a bank’s q with the q that it would have if it were “chopped” in two, i.e., into an internationally diversified bank and a domestic undiversified bank. If we knew the Tobin’s q of the internationally diversified bank (qint)
and of the domestic bank (qdom), the imputed q of a bank with a share of internationally diversified
activities and a share (1 – ) of domestic activities would be: φ qint + (1 – φ) qdom. In practice, we
do not have a precise measure of the Tobin’s q of internationally diversified and domestic banks and we therefore use an approximation. For each bank j, we compute an index of international diversification defined as αj = nj / nmax, where nj is the average number of foreign countries in which
bank j has a subsidiary during our sample period and nmax is the same number of countries in which
the most internationally diversified bank is present. We then define Tobin’s q of an internationally diversified bank (qint) as the average of the qs of banks with αj above the 70% threshold and that of
a domestic bank (qdom) as the average of the qs of banks with αj lying at or below the 30% threshold.
A number of robustness checks confirm our results also using thresholds at 90%-10% and at 70%-10%. Excess value is therefore defined as:
10
This measure is built as a deviation from the benchmark of multinational banks and, unlike plain Tobin’s q, it permits a better identification of the effects of international diversification. Our variable excess value gauges bank diversity across countries, as compared to the same variable computed by Laeven and Levine (2007) for diversity of U.S. bank activities.
Independent variables: International diversification, international share and international broadening. We construct three different measures of international diversification, each measure
allowing banks to be positioned over a continuum, with the lower bound corresponding to purely non-diversified (domestic) banks and the upper bound to the most geographically diversified banks.
Our first measure, which we label international diversification, is the index defined above and is computed for each bank in each year. Formally, it is given by:
,
where nj,t is the number of foreign countries in which bank j has a subsidiary in year t, and nmax,t is
the maximum number of foreign countries in which the most diversified bank has subsidiaries in year t. International diversification is a stock variable that is continuous and bounded between 0 and 1. Purely domestic banks take the value 0 (i.e., no international diversification); values close to 1 indicate more internationally dispersed banks. This index normalizes the measure of international diversification by accounting for the yearly variation of the most diversified banks.
Our second measure, which we label international share, proxies international diversification through the share of assets on a country-by-country basis, thus considering the asset dispersion across subsidiaries (similar to Buch and Lipponer, 2007). Formally, this is computed as:
1 − (𝑡𝑜𝑡𝑎𝑙 𝑠𝑢𝑏𝑠𝑖𝑑𝑖𝑎𝑟𝑖𝑒𝑠 𝑎𝑠𝑠𝑒𝑡𝑠 − 𝑓𝑜𝑟𝑒𝑖𝑔𝑛 𝑠𝑢𝑏𝑠𝑖𝑑𝑖𝑎𝑟𝑖𝑒𝑠 𝑎𝑠𝑠𝑒𝑡𝑠 𝑡𝑜𝑡𝑎𝑙 𝑠𝑢𝑏𝑠𝑖𝑑𝑖𝑎𝑟𝑖𝑒𝑠 𝑎𝑠𝑠𝑒𝑡𝑠 ) n n t t j max, ,
11
and it is thus bounded between 0 and 1, with values close to 0 indicating low international diversification and values close to 1 indicating high international diversification.
Our third measure, which we label international broadening, proxies international diversification through a transformed Hirsch-Herfindhal index (Mercieca et al., 2007) computed for each bank and on a country-by-country basis. Formally, the index is:
1 − ∑ ( 𝑠𝑢𝑏𝑠𝑖𝑑𝑖𝑎𝑟𝑦 𝑎𝑠𝑠𝑒𝑡𝑠𝑗
𝑡𝑜𝑡𝑎𝑙 𝑠𝑢𝑏𝑠𝑖𝑑𝑖𝑎𝑟𝑖𝑒𝑠 𝑎𝑠𝑠𝑒𝑡𝑠) 2 𝑛𝑗
𝑗=1
This measure is again bounded between 0 and 1, with values close to 0 indicating low international diversification and values close to 1 indicating internationally dispersed banks.
Bank controls. Equation (1) includes a set of time varying bank-specific characteristics that are
likely to impact bank value and at the same time may be related to the degree of its international diversification. First, we consider a measure of bank size: the logarithm of total assets (log assets). Larger banks are typically more diversified than smaller institutions and this has an impact on their value, irrespective of their international diversification. Moreover, as shown during the recent crisis, size is also a good proxy of the value of the implicit insurance guarantee granted to “too-big-to-fail” institutions, which also has an impact on company value.
Second, since it can be argued that international diversification cannot be considered separately from functional diversification (Goetz et al., 2013), we include an additional control capturing this characteristic. Following Laeven and Levine (2007) and Schmid and Walter (2009), we construct a functional diversification measure based on the broad taxonomy in which commercial bank activities are classified – traditional (taking deposits and making loans) and nontraditional (e.g., security and foreign exchange trading and provision of fee-based services). Income diversification is therefore computed as:
12
1 − |𝑛𝑒𝑡 𝑖𝑛𝑡𝑒𝑟𝑒𝑠𝑡 𝑖𝑛𝑐𝑜𝑚𝑒 − 𝑜𝑡ℎ𝑒𝑟 𝑜𝑝𝑒𝑟𝑎𝑡𝑖𝑛𝑔 𝑖𝑛𝑐𝑜𝑚𝑒
𝑡𝑜𝑡𝑎𝑙 𝑜𝑝𝑒𝑟𝑡𝑎𝑖𝑛𝑔 𝑖𝑛𝑐𝑜𝑚𝑒 |
where other operating income is the sum of investment income, foreign exchange income, gain (or loss) on sale of securities, trading account income, and commissions and fees. This index takes values between 0 and 1, and it is increasing in the degree of functional diversification. In a similar vein, and based on the same authors we enter an index of asset diversity:
1 − |𝑛𝑒𝑡 𝑙𝑜𝑎𝑛𝑠 − 𝑜𝑡ℎ𝑒𝑟 𝑒𝑎𝑟𝑛𝑖𝑛𝑔 𝑎𝑠𝑠𝑒𝑡𝑠
𝑡𝑜𝑡𝑎𝑙 𝑒𝑎𝑟𝑛𝑖𝑛𝑔 𝑎𝑠𝑠𝑒𝑡𝑠 |
where net loans are net of loan loss provisions and other earning assets include all other earning assets apart form loans (e.g. securities).
Finally, since profitability and the financial capital can also affect company value, we control for these characteristics including the value of returns on assets and a measure of leverage, the ratio of equity to total assets.
2.3. Summary statistics
Summary statistics are presented in Table 1. Our baseline dependent variable, excess value calculated using the 70%-30% thresholds, and the independent variable of interest, international diversification, are presented along with a number of bank-specific characteristics introduced in the econometric specifications presented below. Our regression sample includes 120 international banks; with an average of 6 foreign subsidiaries and a median of 3. Among the banks with the higher index of international diversification, our sample includes ABN Amro and ING (Netherlands), BNP Paribas and Société Générale (France), Citibank (U.S.), HSBC and Royal Bank of Scotland (U.K.), Deutsche Bank (Germany), Unicredit (Italy), and BBVA (Spain). The sample also includes as controls 234 pure domestic banks, for which international diversification is zero, such as 1st Source Bank, Citizens Bank (U.S.) and Howa Bank (Japan). According to
13
international diversification, the median bank in our sample is domestic; among international banks, the median bank has five cross-border subsidiaries. All G7 and European countries are represented by about 10 banks, except Japan and in the US that constitute the majority of our estimation sample. Finally, not all banks appear for all 7 years in our sample period because of to data availability problems.4
Excess value, our dependent variable, ranges from -0.17 at the 1st percentile to 0.50 at the 99th, with a marginally positive mean, and has an extremely large coefficient of variation of 120. For this reason, in the econometric analysis we trim our data keeping only observations for which excess value is within the 5th percentile and the 95th percentile of its distribution. Excess value ranges in this case from -0.12 to 0.22 and has a coefficient of variation of 6.1.5 All measures of international presence show significant but not excessive variability. Bank total assets range from 171 millions at the 1st percentile to 9.12 billions at the 99th percentile, with a coefficient of variation of 1.14. Reassuringly, the ratio of debt to total assets, a key item to calculate Tobin’s q, has a limited variability, with a coefficient of variation of 0.09.
3. Empirical Findings 3.1. Baseline specification
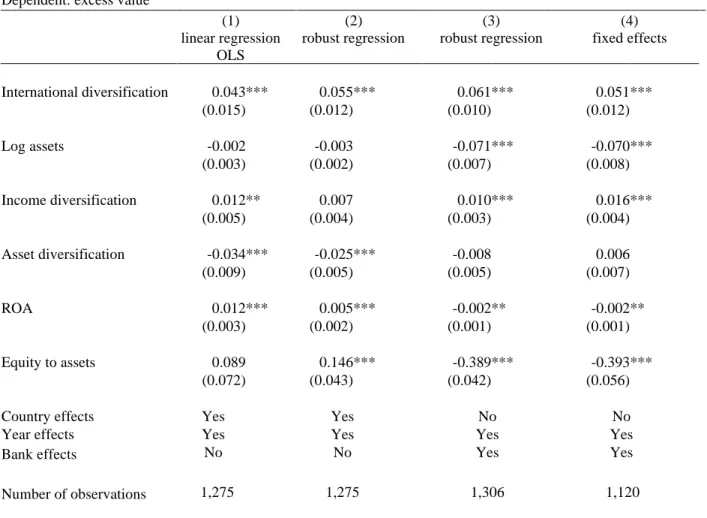
Table 2 reports the results of the estimation of equation (1). All specifications include year dummies to control for possible common shocks on bank value. Panel 1 includes the results of estimates of a linear regression model with country fixed effects, thus allowing us to exploit the
4 To account for these characteristics of our dataset, we conduct robustness checks excluding Japanese and U.S. banks
from the estimation sample, and focusing on the narrower sample including banks for which information is available for all 7 years.
5 In unreported regressions, available upon request, we have verified that our results are confirmed using robust
14
within country-year variation in international diversification.6 Panels 2 and 3 report the results obtained from robust regressions, that allow to control that our results are not driven by extreme values (Li, 1985), including respectively country fixed effects (Panel 2) and bank fixed effects (Panel 3). Panel 4 presents the results obtained with a standard panel estimator with fixed effects, that was chosen because the Hausman test did not allow to reject the hypothesis of independence of the random effects. However, the fixed effect model was estimated excluding from the sample the 186 bank/year observations to which the biweight function of the robust regression model – applied with standard parameters guaranteeing a bit less than 95% of the efficiency of OLS – gave a weight of zero.7 In unreported regressions, available upon request, we have verified that including these outliers the coefficient of international diversification is still positive, but it is statistically insignificant. Moreover, to control that dropping the outliers only removes noisy observations and does not introduce a bias, we have verified that the coefficient of international diversification obtained estimating model (1) on the sample of observations with zero weight from the biweight function is statistically insignificant.
Overall, our results reveal an international diversification premium that is both economically and statistically significant: the coefficient of international diversification is positive and statistically significant in all four specifications, at the 5% confidence level in Panel 1 and at the 1% level in Panels 2 and 3 and 4. Moreover, since our results are confirmed also including bank
6 See for example Beck et al. (2013) for a similar methodology when analyzing the cross-country variation in the
relationship between bank competition and bank stability.
7 Defining e
i = yi – Xi as the ith-case residual and ui = ei /s as the ith scaled residual, where s = M/0.6745 is the
residual scale estimate and M = median(|ei − median(ei)|) is the median absolute deviation from the median residual,
the biweight function assigns weights wi = [1 − (ui /cb)2]2 if |ui| ≤ cb and wi = 0 if |ui| ≤ cb. Hamilton (1991) shows
that setting cb = 4.685, that corresponds to cases where absolute residuals of about 7M or more are assigned 0 weight,
gives about 95% of the efficiency of OLS when applied to data with normally distributed errors. In our analysis we have chosen to drop cases where absolute residuals are larger than about 6M, but in unreported regressions we have verified that the results of the fixed effect panel regression model are confirmed also dropping observations where absolute residuals are larger than 7M or 8M. For an introduction to robust regression techniques, see Li(1985)
15
fixed effects, we deduce that a bank increasing its international diversification augments its value. Interestingly, the international diversification premium is found even if we control for functional diversification.
Consistent with part of the previous literature, larger banks have a lower excess value. Moreover, asset diversity has a negative effect on excess value, consistent with the findings of Laeven and Levine (2007) and Goetz et al. (2013), while income diversity has instead a positive effect (Apergis, 2014 found a similar result for U.S. banking institutions). Finally, return on assets (ROA), and leverage (equity to total assets) show mixed results, suggesting the existence of a weak link between banks’ profitability and capitalization and their excess market value. Reassuringly, in unreported regressions available upon request we have verified that the increase in shareholder value (international diversification premium) is confirmed also excluding one at a time the additional bank controls.
3.2. Robustness checks
Table 3 reports the results of six robustness checks obtained using two alternative measures of international diversification (Panels 1 and 2), two alternative thresholds of excess value (Panels 3 and 4), excluding banks with large changes in the value of total assets, since these could introduce confounding effects on the excess market value and are most likely due to corporate operations such as mergers and acquisitions (Panel 5), and entering the change in Tobin’s q as the dependent variable (Panel 6).
The alternative measure of international diversification that we use are the share of assets deployed in foreign subsidiaries relative to the total assets of the bank (international share), and the concentration of foreign subsidiaries’ assets, proxied by a modified Hirsch–Herfindhal index (international broadening). Both measures are in line with those used by Laeven and Levine (2007). The results reported in Panels 1 and 2 of Table 3 confirm our previous findings. Reassuringly,
16
excess value is positive and significantly related to the total share of assets of foreign subsidiaries (international share) and the modified Hirsch–Herfindhal index (international broadening), with coefficients that are statistically significant at the 5% level.
Panels 3 and 4 of Table 3 report the results using the baseline measure of international diversification at the 90%-10% and at the 70%-10% thresholds, respectively. In both cases, we find a statistically significant diversification premium (at the 1% level).8
Next, we have controlled for major changes in banks’ total assets. In particular, we have excluded observations for which the rate of change of bank total assets between years t-1 and t exceeds 30%. The results, reported in Panel 5 of Table 3, confirm the diversification premium, significant at the 1% level.9
Finally, since valuation might be increasing for the sampled banks, in Panel 6 of Table 3 we have estimated our model using as a dependent variable the change in excess Tobin’s q and measuring international diversification and all other bank characteristics at the beginning of the period, while also controlling for bank fixed effects and dropping the observations to which the biweight function of the robust regression procedure assigns a weight of zero. The results in Panel 6 of tracing out the influence of geographic diversification on shareholder value show that the coefficient of geographic diversification is in this case negative and statistically significant. Taken together with the level results, these findings imply that international diversification increases bank excess value but has a negative impact on its rate of growth.
8 In unreported regressions, we also verified that our results are confirmed when we exclude the U.S. and Japan
alternately from the sample, as they represent 9.4% and 17.0% respectively of the sampled banks. Moreover, we verified that the results are confirmed also considering only banks that are present all 7 years or at least 6 out of the 7 years of our estimation sample, respectively.
9 In unreported regressions, we verified that our results are confirmed excluding observations with a rate of growth of
total assets of 40% and 25%, or excluding observations for banks that had been involved in M&As: a) in the previous year, b) in the previous two years, c) in the previous four years, or d) in any previous year.
17
An additional concern is that there might be a trend in excess value that starts before international diversification takes place. As argued by Goetz et al. (2013), if banks that eventually diversify were already experiencing a trend in their excess value, this would lead to the same results that we have found even in absence of a diversification premium. If that were the case, our increase in shareholder value would reflect pre-diversification trends rather than an increase in excess Tobin’s q due to the exogenous changes in international diversification. To exclude this hypothesis, we have followed the same methodology that Goetz et al. (2013) used to draw Figure 1, estimating the following regression:
excess valuejt = α + -4 D-4t + + -3 D-3t + -2 D-2t + -1 D-1t + +1 D+1t + +2 D+2t +
+ +3 D+3t + +4 D+4t + DUi + DUjt + εjt, (2)
where D-st takes the value of one for banks in the sth year before the bank passed from being
domestic to being internationally diversified, the threshold below which we consider banks to be nearly domestic, and D+st takes the value of one for banks in the sth year after the bank passed the
same threshold; DUj are bank fixed effects, DUit are country-year fixed effects and εjt is an error
term. Figure 1 presents the coefficients and the 95% interval band. Clearly, there is no trend before or after a bank ceases to be domestic, suggesting that our results are not driven by exogenous trends in excess value.10 These results reassuringly confirm our identification strategy.
Since having operations in the highly developed economies is different from operating in lower or middle income countries, we have also conducted additional robustness checks for two subsamples of foreign destination countries. Panel 1 of Table 4 presents the results of estimates of equation (1) considering only international diversification towards lower income and middle
10 In unreported regressions we have confirmed the absence of trends in excess value also defining the dummy variables
in equation (8) as positive in all cases when a bank increased its international diversification, and using a robust regression technique.
18
income countries, while Panel 2 focuses on OECD and other high income countries, according to the World Bank classification. Interestingly, while the international diversification premium is confirmed for both samples, and can therefore be generalized worldwide, the magnitude of the coefficient of international diversification is larger for less advanced economies.
3.3. Reverse causality
As argued in the most recent literature on corporate diversification, the factors underpinning the decision to diversify across borders can be the same as those causing the change in the market value of the bank (Campa and Kedia, 2002; Deng et al., 2007; Laeven and Levine, 2007; Lang and Stulz, 1994). Although the finding that more diversified banks are attributed greater value by the market than less diversified or domestic banks is in itself interesting, it does not constitute sufficient proof
per se of the causality effect because overvaluation could precede diversification (Goddard et al.,
2008). In other words, international diversification could be an endogenous choice because commercial banks that are more valued by the market, correspondingly with a Tobin’s q larger than the benchmark, may be more likely to diversify their activities entering foreign countries. For instance, ABN Amro, BBVA, BNP Paribas, CIT Group Inc., Goldman Sachs, and UBS all exhibit positive excess values and are present in more than 40% of the sampled countries. This begs for using instruments that ring fence the causal impact of diversification on valuation (Goetz et al., 2013).
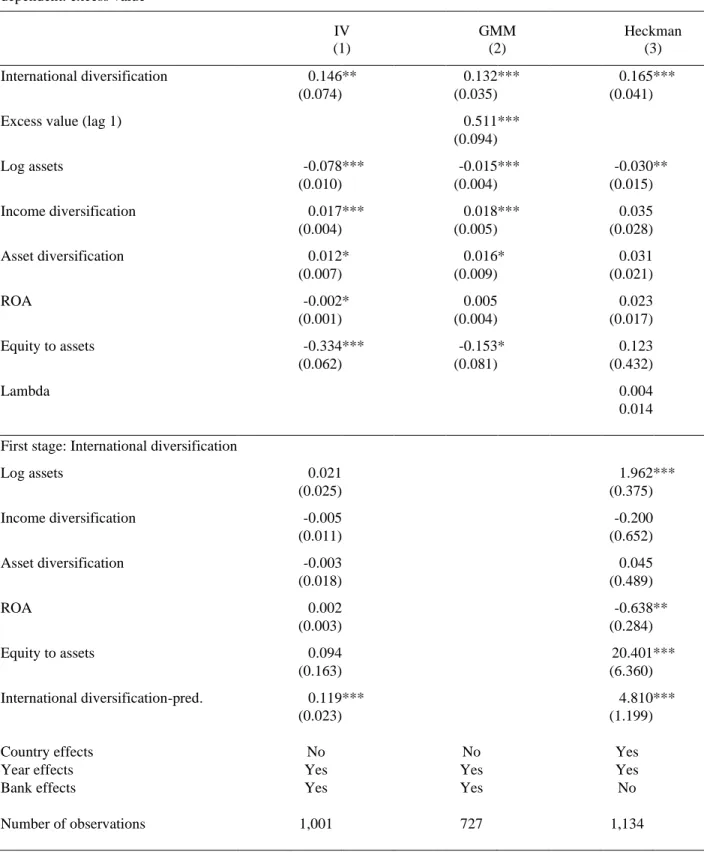
We address the potential endogeneity issue in three different ways. First, we re-estimate our baseline specification using the instrumental variables (IV) method. Following Goetz et al. (2013), we use a gravity model strategy inspired by Frankel and Romer’s (1999) seminal study of international trade and growth. This framework differentiates among banks in the same country, since it estimates the degree of international diversification of each bank weighed by the share of foreign assets it holds in every foreign country. We proceed in two steps: we estimate a gravity
19
equation where the presence of a foreign subsidiary of a bank in any of the possible destination countries in our sample is explained by the geographical distance and the ratio of per capita GDP and total population in the home country and host countries. Then, for every year in our sample period, we compute each bank’s predicted level of international diversification as the ratio of the number of countries where it is predicted to be present and the number of countries where the most internationally diversified bank is predicted to be present. Finally, the predicted level of international bank diversification is then used as an instrumental variable that we enter in the first-stage of our IV regression.
Reassuringly, the results reported in Panel 1 of Table 5 show that the coefficient of international diversification is positive and statistically significant also in this case, providing further support to the robustness of our previous findings. Moreover, the validity of our instrument is confirmed by the F-test of the joint significance of the regressors in the first stage estimates. Interestingly, the size of the coefficient of international diversification is much larger than that of the baseline specification, suggesting that, if anything, the endogeneity bias was against finding an international diversification premium. Indeed, the negative sign of the endogeneity bias is consistent with the findings of Goetz et al. (2013), which apply the same methodology to the case of U.S. states.
Since bank excess value is likely to be time-persistent, as a second attempt to tackle the potential problems of reverse causality we expand the baseline specification by including the lagged dependent variable and use the generalized method of moments (GMM) estimator developed for the dynamic panel data model (Arellano and Bond, 1991; Arellano and Bover, 1995), including the same set of instruments discussed above.11 Panel 2 of Table 5 shows that the lagged
20
dependent variable is indeed positive and statistically significant. Reassuringly, the coefficient of international diversification is positive and statistically significant also in this case. A test of the hypothesis of the lack of correlation between the instruments and residuals, as well as the value of the Hansen statistic for over-identifying restrictions and the value of the test for absence of second-order serial correlation of residuals, all point to the validity of our specification.
Finally, we consider an alternative way to address the problem of nonrandom or self-selection of banks into diversification using a Heckman two-step selection model. In the first step of the Heckman procedure, we use the probit specification to estimate the probability that a bank is internationally diversified according to our baseline threshold. In the second step, we include the set of instruments described above for identification purposes, in addition to the explanatory variables of the baseline specification. We then calculate the inverse Mill’s ratio and include it in our baseline specification, estimating the effect of international diversification on a bank’s excess value. The results reported in Panel 3 of Table 5 show that the selection parameter lambda is positive but it is not statistically significant. Reassuringly, the coefficient of international diversification is positive also in this case and it is statistically significant at the 1% level. Moreover, also in this case, controlling for endogeneity yields larger effects of geographic diversification on bank value as expected.
3.4. Nonlinearity
The link between market value and the degree of diversification of banks could be nonlinear, increasing or decreasing with the level of diversification. To test this hypothesis, we have split our measure of diversification into 6 quantiles (Geon1-Geon6). The results in Panel 1 of Table 6 clearly show an inverse U-shaped pattern, with the strongest effect of diversification occurring for the medium ranges. In Panel 2 we aggregate quantiles delivering similar diversification premiums, i.e., quantiles 2 and 3 and 4 and 5, and the previous findings are confirmed.
21
These results suggest that the market attaches greater costs to international diversification above a certain level, which can be attributed to greater complexity that require additional layers of corporate control, thereby reducing firm efficiency and its value. In other words, over-diversification pays less because above a certain threshold costs grow more rapidly. These results accord with the lower excess values observed for more internationally diversified sampled banks such as Deutsche Bank, BNP Paribas and Société Générale as compared with less diversified banks such as Cofitem-Cofimur in France or DAB Bank in Germany.
4. Conclusions
Multinational banks have been in the public eye since the start of the 2007-2008 financial crisis. The crisis has further exposed this gap between theory and practice by casting doubts on the role of multinational banks. Despite the mounting political, public, media, and supervisory and regulatory consensus on the potential perils of cross-border dispersion of banking activity, the often entwined international business, economics and management literatures lag in providing precise empirical evidence on whether multinational banks create or destroy shareholder value.
Our question is part of the on-going debate in the economics and management literatures, the former with its emphasis on market power, efficiency of large scale operations and internal markets, and the latter with its emphasis on the benefits and costs of focusing and diversifying corporate activities. Unlike manufacturing enterprises, soft information and intangible assets possessed by banks are difficult to exchange in external markets and in contractual arrangements. The benefits of internalization should prevail up to a point where the costs of managing large and often more complex organizations override the benefits.
In this paper, we have provided new empirical evidence on the international diversification of multinational banks. In contrast to past studies that have looked at a single or small number of
22
countries, we collected data on 384 banks from 56 countries. Our findings indicate that multinational banks create shareholder value, i.e. the benefits of international diversification more than offset the cost of large and therefore more complex organizations. Our results are in contrast with the findings of Goetz et al. (2013), who document a domestic geographic diversification discount using an accurate identification strategy to control for possible endogeneity, but they are confirmed also using an identification strategy similar to that adopted by Goetz et al. (2013). While it is very likely that international expansion increases agency costs even more than domestic expansion, our results show that international diversification increases shareholder value. Although further research is needed to fully explain this result, it is consistent with the view that cross-border expansion is more likely to allow reaping untapped profit opportunities, improve risk diversification, and exploit regulatory arbitrage. Moreover, our results are also consistent with the existence of a selection mechanism, where internationalization is chosen only by the largest and more efficient corporations (Melitz, 2003; Melitz and Ottaviano, 2008).
Our findings provide a sound rationale for the momentous process of bank internationalization that took place in the decade before the inception of the financial crisis and may be of interest to bankers in their quest to extend their cross-border operations. However, while we show that these international operations were value enhancing for the shareholders, we do not pretend to argue that this had no consequences. As the effects of financial crisis suggest, the benefits of international diversification might have come from easier access to risk-taking activities that were not properly appraised by external investors, supervisors and regulators, as shown by Gulamhussen et al. (2014).
23
References
Albertazzi, U., Bottero, M., 2014. Foreign bank lending: Evidence from the global financial crisis. Journal of International Economics 92 Supplement 1(0), S22-S35.
Amihud, Y., Lev, B., 1981. Risk reduction as a managerial motive for conglomerate mergers. The Rand Journal of Economics 12 (2), 605-617.
Amihud, Y., DeLong, G., Saunders, A., 2002. The effects of cross-border bank mergers on bank risk and value. Journal of International Money and Finance 21 (6), 857–877.
Arellano, M., Bond, S., 1991. Some tests of specification for panel data: Monte Carlo evidence and an application to employment equations. Review of Economic Studies 58 (2), 277-297. Arellano, M., Bover, O., 1995. Another look at the instrumental variables estimation of
error-components models. Journal of Econometrics 68 (1), 29-51.
Apergis, N., 2014. The long-term role of non-traditional banking in profitability and risk profiles: Evidence from a panel of U.S. banking institutions. Journal of International Money and Finance 45(C), 61-73.
Baele, L., De Jonghe, O., Vennet, R.V., 2007. Does the stock market value bank diversification? Journal of Banking and Finance 31 (7), 1999–2023.
Barba Navaretti, G., Calzolari, G,. Pozzolo, A.F., Levi, M., 2010. Multinational banking in Europe – Financial stability and regulatory implications: lessons from the financial crisis. Economic Policy 25, 703-753.
Barba Navaretti, G., Venables, A., 2004. Multinational Firms in the World Economy. Princeton University Press, New Jersey.
Beck, T., De Jonghe, O., Schepens, G., 2013. Bank competition and stability: Cross-country heterogeneity. Journal of Financial Intermediation 22 (2), 218-244.
Boddewyn, J.J., Halbrich, M.B., Perry, A.C. 1986. Service multinationals: Conceptualization, measurement and theory. Journal of International Business Studies 17(3), 41-57.
Buch, C. M., DeLong, G., 2004. Cross-border bank mergers: What lures the rare animal? Journal of Banking and Finance 28 (9), 2077-2102.
Buckley, P.J., Casson, M.C., 1976. The Future of the Multinational Enterprise, Holmes & Meier, London.
Caiazza, S., Clare, A., Pozzolo, A.F., 2012. What do foreigners want? Evidence from targets in bank cross-border M&As. Journal of Banking and Finance 36 (9), 2641-2659.
Campa, J. M., Hernando, I., 2006. M&As performance in the European financial industry. Journal of Banking and Finance 30 (12), 3367-3392.
Campa, J.M., Kedia, S., 2002. Explaining the diversification discount. Journal of Finance 57 (4), 1731–1762.
Caves, R.E., 1996. Multinational Enterprise and Economic Analysis, Cambridge University Press, Cambridge.
Cetorelli, N., Goldberg, L.S., (2012a), Liquidity management of US global banks: Internal capital markets in the great recession, Journal of International Econonimcs 88(2), 299-311.
Cetorelli, N., Goldberg, L.S., (2012b), Banking globalization and monetary transmission, Journal of Finance 67(5), 1811-1843.
24
Claessens, S., van Horen, N., 2014. Foreign banks: Trends and impact. Journal of Money Credit and Banking 46 (1), 295-326.
Cornett, M.M, Hovakimian, G., Palia, D., Tehranian, H., 2003. The impact of the manager– shareholder conflict on acquiring bank returns. Journal of Banking and Finance 27 (1), 103-131.
Cremers, M., Huang, R., Sautner, Z., 2008. Internal capital markets: The bright side of corporate politics. Yale ICF Working paper No. 08-19.
Cybo-Ottone, A., Murgia, M., 2000. Mergers and shareholder wealth in European banking. Journal of Banking and Finance 24 (6), 831-859.
Dastidar, P., 2009. International corporate diversification and performance: Does firm self-selection matter? Journal of International Business Studies 40 (1), 71-85.
de Haas, R., van Lelyveld, I., 2010. Internal capital markets and lending by multinational banks. Journal of Financial Intermediation 19, 1-25.
DeLong, G.L., 2001. Stockholder Gains from Focusing Versus Diversifying Bank Mergers. Journal of Financial Economics 59(2), 221-252.
Deng, S., Elyasiani, E., Mao, C., 2007. Diversification and the cost of debt of bank holding companies. Journal of Banking and Finance 31 (12), 2453-2473.
Deng, S., Elyasiani, E., 2008. Geographic diversification, bank holding company value, and risk. Journal of Money Credit and Banking 40 (6), 1217-1238.
De Young, R., Toma, G., 2013. Nontraditional banking activities and bank failures during the financial crisis. Journal of Financial Intermediation 22(3), 397-421.
Edwards, C.D., 1955. Conglomerate bigness as a source of power, in: Stigler, G.G. (Ed.), Business Concentration and Price Policy. Princeton University Press, New Jersey, pp. 331-352. Fillat, J. L., Garetto, S.,2014. Risk, returns, and multinational production. Mimeo, Boston
University.
Fillat, J.L., Garetto, S., Oldenski, L., 2015. Diversification, cost structure, and the risk premium of multinational corporations. Journal of International Economics 96(1), 37-54..
Focarelli, D., Pozzolo, A.F., 2005. Where do banks expand abroad? An empirical analysis. Journal of Business 78 (6), 2435-2463.
Frankel, J., Romer, D., 1999. Does trade cause growth? American Economic Review 89 (3), 1211-1230.
Goddard, J., McKillop, D., Wilson, J.S., 2008. The diversification and financial performance of US credit unions. Journal of Banking and Finance 32 (10), 1836-1849.
Goetz, M.R., Laeven, L., Levine, R. 2013 Identifying the valuation effects and agency costs of corporate diversification: Evidence from the geographic diversification of U.S. banks. Review of Financial Studies 26 (7), 1787-1823.
Goldberg, L. 2004, Financial-Sector FDI and Host Countries: New and Old Lessons. NBER Working Paper No. 10441
Gormley,T.A., 2010. The impact of foreign bank entry in emerging markets: Evidence from India. Journal of Financial Intermediation 19 (1), 26-51.
25
Gulamhussen, M.A., Pinheiro, C.M., Pozzolo, A.F., 2014. International diversification and risk of multinational banks: Evidence from the pre-crisis period. Journal of Financial Stability (August) 13, 30-43.
Hamilton, L. C., 1991. How robust is robust regression? Stata Technical Bulletin 2 21–26. Hauswald, R.H., Bruno, V.G., 2014. The real effect of foreign banks. Review of Finance, 18 (5),
1683-1716.
Helpman, E., 2006. Trade, FDI, and the organization of firms. Harvard Institute of Economic Research Working paper no. 2118.
Helpman, E., Melitz, M. J. and Yeaple, S. R. (2004) Export Versus FDI with Heterogeneous Firms. American Economic Review 94(1), 300-316.
Houston, J.F., James, C., Marcus, D., 1997. Capital market frictions and the role of internal capital markets in banking. Journal of Financial Economics 46 (2), 135-164.
Jayaratne, J., Strahan, P., 1996. The finance-growth nexus: Evidence from bank branch deregulation. Quarterly Journal of Economics 101 (3), 639-670.
Jensen, M.C., 1986. Agency costs of free cash flow, corporate finance, and takeovers. American Economic Review Papers and Proceedings 76 (2), 323-329.
Jensen, M.C., Meckling, W.H., 1976. Theory of the firm: Managerial behavior, agency costs, and ownership structure. Journal of Financial Economics 3 (4), 305–360.
Jensen M.C., Murphy, K.J., 1990. Performance pay and top management incentives. Journal of Political Economy 98 (2), 225-264.
John, K., Saunders, A., L.W. Senbet, L.W., 2000. A theory of bank regulation and management compensation. Review of Financial Studies 13 (1), 95-125.
Jones, G., 1992. Banks as multinationals, in: G. Jones, Banks as multinationals, London, Routledge: 1-13.
Laeven, L., Levine, R., 2007. Is there a diversification discount in financial conglomerates? Journal of Financial Economics 85 (2), 331-367.
Lang, L., Stulz, R.M., 1994. Tobin’s q, corporate diversification, and firm performance. Journal of Political Economy 102 (6), 1248-1280.
LeBaron, D., Speidell, L. 1987. Why are the parts worth more than the sum? ‘Chop shop,’ a corporate valuation model, in Browne, L., Rosengren, E. (Eds.), The Merger Boom. Conference Series No. 31, Federal Reserve Bank of Boston, Boston, pp. 78-101.
Lewellen, W.G., 1971. A pure financial rationale for the conglomerate merger. Journal of Finance 26 (2), 521-537.
Li, G. 1985. Robust regression, in: Shapes, D., Hoaglin, C., Mosteller, F., Tukey, J.W. (Eds.), Exploring Data Tables, Trends. Wiley, New York.
Lindberg E.B., Ross, S.A., 1981. Tobin’s q ratio and industrial organization. Journal of Business 54 (1), 1-32.
Markusen, J.R. 2004. Multinational firms and the theory of international trade. MIT Press, Cambridge.
Martin, J.D., Sayrak, A., 2003. Corporate diversification and shareholder value: A survey of recent literature. Journal of Corporate Finance 9 (1), 37-57.
26
Melitz, M., 2003. The impact of trade on intra-industry reallocations and aggregate industry productivity. Econometrica 71 (6), 1695-1725.
Melitz, M., Ottaviano. G., 2008. Market size, trade, and productivity. Review of Economic Studies 75(1), 295-316
Mercieca, S., Schaek, K., Wolfe, S., 2007. Small European banks: Benefits from diversification? Journal of Banking and Finance 31 (7), 1975-1998.
Moeller, S.B., Schlingemann, F.P., 2005. Global diversification and bidder gains: A comparison between cross-border and domestic acquisitions. Journal of Banking and Finance 29 (3), 533-564.
Montgomery, C.A., 1994. Corporate diversification. Journal of Economic Perspectives 8 (3), 163-178.
Morck, R., Yeung, B., 1991. Why investors value multinationality. Journal of Business 64 (2), 165-187.
Morgan, D.P., 2002. Rating banks: Risk and uncertainty in an opaque industry. American Economic Review 92 (4), 874–888.
Morgan, D.P., Strahan, P.E., 2004. Foreign bank entry and business volatility: Evidence from U.S. States and other countries, in: Ahumada, L.A., Fuentes, J.R. (Eds.), Banking Market Structure and Monetary Policy. Central Bank of Chile, Santiago, Chile.
Outreville, J., 2010. Internationalization, performance and volatility: The World largest financial groups. Journal of Financial Services Research 38 (2-3), 115-134.
Petersen, M.A., Rajan, R., 1994. The benefits of lending relationships: Evidence from small business data. Journal of Finance 49 (1), 3–37.
Rajan, R.G., 1992. Insiders and outsiders: The choice between relationship and arms’-length debt. Journal of Finance 47 (4), 1367–1400.
Rajan, R.G., 1998. The past and future of commercial banking viewed through an incomplete contract lens. Journal of Money Credit and Banking 30 (3), 524-550.
Roodman, D., 2006. How to do xtabond2: An introduction to "difference" and "system" GMM in Stata. Center for Global Development Working paper No.103.
Schmid, M.M., Walter, I., 2009. Do financial conglomerates create of destroy economic value? Journal of Financial Intermediation 18 (2), 193–216.
Sharpe, S.A., 1990. Asymmetric Information, bank lending and implicit contracts: A stylized model of customer relationships. Journal of Finance 45 (4), 1069–87.
Shleifer, A., Vishny, R.W., 1990a. The new theory of the firm. Equilibrium short horizons of investors and firms. American Economic Review Papers and Proceedings 80 (2), 148-153. Shleifer, A., Vishny, R.W., 1990b. The takeover wave of the 1980s. Science 249 (4970), 745-749. Stein, J.C., 1997. Internal capital markets and the competition for corporate resources. Journal of
Finance 52 (1), 111-133.
Sweeney, R.J., Warga, A.D., Winters, D., 2001. The market value of debt, market versus book value of debt, and returns to assets. Financial Management 26 (1), 5-21.
van Lelyveld, I., Knot, K., 2009. Do financial conglomerates create or destroy value? Evidence for the EU. Journal of Banking and Finance 33 (12), 2312-2321.
27
Villalonga, B., 2004a. Diversification discount or premium? New evidence from the business information tracking series. Journal of Finance 59 (2), 479-506.
Villalonga, B., 2004b. Does diversification cause the diversification discount? Financial Management 33 (2), 5-27.
Williams, B., 1997. Positive theories of multinational banking: Eclectic theory versus internalisation theory. Journal of Economics Surveys 11 (1), 71–100.
28 Table 1. Summary statistics
Variable Mean
St. Dev.
Coefficient of variation
1st percentile 99th percentile Units
Excess value 07 0.001 120.00 -0.17 0.50 ratio 0.12
Excess value 09 -0.002 -60.00 -0.17 0.50 ratio 0.12
International diversification (n / nmax) 0.07 2.29 0.00 0.81 ratio
0.16
International share 0.17 1.82 0.00 1.00 ratio 0.31
International broadening (HHI) 0.17 1.47 0.00 0.80 ratio 0.25
Total assets 1.51 1.14 0.17 9.12 bil. USD
1.72
Income diversification 0.63 0.41 0.00 1.00 ratio 0.26
Asset diversification 0.61 0.39 0.00 1.00 ratio 0.24
Returns on assets (ROA) 1.04 1.37 -2.87 5.08 ratio 1.42
Equity to assets 0.09 0.67 0.01 0.32 ratio
0.06
Deposits to liabilities 0.88 0.18 0.18 0.99 ratio 0.16
Debt to total assets 0.91 0.09 0.63 0.98 ratio 0.08
Scaled geographic distance 32.65 0.08 20.06 46.61 ratio 6.37
Excess value is defined as qj – [αj qint + (1 – αj) qdom], where qj is bank’s Tobin’s q, qint is the average Tobin’s q of
banks with αj > 0.7 or 0.9, as appropriate, qdom is the average Tobin’s q of banks with αj > 0.3 and αj is given by nj/nmax,
where nj is the number of foreign countries in which bank j has a subsidiary during our sample period and nmax is the
maximum number of foreign countries in which the most diversified bank has subsidiaries during our sample period. International diversification is defined as njt/nmaxt, with time varying data. International share is the share of assets on
a country-by-country basis, computed as 1 − (𝑡𝑜𝑡𝑎𝑙 𝑠𝑢𝑏𝑠𝑖𝑑𝑖𝑎𝑟𝑖𝑒𝑠 𝑎𝑠𝑠𝑒𝑡𝑠−𝑓𝑜𝑟𝑒𝑖𝑔𝑛 𝑠𝑢𝑏𝑠𝑖𝑑𝑖𝑎𝑟𝑖𝑒𝑠 𝑎𝑠𝑠𝑒𝑡𝑠
𝑡𝑜𝑡𝑎𝑙 𝑠𝑢𝑏𝑠𝑖𝑑𝑖𝑎𝑟𝑖𝑒𝑠 𝑎𝑠𝑠𝑒𝑡𝑠 ) ; and international broadening is a transformed Hirsch-Herfindhal index computed for each bank and on a country-by-country basis as 1 − ∑ ( 𝑠𝑢𝑏𝑠𝑖𝑑𝑖𝑎𝑟𝑦 𝑎𝑠𝑠𝑒𝑡𝑠𝑗
𝑡𝑜𝑡𝑎𝑙 𝑠𝑢𝑏𝑠𝑖𝑑𝑖𝑎𝑟𝑖𝑒𝑠 𝑎𝑠𝑠𝑒𝑡𝑠) 2 𝑛𝑗
𝑗=1 . Income diversification is defined as 1 − |
𝑛𝑒𝑡 𝑖𝑛𝑡𝑒𝑟𝑒𝑠𝑡 𝑖𝑛𝑐𝑜𝑚𝑒−𝑜𝑡ℎ𝑒𝑟 𝑜𝑝𝑒𝑟𝑎𝑡𝑖𝑛𝑔 𝑖𝑛𝑐𝑜𝑚𝑒 𝑡𝑜𝑡𝑎𝑙 𝑜𝑝𝑒𝑟𝑡𝑎𝑖𝑛𝑔 𝑖𝑛𝑐𝑜𝑚𝑒 | and asset diversification as 1 − |𝑛𝑒𝑡 𝑙𝑜𝑎𝑛𝑠−𝑜𝑡ℎ𝑒𝑟 𝑒𝑎𝑟𝑛𝑖𝑛𝑔 𝑎𝑠𝑠𝑒𝑡𝑠
29
Table 2. Baseline specification for international diversification with fixed effects Dependent: excess value
(1) linear regression OLS (2) robust regression (3) robust regression (4) fixed effects International diversification 0.043 *** 0.055 *** 0.061 *** 0.051 *** (0.015) (0.012) (0.010) (0.012) Log assets -0.002 -0.003 -0.071 *** -0.070 *** (0.003) (0.002) (0.007) (0.008) Income diversification 0.012 ** 0.007 0.010 *** 0.016 *** (0.005) (0.004) (0.003) (0.004) Asset diversification -0.034 *** -0.025 *** -0.008 0.006 (0.009) (0.005) (0.005) (0.007) ROA 0.012 *** 0.005 *** -0.002 ** -0.002 ** (0.003) (0.002) (0.001) (0.001) Equity to assets 0.089 0.146 *** -0.389 *** -0.393 *** (0.072) (0.043) (0.042) (0.056)
Country effects Yes Yes No No
Year effects Yes Yes Yes Yes
Bank effects No No Yes Yes
Number of observations 1,275 1,275 1,306 1,120
Excess value is defined as qj – [αj qint + (1 – αj) qdom], where qj is bank’s Tobin’s q, qint is the average Tobin’s q of
banks with αj > 0.7 or 0.9, as appropriate, qdom is the average Tobin’s q of banks with αj > 0.3 and αj is given by nj/nmax,
where nj is the number of foreign countries in which bank j has a subsidiary during our sample period and nmax is the
maximum number of foreign countries in which the most diversified bank has subsidiaries during our sample period. International diversification is defined as njt/nmaxt, with time varying data. Income diversification is defined as 1 −
|𝑛𝑒𝑡 𝑖𝑛𝑡𝑒𝑟𝑒𝑠𝑡 𝑖𝑛𝑐𝑜𝑚𝑒−𝑜𝑡ℎ𝑒𝑟 𝑜𝑝𝑒𝑟𝑎𝑡𝑖𝑛𝑔 𝑖𝑛𝑐𝑜𝑚𝑒
𝑡𝑜𝑡𝑎𝑙 𝑜𝑝𝑒𝑟𝑡𝑎𝑖𝑛𝑔 𝑖𝑛𝑐𝑜𝑚𝑒 | and asset diversification as 1 − |
𝑛𝑒𝑡 𝑙𝑜𝑎𝑛𝑠−𝑜𝑡ℎ𝑒𝑟 𝑒𝑎𝑟𝑛𝑖𝑛𝑔 𝑎𝑠𝑠𝑒𝑡𝑠
𝑡𝑜𝑡𝑎𝑙 𝑒𝑎𝑟𝑛𝑖𝑛𝑔 𝑎𝑠𝑠𝑒𝑡𝑠 | . Standard errors are in parentheses. Significance at the 1%, 5%, and 10% level is denoted by ***, **, and *, respectively.
30 Table 3. Robustness tests for international diversification Dependent: excess value (change in excess value in column (6))
(1) (2) (3) (4) (5) (6) robust regression robust regression 0.9 – 0.1 thresholds 0.7 – 0.1 thresholds excluding M&A Change in excess value International diversification 0.059 *** 0.060 *** 0.064 *** -0.079 *** (0.012) (0.011) (0.011) (0.023) International share 0.028 *** (0.010) International broadening 0.016 ** (0.008) Log assets -0.064 *** -0.063 *** -0.069 *** -0.066 *** -0.061 *** -0.030 ** (0.008) (0.008) (0.008) (0.007) (0.008) (0.013) Income diversification 0.013 *** 0.013 *** 0.009 ** 0.011 *** 0.012 *** 0.006 (0.004) (0.004) (0.004) (0.003) (0.004) (0.006) Asset diversification 0.008 0.008 0.003 0.007 0.001 0.028 *** (0.006) (0.006) (0.006) (0.005) (0.005) (0.009) ROA -0.002 ** -0.002 ** -0.002 ** 0.003 *** -0.002 *** -0.005 *** (0.001) (0.001) (0.001) (0.001) (0.001) (0.002) Equity to assets -0.301 *** -0.293 *** 0.073 -0.349 *** -0.411 *** -0.350 *** (0.048) (0.048) (0.046) (0.042) (0.045) (0.077) Country effects No No No No No No
Year effects Yes Yes Yes Yes Yes Yes
Bank effects Yes Yes Yes Yes Yes Yes
Number of observations 1,306 1,306 1,197 1,260 1,240 905 Excess value is defined as qj – [αj qint + (1 – αj) qdom], where qj is bank’s Tobin’s q, qint is the average Tobin’s q of
banks with αj > 0.7 or 0.9, as appropriate, qdom is the average Tobin’s q of banks with αj > 0.3 and αj is given by nj/nmax,
where nj is the number of foreign countries in which bank j has a subsidiary during our sample period and nmax is the
maximum number of foreign countries in which the most diversified bank has subsidiaries during our sample period. International diversification is defined as njt/nmaxt, with time varying data. International share is the share of assets on
a country-by-country basis, computed as 1 − (𝑡𝑜𝑡𝑎𝑙 𝑠𝑢𝑏𝑠𝑖𝑑𝑖𝑎𝑟𝑖𝑒𝑠 𝑎𝑠𝑠𝑒𝑡𝑠−𝑓𝑜𝑟𝑒𝑖𝑔𝑛 𝑠𝑢𝑏𝑠𝑖𝑑𝑖𝑎𝑟𝑖𝑒𝑠 𝑎𝑠𝑠𝑒𝑡𝑠
𝑡𝑜𝑡𝑎𝑙 𝑠𝑢𝑏𝑠𝑖𝑑𝑖𝑎𝑟𝑖𝑒𝑠 𝑎𝑠𝑠𝑒𝑡𝑠 ) ; and international broadening is a transformed Hirsch-Herfindhal index computed for each bank and on a country-by-country basis as 1 − ∑ ( 𝑠𝑢𝑏𝑠𝑖𝑑𝑖𝑎𝑟𝑦 𝑎𝑠𝑠𝑒𝑡𝑠𝑗
𝑡𝑜𝑡𝑎𝑙 𝑠𝑢𝑏𝑠𝑖𝑑𝑖𝑎𝑟𝑖𝑒𝑠 𝑎𝑠𝑠𝑒𝑡𝑠) 2 𝑛𝑗
𝑗=1 . Income diversification is defined as 1 − |
𝑛𝑒𝑡 𝑖𝑛𝑡𝑒𝑟𝑒𝑠𝑡 𝑖𝑛𝑐𝑜𝑚𝑒−𝑜𝑡ℎ𝑒𝑟 𝑜𝑝𝑒𝑟𝑎𝑡𝑖𝑛𝑔 𝑖𝑛𝑐𝑜𝑚𝑒 𝑡𝑜𝑡𝑎𝑙 𝑜𝑝𝑒𝑟𝑡𝑎𝑖𝑛𝑔 𝑖𝑛𝑐𝑜𝑚𝑒 | and asset diversification as 1 − |𝑛𝑒𝑡 𝑙𝑜𝑎𝑛𝑠−𝑜𝑡ℎ𝑒𝑟 𝑒𝑎𝑟𝑛𝑖𝑛𝑔 𝑎𝑠𝑠𝑒𝑡𝑠
𝑡𝑜𝑡𝑎𝑙 𝑒𝑎𝑟𝑛𝑖𝑛𝑔 𝑎𝑠𝑠𝑒𝑡𝑠 |. Standard errors are in parentheses. Significance at the 1%, 5%, and 10% level is denoted by ***, **, and *, respectively.