D
D
e
e
t
t
e
e
r
r
m
m
i
i
n
n
a
a
n
n
t
t
f
f
a
a
c
c
t
t
o
o
r
r
s
s
o
o
f
f
b
b
a
a
n
n
k
k
c
c
u
u
s
s
t
t
o
o
m
m
e
e
r
r
s
s
'
'
d
d
e
e
m
m
a
a
n
n
d
d
f
f
o
o
r
r
l
l
i
i
q
q
u
u
i
i
d
d
i
i
t
t
y
y
C
Cl
lá
áu
ud
di
ia
a
D
D.
.
B
B
er
e
rn
na
ar
rd
do
o
S
Sé
ér
rg
gi
io
o
C
C.
.
L
La
ag
go
oa
a
E
Em
m
an
a
nu
ue
el
l
R
R.
.
L
Le
eã
ão
o
D
D
e
e
z
z
e
e
m
m
b
b
r
r
o
o
d
d
e
e
2
2
0
0
1
1
4
4
W
W
P
P
n
n
.
.
º
º
2
2
0
0
1
1
4
4
/
/
1
1
2
2
DOCUMENTO DE TRABALHO WORKING PAPER*
Banco SantanderTotta, SA., Rua do Ouro 88, 1100-063 Lisboa. claudiabernardo60@hotmail.com.**
DINAMIA’CET-IUL and ISCTE - University Institute of Lisbon (ISCTE-IUL), Department of Political Economics. Avenida das Forças Armadas, 1649-026 Lisboa, Portugal. Corresponding author sergio.lagoa@iscte.pt.***
DINAMIA’CET-IUL and ISCTE - University Institute of Lisbon (ISCTE-IUL), Department of Political Economics. Avenida das Forças Armadas, 1649-026 Lisboa, Portugal. emanuel.leao@iscte.pt.Determinant factors of bank customers'
demand for liquidity
*
Cláudia D. Bernardo
**
Sérgio C. Lagoa
***
Emanuel R. Leão
WP n.º 2014/12
DOI: 10.7749/dinamiacet-iul.wp.2014.12 1. INTRODUCTION ... 32. LITERATURE ON DEMAND FOR LIQUIDITY ... 4
3. EVOLUTION OF THE PORTUGUESE FINANCIAL SYSTEM ... 7
Recent macroeconomic developments of the Portuguese economy ... 8
4. EMPIRICAL MODEL, DATA AND RESULTS ... 8
4.1 Evolution of clients portfolios and descriptive statistics ... 10
4.2 Determinants of investment in liquidity ... 12
4.3 Additional results ... 14
5. CONCLUSION... 17
6. REFERENCES ... 20
DINÂMIA’CET – IUL, Centro de Estudos sobre a Mudança Socioeconómica e o Território ISCTE-IUL – Av. das Forças Armadas, 1649-026 Lisboa, PORTUGAL
Tel. 210464031 - Extensão 293100 E-mail: dinamia@iscte.pt www.dinamiacet.iscte.pt
2
Determinant factors of bank customers'
demand for liquidity
Abstract
In contexts of economic instability investors show an increase in aversion to risk and prefer high liquidity and low-risk financial products. In this paper, we study the reasons behind bank customers holding wealth in the form of immediate liquidity. Using micro data on clients’ portfolios of a Portuguese bank, we ask whether there is a relationship between the bank’s capital ratio and the proportion of wealth that clients allocate to demand deposits, which is a relatively unexplored topic in the literature. Special attention is also paid to the impact of investors' financial knowledge by looking at professional group and age. Results indicate that when banks’ capital ratio decreases, savers put a larger fraction of their investment into demand deposits, especially savers with greater risk aversion and knowledge. Finally, we find evidence of an “age effect” and also that investors belonging to professional groups with more skills follow more sophisticated investment strategies.
Keywords: Financial institutions; demand for liquidity; financial literacy; capital ratio; banks; deposits; investors’ behaviour; crisis; Portugal; financial literacy.
DINÂMIA’CET – IUL, Centro de Estudos sobre a Mudança Socioeconómica e o Território ISCTE-IUL – Av. das Forças Armadas, 1649-026 Lisboa, PORTUGAL
Tel. 210464031 - Extensão 293100 E-mail: dinamia@iscte.pt www.dinamiacet.iscte.pt
3
1.
INTRODUCTI ON
In situations of economic instability, experienced for example after the 2008 crisis, investors show an increase in aversion to risk and prefer high liquidity and low-risk financial products. The aim of this work is to study the factors leading investors to invest in liquidity, particularly the role of the risk of bank failure, and the age and professional group of investors, in the context of the optimal allocation of wealth across various assets.
The demand for liquidity or money is a recurrent topic in economics and many authors have highlighted its determinants such as the investor's risk aversion, uncertainty (leading to the precautionary motive according to Keynes), the return and risk of alternative investments (bonds, shares, etc.) and the volume of transactions (transaction motive to Keynes).
Even though savers' decisions are based on their ability to accept risk (Poterba and Samwick, 1997), the composition of the investment portfolio is also based on a desirable level of income and not only on risk considerations (Allessie et al, 2004). Investment in assets other than money is restricted by obstacles such as lack of information (Mulligan and Sala-i-Martin, 2000) or bank costs (Vissing-Jorgensen, 2002) that most savers cannot afford (Akerlof, 1991). The lack of information is in many cases related with the financial illiteracy of savers with low education/vocational training (van Rooij et al, 2011). As a result, the increase of financial knowledge with age (age effect) is also indicated as a factor influencing savers’ investment decisions (King and Jonathan, 1987). Other authors suggest that the tax component is critical in decision-making, namely the use of tax incentives by higher income earners (Alessie et al., 2004).
A database of a leading Portuguese bank will be analysed to study the proposed topic. The database is composed of all bank clients (70,675) residing in the cities of Lisbon and Aveiro, covering the period between 2007 and 2011. Our study focuses on the proportion of wealth invested in demand deposits; this product is characterised by immediate liquidity, a null or very low interest rate, and is insured against the financial institution’s bankruptcy by the deposits guarantee fund. Deposits are also covered by the deposits guarantee fund, but they have less liquidity and a higher interest rate. Although they have a fixed maturity, money can generally be withdrawn before maturity subject to loss of interest payment.
This study makes some relevant contributions to the literature. Firstly, we analyse how the bank’s financial situation impacts the composition of clients’ investment portfolios. To our best knowledge, this point is relatively unexplored in the literature. The study of the Portuguese
DINÂMIA’CET – IUL, Centro de Estudos sobre a Mudança Socioeconómica e o Território ISCTE-IUL – Av. das Forças Armadas, 1649-026 Lisboa, PORTUGAL
Tel. 210464031 - Extensão 293100 E-mail: dinamia@iscte.pt www.dinamiacet.iscte.pt
4 situation between 2010 and 2011 is of particular interest as the banking system was under stress due to the European sovereign debt crisis. Finally, this paper also contributes to a better understanding of the effect of financial knowledge on investment decisions, using as proxies skill level and lifetime experience.
Our results show that investors react to the regulatory capital position of the bank, increasing investment in demand deposits when there is a reduction in the bank's capital, and this is especially true for more risk-averse investors. Additionally, savers with more knowledge tend to constitute a more diversified investment portfolio earlier in their life, unlike savers with low education/vocational training. However, when the theory of permanent income is combined with the age effect, we found that almost all savers diversify their asset portfolio over time.
In Section 2, we will look at the factors that influence the choice of the optimal portfolio by examining the main theoretical arguments and empirical studies. Section 3 analyses the evolution of the Portuguese financial system and its influence on households’ economic decisions regarding wealth allocation. Finally, in the last section, we estimate an equation for the proportion of wealth invested in demand deposits to answer the proposed questions.
2.
LITERATURE O N DEMAND FOR LIQ UIDITY
As seen above, the main goal of this paper is to understand why bank clients have part of their wealth in the form of liquidity. The demand for liquidity or for money is a traditional topic in economics. The wealth of economic agents is composed of a portfolio of real and financial assets. Money is the most liquid of the financial assets. On the other hand, holding money (especially in the form of demand deposits) implies an opportunity cost compared to more profitable investments. The cost/benefit criterion indicates that agents should increase currency holdings if the benefits exceed the additional costs. Although there are many studies on investors’ behaviour, we still know little about the factors that influence their decisions (CMVM, 2009).
Keynes broke with the classical concept of money as a simple instrument of trade intermediation, proposing that it was also an instrument to reserve value and to speculate. According to him, economic agents demand money for three reasons: transaction, precaution and speculation. Later, Tobin further e xplored the element of speculation, suggesting that holding currency instead of risky assets can reduce portfolio risk by diversifying financial investments. All investors hold the risk-free asset, and more risk-averse investors have a larger
DINÂMIA’CET – IUL, Centro de Estudos sobre a Mudança Socioeconómica e o Território ISCTE-IUL – Av. das Forças Armadas, 1649-026 Lisboa, PORTUGAL
Tel. 210464031 - Extensão 293100 E-mail: dinamia@iscte.pt www.dinamiacet.iscte.pt
5 proportion of wealth in this asset in line with the principle of utility maximisation. Differences in risk aversion are potentially an important factor for explaining differences in portfolio composition among households; Bucciol and Miniaci (2010), for example, show for the US that there is substantial heterogeneity in risk aversion across households.
In the context of the theory of portfolio choice, Friedman (1957) stated that factors influencing the demand for currency are the same as for any other financial asset. In general, a rational saver allocates his wealth among various assets in order to maximise the expected return for a given level of risk. Thus, the demand for money depends positively on the wealth of individuals (or their permanent income) and the expected return of money relative to other substitute assets (shares, bonds, and other physical goods). Other factors that influence the demand for currency are the structure of wealth distribution, the level of uncertainty about the future, economic crises and the degree of political instability.
While Tobin's “precautionary principle of risk diversification” states that investors restrict the holding of financial products with higher risk and profitability due to risk aversion (Tobin, 1998), some authors explain this attitude with information barriers (Mulligan and Sala-i-Martin, 2000), mainly linked to the lack of financial knowledge and experience (Cardak and Wilkins, 2008). Investors with financial knowledge choose products that guarantee the desired level of performance, rather than products that only guarantee safety (Alessie et al., 2004). If investors want to invest in foreign assets to explore their weak correlation with domestic assets (Le Bris, 2013), financial knowledge is even more important.
New financial knowledge may be acquired at a cost, and some investors decide that it is not worth incurring such a cost and invest only in liquid assets (Alessie et al., 2004). More fundamentally, investors’ financial knowledge is associated with the level of education. Previous studies indicate that investors with a higher level of education have higher levels of financial literacy and understanding of financial products than less educated or qualified investors (van Rooij et al, 2011). Nonetheless, King and Jonathan (1987) suggest that financial knowledge of savers increases with age, suggesting an “age effect”. In this paper we assess the impact of financial knowledge on investment in demand deposits by looking at the effect of age and professional groups.
However, other authors refute the importance of financial knowledge, arguing that investors do not invest in higher risk/return products because of banking transaction costs and the lack of liquidity of those products (Vissing-Jorgensen, 2002; Alessie et al, 2004).
DINÂMIA’CET – IUL, Centro de Estudos sobre a Mudança Socioeconómica e o Território ISCTE-IUL – Av. das Forças Armadas, 1649-026 Lisboa, PORTUGAL
Tel. 210464031 - Extensão 293100 E-mail: dinamia@iscte.pt www.dinamiacet.iscte.pt
6 When liquidity is in the form of demand deposits other aspects must be taken into account. In addition to deposits, bank clients usually also have other investment products such as bonds, mutual funds or retirement savings. When there is a risk of bank failure, savers are at risk of losing their savings and attempt to rescue them as soon as possible. They can simply withdraw money from the bank or, less dramatically, have their money invested in the most liquid product, demand deposits. Investors can withdraw their money quicker from the bank if they hold demand deposits than if they hold other less liquid assets. Moreover, deposits up to a certain amount (€100,000 in Portugal) are guaranteed due to the existence of a deposit guarantee fund. Therefore, savers put a higher proportion of wealth in the form of demand deposits because they are safeguarded in the eventuality of a bank failure. This leads us to the central hypothesis that we want to test: when the risk of bank failure increases, bank clients put a higher proportion of their wealth in the form of demand deposits.
The risk of bank failure increases with a decrease in its capital, since a bank with less capital is less able to withstand negative shocks. Additionally, a bank with a low level of capital has a greater incentive to invest in risky assets since it does not support a large portion of the losses in the case of a bad outcome (Berger et al., 1995). Several studies have corroborated this by showing that depositors impose price and/or quantity discipline on less capitalised banks in the form of high deposit rates and/or smaller deposits growth, especially when deposits are not fully insured. Examples of these studies include Cook and Spellman (1994) for the USA, Demirgüç-Kunt and Huizinga (2004) for a panel of OECD and developing countries, and Martinez-Peria and Schmukler (2001) for Argentina, Chile and Mexico. Based on this literature, we can reformulate our hypothesis in the following way: as the capital ratio of a bank reduces, savers invest a larger fraction of their wealth in demand deposits. Notice that we are not interested in the effect of the bank’s capital on the growth of deposits as common in the literature, but in its effect on the composition of clients’ portfolios.
Summarising, we can say that there is a set of objective factors affecting investment decisions (Poterba and Samwick, 1997), e.g. return and risk of assets, liquidity, disposable income and wealth, financial knowledge (related with education, age, and professional group), transaction costs, bank’s capital, institutional factors (like political instability), and also tax benefits. Moreover, subjective factors also play an important role such as risk aversion, preferences for certain financial assets and precautionary behaviour based on intuitive decisions to react to unforeseen circumstances (Hochguertel, 2003). In this paper, we will focus mainly on the effect of the bank’s risk and investors’ age and professional group.
DINÂMIA’CET – IUL, Centro de Estudos sobre a Mudança Socioeconómica e o Território ISCTE-IUL – Av. das Forças Armadas, 1649-026 Lisboa, PORTUGAL
Tel. 210464031 - Extensão 293100 E-mail: dinamia@iscte.pt www.dinamiacet.iscte.pt
7
3.
EVOLUT ION O F T HE PO R TUGUESE FINANCI AL S Y ST EM
In order to contextualise our analysis, we look briefly at the major transformations of the Portuguese financial system and the evolution of households’ financial wealth over the past few decades. The development of the financial system began in the mid-1980s and was fostered by membership of the European Economic Community from 1986. It was one of the most important transformations in the Portuguese economy in recent decades and followed the international trends of financial liberalisation, albeit with some time lag (Alexandre et al., 2011).
The changes in the financial system had implications in consumption and households’ savings decisions. Since 1995 the financial situation of households changed substantially both in terms of liabilities and assets. Several credit demand and supply factors led to the expansion of households’ indebtedness at rates higher than the growth rate of available income. In 1995 Portugal had one of the lowest ratios of households debt to GDP in Europe, but in 2007 it was one of the highest (Antão et al., 2009).
Turning to the evolution of the composition of household wealth in recent decades, the weight of real estate in total wealth decreased from around 65% to 50% between 1990 and 2000, with the corresponding increase of financial wealth (Alexandre et al., 2011). But the weight of houses has remained almost constant since 2000. With the liberalisation of the financial system, new institutions and financial products have emerged rapidly, contributing to significant changes in the composition of household wealth. Although deposits have remained the largest component of wealth after houses, their weight has decreased since 1986 in favour of investments in riskier financial assets (such as stocks, bonds and mutual funds) and insurance products (including life insurance and pensions) (Cardoso et al., 2008). The decline in interest rates contributed to an increase in households’ demand for financial instruments of higher risk and profitability.
The international financial crisis of 2008 led to the restructuring of households’ portfolios, with an increase in the importance of money (cash and deposits) and houses and a reduction in the weight of stocks and mutual funds (Synek, 2009). This phenomenon confirms the usual statute of money as a refuge asset when risk increases. However, the substitution effect towards money and houses was temporary and more evident in stocks and mutual funds and less pronounced in pension funds and other assets.
DINÂMIA’CET – IUL, Centro de Estudos sobre a Mudança Socioeconómica e o Território ISCTE-IUL – Av. das Forças Armadas, 1649-026 Lisboa, PORTUGAL
Tel. 210464031 - Extensão 293100 E-mail: dinamia@iscte.pt www.dinamiacet.iscte.pt
8 Recent macroeconomic developments of the Portuguese economy
In a scenario of global recession in the third quarter of 2008, the Portuguese economy was not immune to the effects of the crisis and began a deep slowdown. The domestic banking sector started reducing its external debt, which led to a change in the structure of banks' financing. Off-balance-sheet operations and particularly deposits replaced the financing through international markets. Banks strengthened their efforts to attract deposits, with deposit rates in some cases above the interbank market rates.
In 2010, Greece and Ireland had difficulties in implementing measures to restructure their economies. The bad economic results presented by these countries (for example, Greece had a budget deficit of 15.4 % of GDP), and the inability of Governments to obtain market financing, dictated the need to obtain external help from the EU and the IMF. However, this plan was not enough to pacify the financial markets, which started to fear contagion to other countries in Southern Europe, particularly Spain and Portugal. At the end of the second quarter of 2010, the feeling of insecurity led to a sharp rise in the sovereign credit spreads required for Southern European countries.
Even though Portugal had shown a growth of 1.4 % in 2010, the excessive pressure in debt markets created uncertainty jeopardising economic growth. In 2011, the weakness of the Portuguese economy led to the need for an external financing plan from EU and IMF to ensure the financing and sustainability of public finances. As a result, structural reforms and austerity measures were implemented according to the “Memorandum of Understanding” applied by European Financial Stability Mechanism. In the financial sector, a fund was created for recapitalisation and to increase the line of state guarantees for debt issuance by banks; but the deleveraging of domestic banks was required in return. The process of recapitalisation and deleveraging of banks led to a larger growth of deposits.
4. EMPI RI CAL MODEL, DATA AND RE SULTS
In this section we give an econometric explanation of the proportion of investors' wealth in the bank in the form of demand deposits. The independent variables include investor’s age and its square 1 (in order to study the age effect), income (logarithm of monthly income received by each individual on average during the period) 2
,
a dummy that takes the value one if the investor lives in Lisbon, dummy for professional group, a dummy to capture investor’s risk aversion, the1 We only include customers aged between 21 and 85 years. 2 We only include customers with monthly incomes greater than 50€.
DINÂMIA’CET – IUL, Centro de Estudos sobre a Mudança Socioeconómica e o Território ISCTE-IUL – Av. das Forças Armadas, 1649-026 Lisboa, PORTUGAL
Tel. 210464031 - Extensão 293100 E-mail: dinamia@iscte.pt www.dinamiacet.iscte.pt
9 return of deposits in relation to demand deposits, return of Portuguese treasury bonds minus the interest rate of demand deposits, yearly return of the Portuguese stock market compared to the interest rate for demand deposits, and regulatory capital ratio of the studied bank. All returns and interest rates are average market rates. Some variables require additional explanation. We grouped the 89 different professions in the database into eight professional groups following CMVM (2009). The groups are top and medium executives, entrepreneurs, technical professionals, skilled workers, unskilled workers, students, unemployed and retired. It is possible to create a hierarchy of some professional groups according to the skills and formal education demanded to perform the job. The list of groups from the least demanding to the most demanding in terms of skills and education is: unskilled workers, skilled workers, technical professionals, and top and medium executives.
Note that in the database there is no variable to measure directly financial knowledge, and so we use as proxy professional group and age. The latter variable is used because as individuals become older they obtain more life experience and financial knowledge (King et al., 1987; van Rooij et al., 2011).
The dummy for risk aversion takes the value one if a client has bonds or shares in his/her investment portfolio. We take this as a proxy for the level of risk aversion, and savers with one for this variable have a lower risk aversion. This is an important variable because, in the Tobin model, agents with less risk aversion will invest a smaller proportion of wealth in money.
The regulatory capital ratio is a measure of the amount of the bank's capital expressed as a percentage of its risk-weighted credit exposures and is introduced to test the effect of the bank's risk on clients’ decisions. Banks with a lower capital ratio have a greater risk of failure due to unexpected shocks.
Our database is from one of the top five Portuguese banks and includes all clients (149639) from Lisbon and Aveiro, observed between 2007 and 2011. The data allows describing the composition of client portfolios and their evolution over the years to be evaluated, therefore providing panel data.
We will use a random effects model that considers individual specific effects as random variables. By using this model, we assume that there is no correlation between individual effects and the explanatory variables, and the estimation is based on the use of generalised least squares. The choice of random effects is related to a characteristic of the database that only provides the investor’s average income, preventing the simultaneous use of fixed effects and the
DINÂMIA’CET – IUL, Centro de Estudos sobre a Mudança Socioeconómica e o Território ISCTE-IUL – Av. das Forças Armadas, 1649-026 Lisboa, PORTUGAL
Tel. 210464031 - Extensão 293100 E-mail: dinamia@iscte.pt www.dinamiacet.iscte.pt
10 variable income. Standard errors are corrected for the possibility of heteroscedasticity assuming that they are not correlated.
4.1 Evolution of clients portfolios and descriptive statistics
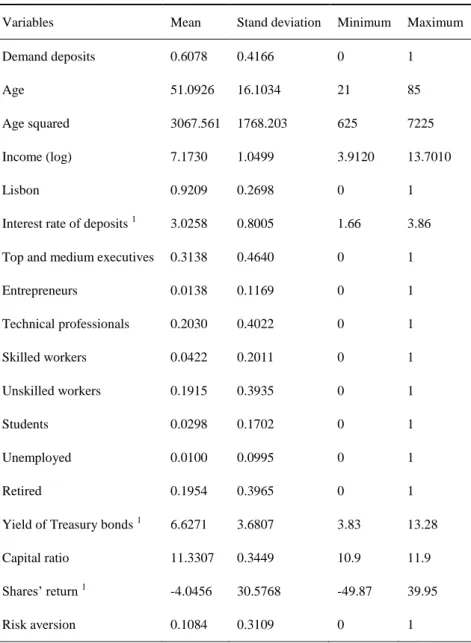
Looking at the descriptive statistics (Table 1), we observe that on average demand deposits represent around 60.7% of savers’ investment portfolios, and only 10.84% of savers invest in bonds and shares (for this last information, see the variable risk aversion). There is a weak product diversification and a low risk exposure as suggested by Guiso et al. (1996). This indicates that savers essentially own highly liquid assets that can be used in face of an immediate financial need (Poterba and Samwick, 1997), showing households' strong preference for liquidity. Savers are on average 51 years old and the mean average income is €1300. Top and medium executives (31%) and intermediate technical professionals (20%) are the largest professional groups in the sample. The top and medium executive group was therefore used as the reference group. In contrast, the smallest occupational groups in the sample are unemployed (1%), entrepreneurs (1.38%) and students (2.98%). During the period under review, on average the Treasury bond yield was 6.62%, the bank’s regulatory capital ratio was 11.33% and PSI-20 return was -4.04%. The high average yield of Treasury bonds is the result of the Euro Sovereign Debt crisis beginning in 2010.
Let us start by describing the correlation between the weight invested in demand deposits and the independent variables (see Table 7 in Annex I). We note that there is a positive correlation between investment in demand deposits and all professional groups with the exception of top and medium executives and retired persons. The correlation is also positive between the bank’s capital ratio and the proportion of wealth invested in liquidity. This preliminary result supports the hypothesis previously suggested: the higher the bank's capital ratio, the smaller the investment in demand deposits. However, we must not forget that correlation does not mean causality, and therefore we will analyse this relationship in greater depth in the next section.
The 2008 financial crisis and the consequent growth of economic uncertainty caused a significant change in savers' behaviour, with risk aversion increasing considerably. Therefore, investment in demand deposits and deposits went up from 68.51% in 2007 to 72.98% in 2008 – Table 2. Also in 2010 we observe a sharp rise in the weight of demand deposits, which can be attributed to the start of the Sovereign Debt Crisis in the euro area and in Portugal and the growing concern about the soundness of the financial system of peripheral countries of the euro area. However, that weight went down again the following year while the weight of deposits
DINÂMIA’CET – IUL, Centro de Estudos sobre a Mudança Socioeconómica e o Território ISCTE-IUL – Av. das Forças Armadas, 1649-026 Lisboa, PORTUGAL
Tel. 210464031 - Extensão 293100 E-mail: dinamia@iscte.pt www.dinamiacet.iscte.pt
11 increased considerably, probably due to the rise in banks' interest rates in an attempt to boost financing by deposits.
The decrease in the proportion of bonds mutual funds, other mutual funds, and bonds and shares can be explained by the increase in risk and fall in asset prices and liquidity of those products. We conclude that high-risk products were substituted by products of medium and low risk especially from 2007 to 2008 and from 2010 to 2011, reflecting savers' concern about the crisis. This can be interpreted as a rational attitude of savers of precaution against risk exposure (Hochguertel, 2003).
Table 1. Descriptive statistics
Note: Number of observations: 149639.
1 – These variables are subtracted from the interest rate of demand deposits.
Variables Mean Stand deviation Minimum Maximum
Demand deposits 0.6078 0.4166 0 1
Age 51.0926 16.1034 21 85
Age squared 3067.561 1768.203 625 7225
Income (log) 7.1730 1.0499 3.9120 13.7010
Lisbon 0.9209 0.2698 0 1
Interest rate of deposits 1 3.0258 0.8005 1.66 3.86
Top and medium executives 0.3138 0.4640 0 1
Entrepreneurs 0.0138 0.1169 0 1 Technical professionals 0.2030 0.4022 0 1 Skilled workers 0.0422 0.2011 0 1 Unskilled workers 0.1915 0.3935 0 1 Students 0.0298 0.1702 0 1 Unemployed 0.0100 0.0995 0 1 Retired 0.1954 0.3965 0 1
Yield of Treasury bonds 1 6.6271 3.6807 3.83 13.28
Capital ratio 11.3307 0.3449 10.9 11.9
Shares’ return 1
-4.0456 30.5768 -49.87 39.95
DINÂMIA’CET – IUL, Centro de Estudos sobre a Mudança Socioeconómica e o Território ISCTE-IUL – Av. das Forças Armadas, 1649-026 Lisboa, PORTUGAL
Tel. 210464031 - Extensão 293100 E-mail: dinamia@iscte.pt www.dinamiacet.iscte.pt
12 Table 2.Distribution of savers' financial assets (Lisbon and Aveiro)
Financial Assets (%) 2007 2008 2009 2010 2011 Demand deposits 57.86 56.92 57.40 61.34 52.43 Deposits 10.65 16.06 15.61 11.47 24.16 Structured product 2.98 3.90 3.06 3.05 3.56 Pension savings 2.63 3.27 3.64 4.70 4.84 Insurances 4.86 5.03 5.33 5.77 5.32
Mutual Funds (except bonds
funds) 7.01 4.88 6.00 5.33 3.27
Bonds mutual funds 3.40 1.00 0.74 0.62 0.30
Bonds and Shares 4.06 3.40 3.43 3.31 2.70
Others 6.55 5.54 4.78 4.40 3.43
Source: own calculations.
4.2 Determinants of investment in liquidity
Using a random-effect model with robust standard deviations, we will study the factors affecting savers’ demand for deposits (Table 3). The results of the OLS model are presented for comparative purposes, and unless otherwise stated we only refer to the RE results.
The variables of greatest interest to us are regulatory capital ratio, professional groups and age. Results for the regulatory capital ratio show that savers' investments in demand deposits fall by about 10.5 p.p. when this ratio rises by 1 p.p. Thus, the increase in banks' capital ratio gives savers the confidence to invest in other assets with lower liquidity provided by the bank.
The dummy variables for occupational groups show that all professional groups invest more in demand deposits than the base group - top and medium executives. Skilled workers emerge as the group with the highest concentration of investment in liquid assets, with 10.7 p.p. more of their wealth invested in liquidity than the reference group; followed by unskilled workers, with 8.4 p.p. more. On the other hand, retired and top and medium executives have the lowest ownership degree of demand deposits.
The coefficient of age shows that savers’ age has a negative effect on investment in demand deposits: for each additional year of age, the saver’s investment in demand deposits
DINÂMIA’CET – IUL, Centro de Estudos sobre a Mudança Socioeconómica e o Território ISCTE-IUL – Av. das Forças Armadas, 1649-026 Lisboa, PORTUGAL
Tel. 210464031 - Extensão 293100 E-mail: dinamia@iscte.pt www.dinamiacet.iscte.pt
13 declines by about 0.34 p.p. (ignoring the non-linear effect that is non-statistically significant). This is probably explained by the “age effect” in which savers’ financial knowledge increases with age, allowing them to invest more in riskier and complex products (King and Jonathan, 1987).
Table 3. Regression for demand deposits with OLS and Random Effects (RE) OLS RE robust SE
Coefficient Stand. Error Coefficient Stand. Error
Constant 2.4688*** 0.0604 2.4654*** 0.0456
Age
-0.0034*** 0.00047 -0.0034*** 0.00083
Age squared 9.71e-06** 4.43e-06 5.57e-06 7.93e-06
Income -0.0621*** 0.0010 -0.0672*** 0.0018 Lisbon 0.0764*** 0.0038 0.0726*** 0.0068 Interest rate of demand deposits -0.0450*** 0.0023 -0.0418*** 0.0019 Yield of Treasury bonds -0.0010*** 0.00038 -0.0020*** 0.00040 Shares’ Return -0.00009** 0.000042 -0.000087*** 0.000023 Professional groups: Entrepreneurs 0.0482*** 0.0088 0.0523*** 0.0155 Technical professionals 0.0392*** 0.0029 0.0413*** 0.0052 Skilled workers 0.0961*** 0.0049 0.1073*** 0.0085 Unskilled workers 0.0775*** 0.0030 0.0843*** 0.0053 Students 0.0479*** 0.0060 0.0423*** 0.0107 Unemployed 0.0285*** 0.0102 0.0453*** 0.0169 Retired -0.0060 0.0038 0.0011 0.0070 Capital ratio -0.1050*** 0.0047 -0.1001*** 0.0027 Risk aversion -0.3205*** 0.0027 -0.2503*** 0.0049 No. of observations 149639 149639 R-squared 0.1293 0.1268 F(16,149622) 2004.60 (0.0000) Wald (p value) 11751.03 (0.0000) Rho (fraction of variance due to random effects) - 0.6495
Note: * - significance at 10%, ** - at 5%, and *** - at 1%.
Regarding control variables, income has a negative effect on investment in demand deposits: when savers’ income increases by 1%, they invest 6.72 p.p. less in demand deposits. This may
DINÂMIA’CET – IUL, Centro de Estudos sobre a Mudança Socioeconómica e o Território ISCTE-IUL – Av. das Forças Armadas, 1649-026 Lisboa, PORTUGAL
Tel. 210464031 - Extensão 293100 E-mail: dinamia@iscte.pt www.dinamiacet.iscte.pt
14 be explained by the fact that investment in less liquid assets entails largely fixed transaction costs (Vissing-Jorgensen, 2002) and information costs (Akerlof, 1991), which are only profitable to bear for large amounts of investment. On the other hand, higher income investors may apply part of their savings on less liquid assets, while savers with lower income need all their money available for current consumption. Another factor is that higher income earners take more advantage of tax incentives resulting from investment in less liquid assets like pension funds and insurances (Alessie et al., 2004).
Savers from Lisbon have 7.2 p.p. more of their investments concentrated in demand deposits than savers from Aveiro. The coefficient of the risk aversion dummy shows that a decline in risk aversion, decreases savers' investment in demand deposits. In other words, savers that are less sensitive to risk, invest less in demand deposits, as shown by Poterba and Samwick (1997). Notice that the estimation with RE considerably reduces the risk aversion coefficient (in absolute terms) in comparison with the OLS estimation, probably because the random effect partially captures investors' preference for risk.
As expected, the increase in the return rate of alternative assets (compared with the demand deposits interest rate) has a negative effect on the investment in demand deposits. A 1 p.p. increase in the interest rate on deposits reduces investment in demand deposits by about 4.1 p.p. Moreover, a 1 p.p. rise in the bonds' yield reduces demand deposits investment by about 0.2 p.p. Finally, a 1 p.p. increase in the return of shares reduces the investment in demands deposits by 0.008 p.p. We observe that the largest substitution effect occurs for deposits that are a very similar financial product to demand deposits. That effect is the smallest for shares, as investors feel reluctant to invest in high-risk products even though they pay a higher return.
4.3 Additional results
The next step is to evaluate whether less risk-averse agents are less responsive to the bank’s capital position. To that end, we re-estimate the model considering the interaction between investor’s risk aversion and bank’s capital ratio as an additional variable. The results from regression 1 of Table 4 show that savers respond differently to the deterioration of the bank's capital. Savers with higher risk aversion tend to be more sensitive to the ratio of the bank's own funds. While high risk aversion investors increase investment in demand deposits by 10.34 p.p. when the bank’s capital declines 1 p.p., low risk aversion investors increase that type of investment by only 7.31 p.p.
We further evaluated the interaction between banks’ capital ratio and the different professional groups (see Table 4, regression 2). Results show that the professional groups
DINÂMIA’CET – IUL, Centro de Estudos sobre a Mudança Socioeconómica e o Território ISCTE-IUL – Av. das Forças Armadas, 1649-026 Lisboa, PORTUGAL
Tel. 210464031 - Extensão 293100 E-mail: dinamia@iscte.pt www.dinamiacet.iscte.pt
15 reacting least to banks’ capital ratio are skilled workers, unskilled workers and retired persons. These findings can be explained by their lack of interest or knowledge (particularly skilled workers and unskilled workers) about the connection between that ratio and the safety of their financial resources.
The following section strives to understand the relationship between professional groups and investment choices over time, i.e., we examine how the effect of the saver’s age differs across different professions. The model was re-estimated taking into account the interaction between age and occupation of savers (Table 5).
Results show that for every additional year of age, the investment in demand deposits decreases 0.51 p.p. in unemployed3, 0.36 p.p. in unskilled workers, 0.12 p.p. in technical professionals; and finally 0.10 p.p. among retired persons. Even though results for the remaining professional groups are not statistically significant, they indicate a fall of 0.26% in skilled workers, 0.22% in top and medium executives, 0.19% in entrepreneurs, and 0.06% in students. In sum, the groups with the largest rate of decline in investment in liquid financial assets over time are the unemployed, followed by unskilled workers. Inversely, retired persons and technical professionals show the lowest decline in investment in liquid assets with age.
These results show that unskilled workers initially invest more in demand deposits than other professional groups (see the dummy for the professional group) and also stand out in the disinvestment in liquid assets with age (0.36 p.p./year). The group is essentially composed of individuals with a low level of education or low qualifications and generally have low financial literacy. However, they acquire more financial knowledge with age (King et al., 1987; van Rooij et al., 2011), which allows them to invest more in less liquid and more complex assets
In sum, two different clusters of professional groups stand out (not considering students, unemployed and retired, which have special situations). On one hand, technical professionals and top and medium executives invest less in demand deposits, reduce their investment in these deposits less with age, and their investment in liquid assets reacts more to the bank’s capital position. On the other hand, skilled and unskilled workers invest more in demand deposits, reduce their investment in this product more with age, and react less to bank’s capital ratio. These differences in behaviour may be related with differences in the financial knowledge of the professional groups.
DINÂMIA’CET – IUL, Centro de Estudos sobre a Mudança Socioeconómica e o Território ISCTE-IUL – Av. das Forças Armadas, 1649-026 Lisboa, PORTUGAL
Tel. 210464031 - Extensão 293100 E-mail: dinamia@iscte.pt www.dinamiacet.iscte.pt
16
Table 4. Regression for demand deposits with an interaction between risk aversion and the capital ratio (1) and an interaction between professional groups and the capital ratio (2)
(1) (2) Coefficient Stand. Error Coefficient Stand. Error Constant 2.5023*** 0.0460 2.5257*** 0.0529 Age -0.0034*** 0.00082 -0.0034*** 0.0008
Age squared 5.6e-06 7.87e-06 5.63e-06*** 7.93e-06
Income -0.0672*** 0.0018 0.0672*** 0.0018
Lisbon 0.0726*** 0.0068 0.0725*** 0.0068
Interest rate of demand
deposits -0.0418*** 0.0019 -0.0418*** 0.0019 Yield of Treasury bonds -0.0020*** 0.0004 -0.0020** 0.0004
Shares’ Return -0.000086*** 0.000023 -0.000087*** 0.000023 Professional groups: Entrepreneurs 0.0523*** 0.0155 0.0522*** 0.0155 Technical professionals 0.0413*** 0.0052 0.0758 0.0516 Skilled workers 0.1073*** 0.0085 -0.1200 0.0926 Unskilled workers 0.0844*** 0.0053 -0.0284 0.0509 Students 0.0423*** 0.0107 0.1114 0.1116 Unemployed 0.0453*** 0.0169 -0.1819 0.2140 Retired 0.0011 0.0070 -0.1809*** 0.0526 Capital ratio (CR) -0.1034*** 0.0028 -0.1054*** 0.0036 Risk aversion -0.5938*** 0.0492 -0.2503*** 0.0049 CR*Risk aversion 0.0303*** 0.0043 - - CR*Tec. professionals -0.0030 0.0045 CR*Skilled workers 0.0200** 0.0082 CR*Unskilled workers 0.0099** 0.0045 CR*Students -0.0060 0.0099 CR*Unemployed 0.02002 0.0188 CR*Retired 0.0160*** 0.0046 No. of observations 149639 149639 R-squared 0.1269 0.1269 Wald (p-value) 11760.85 (0.0000) 11802.24 (0.0000)
Rho (fraction of variance due
to random effects) 0.6495 0.6494
Note: * - significance at 10%, ** - at 5%, and *** - at 1%. Results from RE regressions with robust
standard errors. The interaction between entrepreneurs and capital ratio was not computed due to the high correlation among these variables.
DINÂMIA’CET – IUL, Centro de Estudos sobre a Mudança Socioeconómica e o Território ISCTE-IUL – Av. das Forças Armadas, 1649-026 Lisboa, PORTUGAL
Tel. 210464031 - Extensão 293100 E-mail: dinamia@iscte.pt www.dinamiacet.iscte.pt
17
5. CONCLUS ION
This paper presents a study on savers' investment in demand deposit, a product characterised by high liquidity. At times of financial crisis, liquidity is an essential premise for investors as the fear of losing funds makes them place a larger proportion of their investments in liquid and safer products. The international financial crisis triggered by the sub-prime crisis in the USA sustained a growing sense of insecurity that prompted a massive displacement of wealth from higher-risk and sophisticated products to safer but less profitable applications.
Briefly, our analysis of the data used in this paper shows that Portuguese bank clients have portfolios that, on average, exhibit a concentration in low risk assets. Investment options focus predominantly on products with high liquidity and covered by the deposit guarantee fund (demand deposits and deposits). We found that the crisis made savers reduce exposure to risky assets in favour of safer assets with greater liquidity.
The estimation of an equation for the proportion of funds invested in demand deposits gave rise to interesting results. Firstly, when faced with a deterioration of banks’ capital ratio, savers tend to put a greater proportion of their investment into demand deposits. Savers with lower risk aversion are less responsive to the deterioration of banks' capital. Among the professional groups analysed, skilled workers and unskilled workers stand out as the least reactive to changes in the financial soundness of banks. This may be explained by savers' ignorance or lack of understanding of the importance of banks’ solvency to the safety of investments.
Secondly, the group of top and medium executives has the lowest investment in demand deposits, whereas the skilled and unskilled worker groups invest the most in demand deposits. We argue that these differences in portfolio composition can be explained by dissimilarities in savers’ financial knowledge. More generally, we find two clusters of professional groups: the technical professionals and top and medium executives with more sophisticated investment strategies (in terms of less investment in deposits and more awareness of banks’ financial position); and skilled and unskilled workers with a simpler investment approach.
DINÂMIA’CET – IUL, Centro de Estudos sobre a Mudança Socioeconómica e o Território ISCTE-IUL – Av. das Forças Armadas, 1649-026 Lisboa, PORTUGAL
Tel. 210464031 - Extensão 293100 E-mail: dinamia@iscte.pt www.dinamiacet.iscte.pt
18 Table 5. Regression for demand deposits with an interaction betwee n age and
professional groups
Coefficient Stand. Error
Constant 2.4160*** 0.0486
Age -0.0022** 0.00097
Age squared 5.43e-06 9.20e-06
Age*Skilled workers -0.00039 0.00066 Age*Unskilled workers -0.0013*** 0.00035 Age*Entrepreneurs 0.00031 0.00110 Age*Technic. Professionals 0.00104*** 0.00038 Age*Students 0.0015 0.0014 Age*Unemployed -0.0029** 0.0012 Age*Retired 0.0012* 0.00064 Income -0.0672*** 0.0018 Lisbon 0.0727*** 0.0068
Interest rate of demand
deposits -0.0396*** 0.0021 Yield of Treasury bonds -0.0026*** 0.00044
Shares’ Return -0.000065*** 0.000025 Professional groups: Entrepreneurs 0.0360 0.0570 Technical professionals -0.0079 0.0180 Skilled workers 0.1247*** 0.0295 Unskilled workers 0.1500*** 0.0166 Students -0.0014 0.0461 Unemployed 0.1705*** 0.0554 Retired -0.0827** 0.0421 Capital ratio -0.0987*** 0.0028 Risk aversion -0.2501*** 0.0486 No. of observations 149639 R-squared 0.1279 Wald (p-value) 11923.73 (0.0000)
Rho (fraction of variance
due to random effects) 0.6493
Note: * - significance at 10%, ** - at 5%, and *** - at 1%.
DINÂMIA’CET – IUL, Centro de Estudos sobre a Mudança Socioeconómica e o Território ISCTE-IUL – Av. das Forças Armadas, 1649-026 Lisboa, PORTUGAL
Tel. 210464031 - Extensão 293100 E-mail: dinamia@iscte.pt www.dinamiacet.iscte.pt
19 Finally, we found that the investment behaviour of some professional groups changes as they grow older and this is particularly visible among unskilled workers and technical professionals. The group of unskilled workers, conventionally characterised as savers with low vocational training and education, is the group that most reduces investment in demand deposits as they get older. The increase in financial knowledge through the “age effect” may explain this. On the other hand, demand for deposits by the technical professionals group registers the lowest decline as they grow older. This may be explained by the fact that the members of this group are more likely to invest in risky products early on in their life cycle.
For further research, it would be interesting to measure directly financial literacy of banks’ customers through surveys and to measure the effect of this indicator on investment decisions. Another stimulating point would be to make a study similar to this paper for before the onset of the financial crisis in order to assess whether the effect of bank’s capital on investors decisions was similar to what we found.
In conclusion, our results indicate that investors pay attention to the financial health of banks when deciding on their investments. Therefore, banks’ management and regulators should be careful in managing banks’ capital and overall financial situation, particularly in times of crisis, in order to avoid panic and bank runs. Moreover, our results suggest that the level of investors' knowledge is a constraint on their financial investments. There are indications that less knowledgeable investors pay less attention to the risk of financial institutions. As a result, financial institutions and regulators should provide adequate information on financial products and financial institutions, and promote financial education, so that investors with less knowledge are able to take correct investment decisions.
DINÂMIA’CET – IUL, Centro de Estudos sobre a Mudança Socioeconómica e o Território ISCTE-IUL – Av. das Forças Armadas, 1649-026 Lisboa, PORTUGAL
Tel. 210464031 - Extensão 293100 E-mail: dinamia@iscte.pt www.dinamiacet.iscte.pt
20
6. RE FE RENCES
AKERLOF, G. A. (1991), “Procrastination and Obedience,” American Economic Review, Papers and Proceedings 81, 19.
ALESSIE, R., Hochguertel, S., and van Soest, A. (2004), “Ownership of stocks and mutual funds: a panel data analysis,” The Review of Economics and Statistics, 86(3), 783–796.
ALEXANDRE, F., Aguiar-Conraria, L., Bação, P., and Portela, M. (2011), A Poupança em Portugal. NIPE WP 29/2011.
ANTÃO, P., Boucinha, M., Farinha, L., Lacerda, A.; Leal, A. C.; and Ribeiro, N. 2009. Integração financeira, estruturas financeiras e as decisões das famílias e das empresas In: Banco de Portugal (ed.) A Economia Portuguesa no Contexto da Integração Económica Financeira e Monetária, Lisboa: Banco de Portugal.
BERGER, A., Herring, R., and Szego, G. (1995), “The Role of capital in financial institutions”, Journal of Banking and Finance, 19, 393-430.
BUCCIOL, A., and Miniaci, R. (2010), “Household portfolios and implicit risk preference”, The Review of Economics and Statistics, 93(4), 1235-1250.
CARDAK, B. A., and Wilkins, R. (2008), “The determinants of household risky asset holdings: Australian evidence on background risk and other factors”, Journal of Banking and Finance, 33(5), 850-860.
CARDOSO, F., Farinha, L., and Lameira, R. (2008), “Household wealth in Portugal: Revised series”, Occasional Papers Banco de Portugal 1/2008, Lisboa, Sep. 2008.
CMVM (2009), “O perfil do investidor Português,” Estudos CMVM n.º 3, Lisboa.
COOK, D., and Spellman, L.. (1994), Repudiation risk and restitution costs: Toward understanding premiums on insured deposits”, Journal of Money, Credit and Banking, 26, 439-459.
DEMIRGÜÇ-KUNT, A., and Huizinga, H.. (2004), “Market discipline and financial safety net design”, Journal of Monetary Economics, 51, 375-399.
DINÂMIA’CET – IUL, Centro de Estudos sobre a Mudança Socioeconómica e o Território ISCTE-IUL – Av. das Forças Armadas, 1649-026 Lisboa, PORTUGAL
Tel. 210464031 - Extensão 293100 E-mail: dinamia@iscte.pt www.dinamiacet.iscte.pt
21 FRIEDMAN, M. (1957), A Theory of the Consumption Function, Cambridge, NBER.
GUISO, L., Jappelli, T., and Terlizzese, D. (1996), “Income Risk, Borrowing Constraints and Portofolio Choice,” American Economic Review, 86, 158-172.
HOCHGUERTEL, S. (2003), “Precautionary motives and portfolio decisions,” Journal of Applied Econometrics, 18, 61-77.
KING, M. A., and Jonathan, J. I. (1987), “Asset accumulation, information, and the life cycle” NBER Working Paper No. 2392.
LE BRIS. D. (2013), “Why did French Savers buy Foreign Assets before 1914? A Decomposition of the Benefits from Diversification”, Recherches économiques de Louvain 79(3), 71-89.
MARTINEZ-PERIA, M. and Schmukler, S. (2001), “Do depositors punish banks for bad behavior? Market discipline, deposit insurance, and banking crises”, Journal of Finance, 56, 1029-1051.
MULLIGAN, C. B. and Sala-i-Martin, X. (2000), “Extensive Margins and the Demand for Money at Low Interest Rates”, Journal of Political Economy, 108 (5), 961-991.
POTERBA, J. M. and Samwick, A. A. (1997), “Household portfolio allocation over the life cycle,” NBER Working Paper 6185.
SYNEK, C. (2009), ”Impacto da recente crise financeira internacional na riqueza das famílias em Portugal e na Área do Euro”, Boletim Mensal de Economia Portuguesa, GPEARI - Gabinete de Planeamento, Estratégia, Avaliação e Relações Internacionais, Ministério da Economia e da Inovação.
TOBIN, J. (1998), Money, Credit, and Capital, Boston, McGraw-Hill.
VAN ROOIJ, M., Lusardi, A. and Alessie, R. (2011), “Financial literacy and stock market participation,” Journal of Financial Economics, 101, 449-472.
VISSING-JORGENSEN, A. (2002), “Towards an Explanation of Household Portfolio Choice Heterogeneity: Nonfinancial Income and Participation Cost Structures”, NBER Working Paper 8884.
DINÂMIA’CET – IUL, Centro de Estudos sobre a Mudança Socioeconómica e o Território ISCTE-IUL – Av. das Forças Armadas, 1649-026 Lisboa, PORTUGAL
Tel. 210464031 - Extensão 293100 E-mail: dinamia@iscte.pt www.dinamiacet.iscte.pt
22
Demand
deposits Age Income Lisbon Int. rate deposits Top and med. exec. Entrepre-neurs Tech. Profess. Skilled workers Unskilled workers Students Unem-ployed Retired Yield of TB Capital Ratio Shares' return Risk aversion Demand deposits 1 Age -0.112 1 Income -0.204 -0.116 1 Lisbon 0.002 0.085 0.045 1 Int. rate deposits -0.026 -0.010 0.001 0.002 1
Top and med.
exec. -0.094 -0.203 0.300 0.018 -0.001 1 Entrepreneurs 0.006 0.001 -0.012 -0.040 0.000 -0.080 1 Tech. Profess. 0.015 -0.104 0.033 0.024 0.002 -0.341 -0.060 1 Skilled workers 0.061 -0.100 -0.069 -0.091 -0.001 -0.142 -0.025 -0.106 1 Unskilled workers 0.109 -0.091 -0.164 -0.042 -0.005 -0.329 -0.058 -0.246 -0.102 1 Students 0.045 -0.226 -0.052 0.006 -0.001 -0.119 -0.021 -0.089 -0.037 -0.085 1 Unemployed 0.015 -0.048 -0.045 -0.017 -0.002 -0.068 -0.012 -0.051 -0.021 -0.049 -0.018 1 Retired -0.070 0.592 -0.150 0.056 0.005 -0.333 -0.059 -0.249 -0.104 -0.240 -0.087 -0.050 1 Yield of TB -0.051 0.040 -0.006 -0.004 0.278 -0.002 0.000 -0.005 0.008 0.011 0.001 0.006 -0.010 1 Capital Ratio -0.030 0.020 -0.003 -0.002 -0.703 -0.001 -0.001 -0.003 0.003 0.007 0.002 0.004 -0.006 0.162 1 Shares' return 0.018 -0.008 0.002 0.000 -0.603 0.000 0.000 0.002 -0.002 -0.001 -0.001 -0.002 0.001 -0.283 0.370 1 Risk aversion -0.283 0.078 0.186 0.292 0.011 0.083 -0.001 0.042 -0.050 -0.083 -0.028 -0.019 0.013 0.001 -0.010 -0.006 1