GREEN BEAN YIELD AND PATH ANALYSIS IN COWPEA LANDRACES
1THAISY GARDÊNIA GURGEL DE FREITAS2, PAULO SÉRGIO LIMA E SILVA2*, JÚLIO CÉSAR DOVALE3,
EDICLEIDE MACÊDO DA SILVA2
ABSTRACT- Cowpea (Vigna unguiculata (L.) Walp.) is widely cultivated in northeast Brazil for production of both green grains and dry grains. Green grains are cowpea grains with a 60 to 70% moisture content that are very appreciated by the local people. The cultivation of cowpea in northeast Brazil is performed mostly using landraces and the low yields achieved in some areas of that region are generally attributed to the cultivation of less productive landraces. The objectives of this research were to identify the best landraces in terms of green bean yield and the characters that hold the most positive direct effects on this yield via path analysis. Twelve landraces of undetermined growth were evaluated in two experiments conducted in Mossoró, Brazil. The first experiment (E1) was sprinkler-irrigated and the second (E2) was conducted under rainfed conditions, but was
irrigated whenever necessary. Pod yield and dimensions and green grains were evaluated, in addition to the main grain yield components. A randomized block design with five replications was used. The data presented here identified eight landraces with the highest yields. In addition, cowpea yield was higher in the dry season (E1) than in the rainy season (E2). The number of pods per plant had the largest direct positive effect on green grain yield.
Keywords: Vigna unguiculata. Green grain. Landraces.
RENDIMENTO DE GRÃOS VERDES E ANÁLISE DE TRILHA EM VARIEDADES TRADICIONAIS DE FEIJÃO-CAUPI
RESUMO - O feijão-caupi (Vigna unguiculata (L.) Walp.) é amplamente cultivado na região nordeste do Brasil para a produção de grãos secos e de feijão verde. O feijão verde, isto é, grãos de feijão-caupi com 60% a 70% de umidade, é muito apreciado pelos nordestinos. O cultivo do feijão-caupi no nordeste brasileiro é feito principalmente com variedades tradicionais. Presume-se que os baixos rendimentos da cultura em algumas
áreas da referida região são devidos ao uso de variedades tradicionais pouco produtivas. Os objetivos do trabalho foram identificar as melhores variedades tradicionais quanto ao rendimento de grãos verdes e os caracteres que possuem os maiores efeitos positivos diretos sobre esse rendimento, via análise de trilha. Doze variedades tradicionais de crescimento indeterminado foram avaliadas em dois experimentos realizados em
Mossoró-RN. O primeiro experimento (E1) foi realizado com irrigação por aspersão e o segundo, sob
condições de sequeiro, mas irrigado quando necessário. A avaliação contemplou os rendimentos e dimensões de vagens e de grãos verdes e os componentes principais do rendimento de grãos. Utilizou-se o delineamento
de blocos casualizados com cinco repetições. Oito variedades foram as mais produtivas. O rendimento das cultivares no experimento realizado fora da estação chuvosa (E1) foi superior ao do outro experimento. O número de vagens por planta foi a característica que apresentou o maior efeito positivo direto sobre o rendimento de grãos.
Palavras-chave: Vigna unguiculata. Feijão-verde. Variedades crioulas.
____________________
*Corresponding author
1Received for publication in 04/21/2015; accepted in 06/17/2016. Paper extracted from the masters thesis of the first author.
2Department of Plant Science, Universidade Federal Rural do Semi-Árido, Mossoró, RN, Brazil; [email protected], [email protected], [email protected].
Rev. Caatinga
INTRODUCTION
Cowpea (Vigna unguiculata (L.) Walp.) is a multipurpose crop used mainly for the production of green grains and dry grains. The cultivation of cowpea in northeast Brazil is performed mostly using landraces and the low cowpea yields achieved in some areas of the region are generally attributed to the cultivation of less productive landraces. In addition, there are few research institutions in northeast Brazil working on improving cowpea cultivars, and even fewer companies focused on producing improved seeds.
According to some authors
(BRESEGHELLO; COELHO, 2013), landraces have
lower yield, but others have shown that some landraces may be more productive than improved
cultivars (MKOI; CHIMPHANGO; DAKORA, 2009; PEKSEN, 2004). Thus, studies of traditional cultivars enable the identification of cultivars that can be used directly by farmers or used in breeding
programs (BOUKAR; FATOKUN, 2009). A landrace of a seed-propagated crop is a variable
population, which is identifiable and usually has a local name; it lacks ‘‘formal’’ crop improvement, is
characterized by specific adaptations to the environmental conditions of the cultivation area, and
is closely associated with the uses of the people who have developed and continue to grow it (POLEGRI; NEGRI, 2010).
Studies of cowpea landraces have been carried out in various regions of the world (GBAGUIDI et al., 2013; GHALMI et al., 2010) and have examined several characteristics other than grain yield. Knowledge of the association between characteristics of distinct landraces is important for breeding, especially when selection of a trait is hampered by low heritability and/or difficulties with measurement and identification (CRUZ et al., 2012). Moreover, path analysis has been shown to be the best method for comparisons between grain yield and landrace characteristics (OGUNBODEDE, 1989).
Path analysis was developed in 1918 by Sewall Wright and detailed later (WRIGHT, 1960). This analysis is based on the study of direct and indirect effects of characters on a relevant variable (overall yield), whose estimates are obtained by regression equations. Although correlation is an intrinsic characteristic of two characters under a given experimental condition, its decomposition is dependent on the set of studied characters (CRUZ et al., 2012).
Path analysis studies of green grain yield in cowpea showed that the number of pods per plant had the greatest direct effect on yield (HITIKSHA et al., 2014; SAPARA; JAVIA, 2014). In addition, these studies also confirmed that other characteristics
such as pod length had important direct effects on yield (SANTOS et al. 2014, SAPARA; JAVIA, 2014).
In 2009, the 73 municipalities in the state of Rio Grande do Norte, Brazil with the largest cultivated area of cowpea were visited. In each municipality, a farmer was contacted and provided
seeds. Landraces were collected and six preliminary assessments were conducted in small borderless plots. The 12 most promising landraces in terms of
grain yield were evaluated in this study. The objectives were to identify the best cowpea landraces
in terms of green grain yield and the characters that had the greatest direct positive effects over yield, via path analysis. The best landraces could thus be used
directly by farmers or selected for breeding programs.
MATERIAL AND METHODS
Two experiments were carried out at the Rafael Fernandes Experimental Farm (5°03’S and 37°24’ W, 87 m elevation) of the Federal Rural University of the Semi-Arid (UFERSA), located 20
km away from the city of Mossoró, state of Rio Grande do Norte (RN), Brazil. The first experiment was carried out between August and December 2013, and the second experiment was carried out from January to April 2014. According to Gaussen’s bioclimatic classification, the climate in the Mossoró region is type 4aTH or distinctly xerothermic, i.e., tropical hot with a pronounced dry season lasting from seven to eight months and with a xerothermic index between 150 and 200. The average maximum air temperature in the region ranges between 32.1 and 34.5 °C, with June and July being the coldest
months, and an average annual precipitation of approximately 825 mm. Insolation increases from
March to October with a monthly average of 241.7 h. The maximum relative humidity is 78% in April and the minimum is 60% in September (CARMO FILHO; OLIVEIRA, 1989). Table 1 shows climate data for each experimental period.
The soil in the experimental area is classified as red-yellow argisol according to the Brazilian Soil
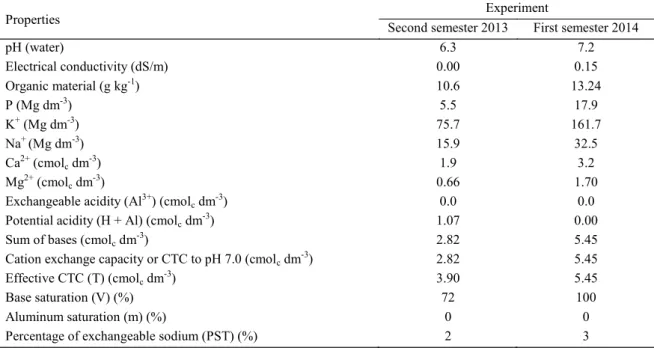
Classification System (EMBRAPA, 2006) and as ferric lixisol according to the Soil Map of the World (FAO, 1988). The results of the chemical analysis of the soil for the two experiments are shown in Table 2. Phosphorus (P) and potassium (K) were extracted with Mehlich 1 extracting solution (0.05M HC1 in 0.0125M H2SO4). P was colorimetrically determined
Table 1. Maximum, minimum, and average air temperatures, global radiation, rainfall, and relative humidity between August/2013 and April 2014.
1Data obtained from a remote weather station located 20 km away from the experimental site.
Table 2. Soil analysis for the experimental site in August 2013 and April 2014.
Before sowing, 30 kg ha-1 of ammonium
sulfate (1/3 of the nitrogen dose), 100 kg ha-1 of P
2O5
(simple superphosphate), and 50 kg ha-1 of K
2O
(potassium chloride) were applied as fertilizers in furrows located below and alongside the sowing furrows. The remaining N was blanket applied, in equal parts, after each of two weedings. A spacing of 1.0 m was used between rows, with the pits of each row spaced at 1.0 m. Sowing was done manually with four seeds per pit. Thinning was done 20 days after sowing, leaving the two largest plants in each pit. Hence, after thinning, each experiment had a planting density of 20000 plants ha-1.
The first experiment was sprinkler-irrigated,
with the experimental plots arranged in parallel with the sprinklers. The required water depth for beans (5.3 mm) was calculated considering the effective depth of the root system as 0.40 m. The plots were irrigated every two days based on the water retained
in the soil at a tension of 0.04 Mpa. Irrigation began after sowing and was suspended five days before the last harvest. The second experiment was carried out under rainfed conditions, but was irrigated whenever necessary. Irrigation was performed in the second experiment as described above.
Pest control was conducted with two Deltamethrin sprays (250 ml ha-1), at seven and 14
days after sowing. Weed control was performed by hoe weeding at 20 and 40 days after sowing.
A randomized block experimental design with five replicates was used in the two experiments. The landraces evaluated were: Baraúna, Campo Grande, Carnaubais, Ceará Mirim, Itaú, José da Penha, Lagoa de Pedra, Lagoa Salgada, Macaíba, São Tomé, Umarizal, and Upanema. Landraces were named after the municipalities from where they were collected. Each plot consisted of three rows of plants, each row measuring 6.0 m in length. The usable area
Properties Experiment
Second semester 2013 First semester 2014
pH (water) 6.3 7.2
Electrical conductivity (dS/m) 0.00 0.15
Organic material (g kg-1) 10.6 13.24
P (Mg dm-3) 5.5 17.9
K+ (Mg dm-3) 75.7 161.7
Na+ (Mg dm-3) 15.9 32.5
Ca2+ (cmolc dm-3) 1.9 3.2
Mg2+ (cmolc dm-3) 0.66 1.70
Exchangeable acidity (Al3+) (cmolc dm-3) 0.0 0.0
Potential acidity (H + Al) (cmolc dm -3
) 1.07 0.00
Sum of bases (cmolc dm-3) 2.82 5.45
Cation exchange capacity or CTC to pH 7.0 (cmolc dm-3) 2.82 5.45
Effective CTC (T) (cmolc dm -3
) 3.90 5.45
Base saturation (V) (%) 72 100
Aluminum saturation (m) (%) 0 0
Percentage of exchangeable sodium (PST) (%) 2 3
Months (2013‒2014)
Air temperature (°C) Total global radiation (mj m-2 day-1)
Precipitation (mm)
Relative humidity (%) Max. Ave. Min.
August 33.5 26.2 20.3 13.7 0.2 56.4
September 33.8 26.7 21.2 15.7 0.4 54.8
October 33.9 27.0 21.9 19.2 0.0 55.5
November 33.8 27.2 22.4 18.4 0.1 56.9
December 34.1 27.4 22.6 16.7 0.4 59.1
Average 33.8 26.9 21.7 16.7 0.2 56.5
January 34.6 27.7 22.7 16.0 0.1 56.5
February 34.6 27.7 22.7 15.3 1.4 57.0
March 33.8 27.6 23.0 19.6 4.4 60.5
April 32.9 27.0 23.0 18.2 6.3 64.6
Rev. Caatinga
was occupied by the central row and plants in pits on either extremity of the row were not considered at harvesting.
Six harvests were performed at every two to four days for the evaluation of green grain yield. Green grain yield was estimated based on the weight of pods and green grains. In addition, the number of pods per plant (based on the pods collected in the usable area); number of grains per pod (in 20-pod
samples); 100-green grain weight (in five samples);
and the length, width, and thickness of pods and grains (in 10 sample units) were also determined.
Individual and joint analysis of variance were performed using the landrace data. The effects of landraces and experiments were considered as fixed effects in these analyses. Means were compared by the Scott-Knott test (1974) when the value of the
F-test in the analysis of variance was significant
(P < 0.05). The data were tested for homogeneity of variances before the analyses of variance, which were performed using Statistical Analysis System (SAS) software version 9.1 (SAS Institute 2003). Multicollinearity diagnostics and path analysis were performed using the Genes Program – Computational Genetics and Statistics Application (CRUZ, 2013).
In path analysis, the degree of multicollinearity of the matrix X'X was established based on its condition number (CN, the ratio between the largest and smallest eigenvectors of the matrix) and the determinant value of the correlation matrix between the characters analyzed. Multicollinearity does not cause serious problems in path analysis when the CN is smaller than 100 (TOEBE; CARGNELUTTI FILHO, 2013) and determinant values close to zero indicate strong associations between the studied characters, which may lead to bias in the estimates. Previous analyses were conducted and multicollinearity was detected in
the first (CN = 204.76 and determinant
value = 5.67 x 10⁻⁶) and second (CN = 289.34 and
determinant value = 7.34 x 10⁻⁷) experiments, which
characterizes moderate to strong multicollinearity according to Montgomery and Peck (1981). For this reason, path analysis was conducted under multicollinearity. In this method, a procedure similar to ridge regression analysis was used (CARVALHO; CRUZ, 1996). Contrary to traditional path analysis, path analysis under multicollinearity includes a constant k in the X'X correlation matrix to reduce the variance associated with the least squares estimator of the path analysis (CARVALHO; CRUZ, 1996). Thus, the system of normal X'Xβ = X'Y equations becomes (X'X + k) β + X'Y. Twenty-one k values (k
= 0.00; 0.05 ...1.00) were tested. The smallest values that determine the path coefficients (5.83 x 10⁻² for
the first experiment and 6.4 x 10⁻² for the second
experiment) were chosen as recommended by Carvalho and Cruz (1996).
RESULTS AND DISCUSSION
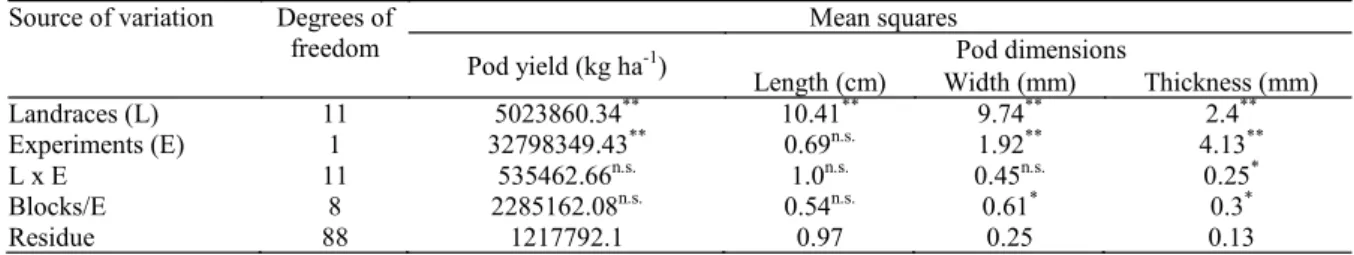
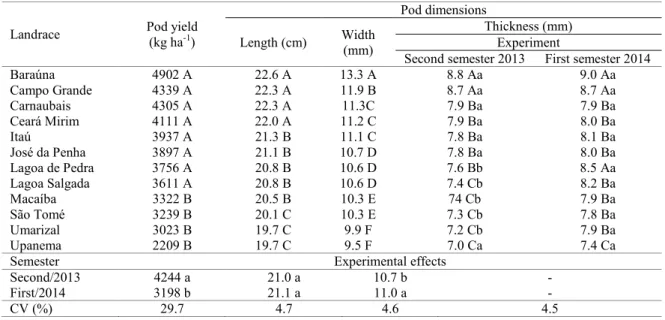
Green pod yield was affected by landraces (L) and experiments (E), but not by the interaction between L and E (Table 3). Green pod yield was not different in the landraces Macaíba, São Tomé, Umarizal, and Upanema , but was lower than in the other eight landraces (Table 4). The average pod yield in experiment 1 (second semester 2013) was lower than the average yield in experiment 2 (first semester 2014). In addition, pod length was not affected by E and by the interaction between L and E (Table 3). Four of the most productive landraces (Baraúna, Campo Grande, Carnaubais, and Ceará Mirim) had the longest pods (Table 4). Santos et al. (2014) found a positive correlation between green grain yield and pod length and large pods may have a larger number of grains and/or heavier grains, resulting in higher grain yield.
Table 3. Summary of analysis of variance for green pod yield and pod dimensions of cowpea landraces.
ns: non-significant; *: p <0.05; **: p<0.01 (F test).
Pod width and thickness were affected by landraces (L) and experiments (E) and pod thickness was also affected by the L x E interaction (Table 3). Pod width and thickness were highest in the landrace Baraúna, but thicker pods were found in the landraces Campo Grande and Lagoa de Pedra in experiment 2 (Table 4). On average, pod width was larger in experiment 2 than in experiment 1. In
addition, pod thickness in experiment 2 was larger than or equal to in experiment 1. The fact that pod width and thickness were larger in experiment 2 had no effect on pod yield, which was higher in experiment 1 (Table 4). Large grains generally are heavier than small grains. In experiment 1, grain dimensions and the number of pods per plant, on average, were greater than in experiment 2 (Table 6).
Source of variation Degrees of freedom
Mean squares
Pod yield (kg ha-1) Pod dimensions
Length (cm) Width (mm) Thickness (mm)
Landraces (L) 11 5023860.34** 10.41** 9.74** 2.4**
Experiments (E) 1 32798349.43** 0.69n.s. 1.92** 4.13**
L x E 11 535462.66n.s. 1.0n.s. 0.45n.s. 0.25*
Blocks/E 8 2285162.08n.s. 0.54n.s. 0.61* 0.3*
Pericarp weight apparently did not contribute to the higher average pod yield in experiment-1 because
pod yield (Table 4) and grain yield (Table 6) were similar across landraces.
Table 4. Average green pods yield and dimensions of cowpea landraces in the two experiments.1
1 In each trait, cultivar means followed by the same upper case letter and experiment (semester) means followed by the
same lower case letter are not different at 5% probability by the Scott-Knott test.
Green grain yield and grain length were affected by landraces (L) and experiments (E), but not by the L x E interaction (Table 5). Grain yield was significantly lower in the landraces Macaíba, São Tomé, Umarizal, and Upanema than in the other eight landraces (Table 6). In addition, landraces with the highest pod yield (Table 4) also had the highest grain yield (Table 6). Grain length was largest in the landrace Baraúna (Table 6). On average, grain yield and grain length were higher in experiment 1 than in
experiment 2. Grain width and thickness were affected by landraces (L) and experiments (E), but not by the interaction between L and E (Table 5). Grain width and thickness were largest in the landraces Baraúna and Campo Grande, but the landraces Carnaubais, Ceará Mirim, and Itaú were among those with the thickest grains (Table 6). On average, grain width and thickness were larger in experiment 1 than in experiment 2 (Table 6).
Table 5. Summary of analysis of variance for green grain yield, grain dimensions, and components of green grain yield in cowpea landraces.
ns: non-significant; *: p <0.05; **: p<0.01 (F test).
Information on green cowpea grain dimensions is not available. In Brazil and in various international markets, there is a preference for large mature grains (see review in FREIRE FILHO et al. 2012). However, cowpea grain classification scales are based on weight and not on grain dimensions (FREIRE FILHO et al. 2012). The following classification for a 100-grain weight of mature grains
(in g) was proposed by Freire Filho et al. (2012): extra-small: ≤ 10; small: 10.2‒15; medium: 15.1‒25;
large: 25.1‒30; extra-large: ˃ 30 g. On average, grain
yield was higher and bean dimensions were larger in experiment 1 than in experiment 2 (Table 6), indicating that there is a positive correlation between green and mature bean dimensions. Consumers prefer green beans with large grains. Some landraces also had wide and thick grains, but only the Baraúna landrace was superior when considering the three grain dimensions (Table 6). This fact, coupled with its high yield, makes the Baraúna landrace of special interest to be used by farmers or in breeding programs.
Source of variation Degrees of freedom
Mean squares
Green grain yield (kg ha-1)
Grain dimensions Number of pods per
plant
Number of grains per
pod
100-green grain weight
(g) Length
(cm) Width (mm)
Thickness (mm)
Landraces (L) 11 2903834.7** 2.72** 1.28** 0.91** 180.4** 4.5** 111.38** Experiments (E) 1 49789007.4** 1.65* 2.69** 2.29** 770.6** 9.3** 269.1** L x E 11 497156.2n.s. 0.55n.s. 0.14n.s. 0.12n.s. 27.6n.s. 2.4** 36.73** Blocks/E 8 1312901.3** 0.53n.s. 0.29n.s. 0.16n.s. 65.0* 0.3n.s. 16.16**
Residue 88 443322.0 0.36 0.17 0.18 31.2 0.5 5.52
Landrace Pod yield
(kg ha-1)
Pod dimensions
Length (cm) Width (mm)
Thickness (mm) Experiment
Second semester 2013 First semester 2014
Baraúna 4902 A 22.6 A 13.3 A 8.8 Aa 9.0 Aa
Campo Grande 4339 A 22.3 A 11.9 B 8.7 Aa 8.7 Aa
Carnaubais 4305 A 22.3 A 11.3C 7.9 Ba 7.9 Ba
Ceará Mirim 4111 A 22.0 A 11.2 C 7.9 Ba 8.0 Ba
Itaú 3937 A 21.3 B 11.1 C 7.8 Ba 8.1 Ba
José da Penha 3897 A 21.1 B 10.7 D 7.8 Ba 8.0 Ba
Lagoa de Pedra 3756 A 20.8 B 10.6 D 7.6 Bb 8.5 Aa
Lagoa Salgada 3611 A 20.8 B 10.6 D 7.4 Cb 8.2 Ba
Macaíba 3322 B 20.5 B 10.3 E 74 Cb 7.9 Ba
São Tomé 3239 B 20.1 C 10.3 E 7.3 Cb 7.8 Ba
Umarizal 3023 B 19.7 C 9.9 F 7.2 Cb 7.9 Ba
Upanema 2209 B 19.7 C 9.5 F 7.0 Ca 7.4 Ca
Semester Experimental effects
Second/2013 4244 a 21.0 a 10.7 b -
First/2014 3198 b 21.1 a 11.0 a -
Rev. Caatinga
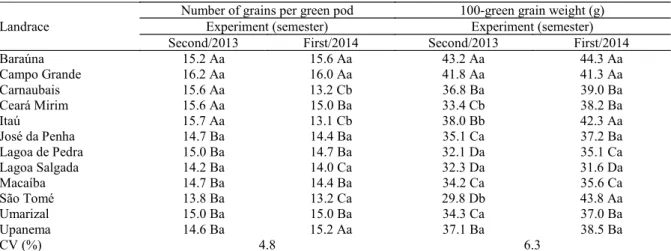
The number of pods per plant, number of grains per pod, and 100-grain weight were affected
by landraces (L) and experiments (E), and the latter two traits were also affected by the L x E interaction (Table 5). Landraces that produced the largest numbers of pods (Table 3) and grains (Table 6) also had the largest number of pods per plant (Table 6). Of the eight landraces with the highest green bean yield, only two (Baraúna and Campo Grande) also
had the largest number of grains per pod and the largest 100-grain weight (Table 7). For number of
grains per pod, the experimental conditions in the first semester (experiment 2) were unfavorable for some varieties, resulting in a significant interaction between landraces and experiments. For 100-grain
weight, the interaction between E and L was caused by a variation in performance across landraces between the first and second experiments (Table 7).
Table 6. Averages for green grain yield, for green grain dimensions and for number of pods per plant of cowpea landraces
in the two experiments.1
1In each trait, cultivar means followed by the same upper case letter and experiment (semester) means followed by the
same lower case letter are not different at 5% probability by the Scott-Knott test.
The Baraúna landrace was one of the most productive in terms of pod yield (Table 4) and green grain yield (Table 6), and also had the largest grains (Table 6). These characteristics, in addition to ease of threshing, are among the most desirable traits of green pods for the production of fresh grains (ANDRADE et al., 2010). Thus, the Baraúna landrace is the most promising of all landraces evaluated in this study for direct use by farmers or for use in breeding programs. However, other landraces had similar yield and similarly wide
(Campo Grande and Carnaubais) and thick (Campo Grande, Carnaubais, Ceará Mirim, and Itaú) grains as the Baraúna landrace. These landraces could also be potentially used by farmers or for breeding. Several characteristics other than those examined in our study must be considered before a landrace is selected by farmers. However, because the landraces evaluated have already been grown by farmers, they are more likely to be accepted due to their other desirable characteristics.
Table 7. Average number of grains per green pod and 100-grain weight of cowpea landraces in the two experiments.
1In each trait, cultivar means followed by the same upper case letter and experiment (semester) means followed by the
same lower case letter are not different at 5% probability by the Scott-Knott test.
Landrace
Number of grains per green pod 100-green grain weight (g)
Experiment (semester) Experiment (semester)
Second/2013 First/2014 Second/2013 First/2014
Baraúna 15.2 Aa 15.6 Aa 43.2 Aa 44.3 Aa
Campo Grande 16.2 Aa 16.0 Aa 41.8 Aa 41.3 Aa
Carnaubais 15.6 Aa 13.2 Cb 36.8 Ba 39.0 Ba
Ceará Mirim 15.6 Aa 15.0 Ba 33.4 Cb 38.2 Ba
Itaú 15.7 Aa 13.1 Cb 38.0 Bb 42.3 Aa
José da Penha 14.7 Ba 14.4 Ba 35.1 Ca 37.2 Ba
Lagoa de Pedra 15.0 Ba 14.7 Ba 32.1 Da 35.1 Ca
Lagoa Salgada 14.2 Ba 14.0 Ca 32.3 Da 31.6 Da
Macaíba 14.7 Ba 14.4 Ba 34.2 Ca 35.6 Ca
São Tomé 13.8 Ba 13.2 Ca 29.8 Db 43.8 Aa
Umarizal 15.0 Ba 15.0 Ba 34.3 Ca 37.0 Ba
Upanema 14.6 Ba 15.2 Aa 37.1 Ba 38.5 Ba
CV (%) 4.8 6.3
Landrace Grain yield
(kg ha-1)
Grain dimensions (mm) Number of pods per plant
Length Width Thickness
Baraúna 2190 A 12.4 A 7.9 A 6.6 A 20.7 A
Campo Grande 2990 A 11.5 B 7.7 A 6.5 A 26.0 A
Carnaubais 2555 A 11.4 B 7.7 A 6.3 A 24.6 A
Ceará Mirim 2821 A 11.4 B 7.4 B 6.2 A 25.1 A
Itaú 2505 A 11.3 B 7.2 B 6.2 A 20.7 A
José da Penha 2302 A 11.3 B 7.2 B 6.0 B 23.6 A
Lagoa de Pedra 2312 A 11.3 B 7.2 B 5.9 B 23.0 A
Lagoa Salgada 2338 A 11.1 C 7.2 B 5.9 B 21.1 A
Macaíba 1520 B 10.9 C 7.1 B 5.9 B 14.4 B
São Tomé 1662 B 10.8 C 7.0 C 5.9 B 16.6 B
Umarizal 1809 B 10.7 C 6.9 C 5.8 B 17.8 B
Upanema 1189 B 10.3 D 6.7 C 5.6 B 13.1 B
Semester Experimental effects
Second/2013 2827 a 11.3 a 7.4 a 6.2 a 23.1 a
First/2014 1539 b 11.1 b 7.1 b 5.9 b 18.0 b
Landraces can be used for crop production and in breeding programs. Different traits are selected in breeding programs, including grain yield, drought resistance, and photosynthetic rate (PADI; EHLERS, 2007; HALL, GRANTZ, 1980; BIRADAR; SALIMATH; PATIL, 2010). In these programs, landraces can be used for hybridization with improved cultivars (BIRADAR; SALIMATH; PATIL, 2010; PADI; EHLERS, 2007) or subjected to selection (HALL; GRANTZ, 1980; HEDGE; MISHRA, 2009) because they tend to exhibit large variability resulting from mutations, natural crossing, and the mechanical mixing of seeds. Mass selection and individual plant selection using the progeny test are potentially interesting for selecting commercial landraces (FREIRE FILHO et al., 2012). Padi and Ehlers (2007) concluded that the bulk-population and
the single-seed descent methods would be more
efficient than the pedigree method in developing cowpea landraces using traditional landraces.
The two experiments were conducted in nearby areas, but some chemical characteristics were more favorable in the soil of the second experimental area (Table 2). The fact that bean yield in the first experiment was higher than (10 landraces) or equal to (two landraces) in the second experiment suggests that climatic conditions were more favorable to cowpea growth in the first experiment (Table 1). Belane and Dakora (2010) found that genotypes with the highest N2 fixation rates also had the largest
biomass and the highest grain yield, indicating that several abiotic factors can affect symbiotic nitrogen fixation (MOHAMMADI et al., 2012). In addition, N2 fixation depends on genotype and year of
evaluation (BELANE; DAKORA, 2010). However, the climatic conditions during the first experiment
may have been favorable to the crop, the nitrogen-fixing bacteria, or both.
In path analysis, k values of 5.83 x 10⁻² and
6.4 x104 x 10-2 were used in the first and second
experiments, respectively. In the first and second experiments, the following variables were estimated, respectively: coefficient of determination (0.91 and 0.96), condition number (96.9 and 67.0), residual effects (0.31 and 0.2), and X'X matrix determinants (1.59 x 10⁻³ and 3.49 x 10⁻³). However, the
coefficients of determination of the path analysis were measured, and they were even higher than those reported in some studies (ALMEIDA et al., 2014; SANTOS et al., 2014). The high coefficients of determination indicate that the variation of the main character (green grain yield) was determined in large part by the explanatory variables.
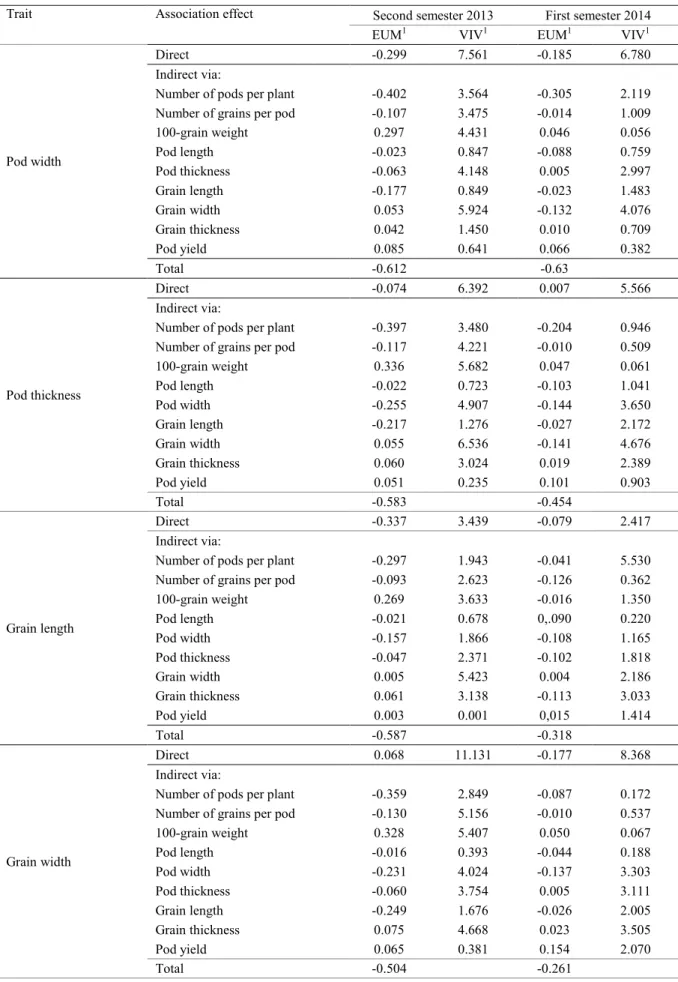
In path analysis, no variance inflator factors (VIFs) > 10 were observed in the first and second experiments (Tables 8‒10). According to Neter et al. (1983), VIFs exceeding 10 are often regarded as indicating multicollinearity; thus, the regression coefficients may be associated with these values and some estimates may be very influenced by
multicollinearity. The results of this study indicate that multicollinearity caused a minor bias in regression analysis and that reliable estimates were obtained (CARVALHO; CRUZ, 1996).
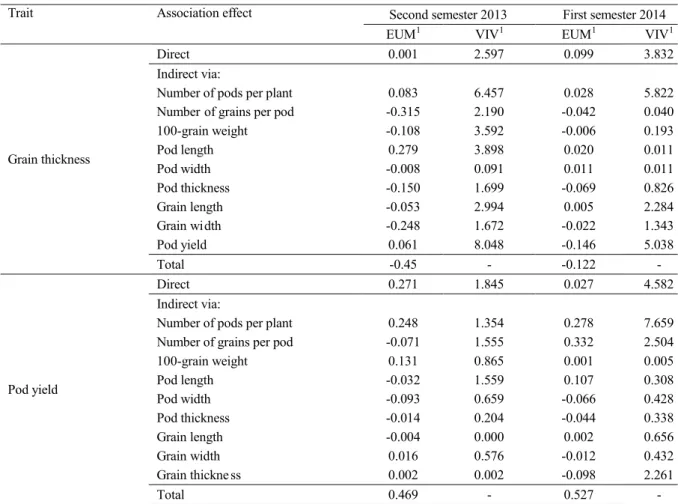
In general, the explanatory variables had similar effects on the response variable in the two experiments, which were conducted in different times of the year (Table 8, table 9, table 10). The number of pods per plant was the major determinant of green grain yield, regardless of time of year (Table 8): green grain yield was positively affected by the number of pods per plant. Similar results were reported in other studies (MISHRA; DASH 2009, NWOFIA et al. 2013, HITIKSHA et al. 2014, SAPARA; JAVIA, 2014). This result is particularly interesting for selection purposes because the number of pods is relatively easier to determine compared to grain yield, besides the fact that the latter requires that green pods be shelled, which can be a labor-intensive process.
The high correlation between yield and number of pods per plant suggests that indirect selection for grain yield via number of pods per plant may be an interesting alternative for cowpea cultivation (UMAHARAN et al., 1997). However, some studies reported low heritability estimates for number of pods per plant (ALIDU et al., 2013; SHIMELIS; SHIRINGANI, 2010; MOHAMMED et al., 2009). Thus, direct selection for cowpea yield has been proposed as the best method for selecting cowpea landraces (SHIMELI; SHIRINGANI, 2010). However, heritability for grain yield may be relatively low and close to zero in some cases, which may be a problem for direct selection (PADI; EHLERS, 2007; ALIDU et al., 2013). There are no studies comparing the effectiveness of direct and indirect selection for cowpea. However, in other crops, direct selection can be more, less, or as effective as indirect selection (ATLIN; FREY, 1989; BRANCOURT-HULMEL et al., 2005; KUMAR;
BAHL, 1992; GRAVOIS; McNEW, 1992). An alternative approach is to combine selection for grain yield with selection for number of pods per plant using selection indexes (ROSIELLE; FREY, 1975; GRAVOIS, 1998).
Estimates of indirect effects for the number of pods per plant were, in some cases, better than estimates of direct effects observed for other traits (Tables 8-10). Even though 100-grain weight had a
greater direct effect than the number of grains per pod, it was the only trait that was negatively correlated with most yield components. Other traits with moderate effects (> 0.5) such as pod and grain length and thickness negatively affected green grain
yield. This effect was probably due to the well-known compensation that occurs between the
Rev. Caatinga
Table 8. Estimates of direct and indirect effects of the main yield components and pod length on green grain yield in 12 cowpea landraces evaluated in two experiments.
1EUM: estimated under multicollinearity; VIF: variance inflation factor.
Trait Association effect Second semester 2013 First semester 2014
EUM1 VIV1 EUM VIV
Number of pods per plant
Direct 0.575 8.176 0.533 7.314
Indirect via:
Number of grains per pod 0.061 1.149 0.010 0.527
100-grain weight -0.203 2.077 0.038 0.040
Pod length -0.001 0.003 0.038 0.142
Pod width 0.209 3.296 0.106 1.964
Pod thickness 0.051 2.721 -0.003 0.720
Grain length 0.174 0.817 0.010 0.274
Grain width -0.043 3.879 0.029 0.197
Grain thickness -0.046 1.729 -0.002 0.032
Pod yield 0.117 1.216 0.173 2.622
Total 0.927 0.966
Number of grains per green pod
Direct 0.145 7.223 0.024 3.458
Indirect via:
Number of pods per plant 0.243 1.301 0.221 1.114
100-grain weight -0.340 5.805 0.016 0.007
Pod length 0.024 0.865 0.017 0.03
Pod width 0.219 3.637 0.106 1.979
Pod thickness 0.060 3.735 -0.003 0.819
Grain length 0.215 1.249 0.027 2.160
Grain width -0.061 7.945 0.074 1.299
Grain thickness -0.062 3.211 -0.007 0.325
Pod yield -0.133 1.582 0.011 0.011
Total 0.318 0.489
100-green grain weight
Direct 0.376 7.94 0.24 1.764
Indirect via:
Number of pods per plant -0.311 2.138 0.085 0.165
Number of grains per pod -0.131 5.281 0.002 0.013
Pod length -0.029 1.261 -0.097 0.938
Pod width -0.236 4.219 -0.035 0.215
Pod thickness -0.066 4.574 0.001 0.192
Grain length -0.241 1.574 -0.015 0.689
Grain width 0.059 7.580 -0.037 0.319
Grain thickness 0.062 3.170 0.002 0.036
Pod yield 0.095 0.800 0.123 1.338
Total -0.402 0.285
Pod length
Direct -0.047 3.859 -0.199 4.427
Indirect via:
Number of pods per plant 0.017 0.007 -0.102 0.235
Number of grains per pod -0.073 1.619 -0.002 0.024
100-grain weight 0.227 2.593 0.118 0.374
Pod width -0.148 1.659 -0.081 1.162
Pod thickness -0.034 1.198 0.003 1.309
Grain length -0.149 0.604 -0.022 1.455
Grain width 0.023 1.133 -0.039 0.356
Grain thickness 0.014 0.152 -0.001 0.015
Pod yield 0.182 2.968 0.092 0.741
Table 9. Estimates of direct and indirect effects of pod and grain dimensions on green grain yield in 12 cowpea landraces evaluated in two experiments.
1EUM: estimated under multicollinearity; VIF: variance inflation factor.
Trait Association effect Second semester 2013 First semester 2014
EUM1 VIV1 EUM1 VIV1
Pod width
Direct -0.299 7.561 -0.185 6.780
Indirect via:
Number of pods per plant -0.402 3.564 -0.305 2.119
Number of grains per pod -0.107 3.475 -0.014 1.009
100-grain weight 0.297 4.431 0.046 0.056
Pod length -0.023 0.847 -0.088 0.759
Pod thickness -0.063 4.148 0.005 2.997
Grain length -0.177 0.849 -0.023 1.483
Grain width 0.053 5.924 -0.132 4.076
Grain thickness 0.042 1.450 0.010 0.709
Pod yield 0.085 0.641 0.066 0.382
Total -0.612 -0.63
Pod thickness
Direct -0.074 6.392 0.007 5.566
Indirect via:
Number of pods per plant -0.397 3.480 -0.204 0.946
Number of grains per pod -0.117 4.221 -0.010 0.509
100-grain weight 0.336 5.682 0.047 0.061
Pod length -0.022 0.723 -0.103 1.041
Pod width -0.255 4.907 -0.144 3.650
Grain length -0.217 1.276 -0.027 2.172
Grain width 0.055 6.536 -0.141 4.676
Grain thickness 0.060 3.024 0.019 2.389
Pod yield 0.051 0.235 0.101 0.903
Total -0.583 -0.454
Grain length
Direct -0.337 3.439 -0.079 2.417
Indirect via:
Number of pods per plant -0.297 1.943 -0.041 5.530
Number of grains per pod -0.093 2.623 -0.126 0.362
100-grain weight 0.269 3.633 -0.016 1.350
Pod length -0.021 0.678 0,.090 0.220
Pod width -0.157 1.866 -0.108 1.165
Pod thickness -0.047 2.371 -0.102 1.818
Grain width 0.005 5.423 0.004 2.186
Grain thickness 0.061 3.138 -0.113 3.033
Pod yield 0.003 0.001 0,015 1.414
Total -0.587 -0.318
Grain width
Direct 0.068 11.131 -0.177 8.368
Indirect via:
Number of pods per plant -0.359 2.849 -0.087 0.172
Number of grains per pod -0.130 5.156 -0.010 0.537
100-grain weight 0.328 5.407 0.050 0.067
Pod length -0.016 0.393 -0.044 0.188
Pod width -0.231 4.024 -0.137 3.303
Pod thickness -0.060 3.754 0.005 3.111
Grain length -0.249 1.676 -0.026 2.005
Grain thickness 0.075 4.668 0.023 3.505
Pod yield 0.065 0.381 0.154 2.070
Rev. Caatinga
Table 10. Estimates of direct and indirect effects of grain thickness and pod yield on green grain yield in 12 cowpea landraces evaluated in two experiments.
1EUM: estimated under multicollinearity; VIF: variance inflation factor.
CONCLUSIONS
Landraces collected in the municipalities of Baraúna, Campo Grande, Carnaubais, Ceará Mirim, Itaú, José da Penha, Lagoa de Pedra, and Lagoa Salgada had the highest green pod and green grain yields. The number of pods per plant had the greatest direct positive effect on yield. Average crop yield was higher in the dry season (experiment 1) than in the rainy season (experiment 2).
REFERENCES
ALÇIDU, M. S.; ATOKPLE, I. D. K.; AKROMAH, R. Genetic analysis of vegetative-stage drought
tolerance in cowpea. Greener Journal of
Agricultural Sciences, Geneva, v. 3, n. 6, p. 481-496, 2013.
ALMEIDA, W. S. et al. Correlation and path analysis in components of grain yield of cowpea genotypes. Revista Ciência Agronômica, Fortaleza, v. 45, n. 4, p. 726-736, 2014.
ATLIN, G. N.; FREY, K. J. Predicting the relative effectiveness of direct versus indirect selection for oat yield in three types of stress environments.
Euphytica, Dordrecht, v. 44, n. 1, p. 137-142, 1989.
BELANE, A. K.; DAKORA, F. D. Symbiotic N2fixation in 30 field-grown cowpea (Vigna
unguiculata L. Walp.) genotypes in the Upper West Region of Ghana measured using 15N
natural abundance. Biology and Fertility of Soils, Heildeberg, v. 46, n. 2, p. 191-198, 2010.
BERTINI, C. H. C. M. et al. Análise multivariada e índice de seleção na identificação de genótipos superiores de feijão-caupi. Acta Scientiarum: Agronomy, Maringá, v. 32, n. 4, p. 613-619, 2010.
BIRADAR, S.; SALIMATH, P. M.; PATIL, B. C. Land race as a source for improving photosynthetic rate and productivity in cowpea (Vigna unguiculata
W.). Eletronic Journal of Plant Breeding, Coimbatore, v. 1, n. 4, p. 872-877, 2010.
BOUKAR, O.; FATOKUN, C. Strategies in cowpea breeding. In: ZERIHUN, T. (Ed.). New approaches to plant breeding of orphan crops in Africa.
Trait Association effect Second semester 2013 First semester 2014
EUM1 VIV1 EUM1 VIV1
Grain thickness
Direct 0.001 2.597 0.099 3.832
Indirect via:
Number of pods per plant 0.083 6.457 0.028 5.822
Number of grains per pod -0.315 2.190 -0.042 0.040
100-grain weight -0.108 3.592 -0.006 0.193
Pod length 0.279 3.898 0.020 0.011
Pod width -0.008 0.091 0.011 0.011
Pod thickness -0.150 1.699 -0.069 0.826
Grain length -0.053 2.994 0.005 2.284
Grain width -0.248 1.672 -0.022 1.343
Pod yield 0.061 8.048 -0.146 5.038
Total -0.45 - -0.122 -
Pod yield
Direct 0.271 1.845 0.027 4.582
Indirect via:
Number of pods per plant 0.248 1.354 0.278 7.659
Number of grains per pod -0.071 1.555 0.332 2.504
100-grain weight 0.131 0.865 0.001 0.005
Pod length -0.032 1.559 0.107 0.308
Pod width -0.093 0.659 -0.066 0.428
Pod thickness -0.014 0.204 -0.044 0.338
Grain length -0.004 0.000 0.002 0.656
Grain width 0.016 0.576 -0.012 0.432
Grain thickne ss 0.002 0.002 -0.098 2.261
Rome: FAO, 2009. cap. 6, p. 69-92.
BRANCOURT-HULMEL, M. et al. Indirect versus
direct selection of winter wheat for low-input or
high-input levels. Crop Science, Madison, v. 45, n.
4, p. 1427-1431, 2005.
BRESEGHELLO, F.; COELHO, A. S. G. Traditional and modern plant breeding methods with examples in rice (Oriza sativa L.). Journal of Agricultural and Food Chemistry, Washington, v. 61, n. 35, p. 8277-82-86, 2013.
CARMO FILHO, F.; OLIVEIRA, O. F. Mossoró: um município do semi-árido nordestino. Mossoró: ESAM, 1989. 62 p. (Coleção mossoroense, 672).
CARVALHO, S. P.; CRUZ, C. D. Diagnosis of multicollinearity: assesssment of the condition of correlation matrices used in genetic studies. Revista Brasileira de Genética, Ribeirão Preto, v. 19, n. 3,
p. 479-484, 1996.
CRUZ, C. D. GENES - A software package for
analysis in experimental statistics and quantitative genetics. Acta Scientiarum Agronomy, Maringá,
v. 35, n. 3, p. 271-276, 2013.
CRUZ, C. D.; REGAZZI, A. J.; CARNEIRO, P. C. S. Modelos biométricos aplicados ao melhoramento genético. 4. ed. Viçosa, MG: Editora
UFV, 2012. v. 1, 514 p.
EMBRAPA. Centro Nacional de Pesquisa do Solo.
Sistema brasileiro de classificação de solos. 2. ed.
Brasília, DF: Serviço de Produção de Informação,
2006. 306 p.
FAO. Soil map of the world; revised legend.
Rome: UNESCO, 1988. 119 p.
FREIRE FILHO, F. R. et al. Production, breeding and potential of cowpea crop in Brazil. Teresina: Embrapa Mid-North, 2012. 54
p. (Documentos 216).
GBAGUIDI, A. A. et al. Diversity and agronomic performances of the cowpea (Vigna unguiculata
Walp.) landraces in Southern Benin. International Research Journal of Agricultural Science and Soil Science, Aliero, v. 3, n. 4, p. 121-133, 2013.
GHALMI, N. et al. Morphological and molecular diversity within Algerian cowpea (Vigna unguiculata
(L.) Walp.) landraces. Genetic Resources and Crop Evolution, Dordrecht, v. 57, n. 3, p. 371-386, 2010.
GRAVOIS, K. A. Optimizing selection for rough rice yield, head rice, and total milled rice.
Euphytica, Dordrecht, v. 101, n. 2, p. 151-156,
1998.
GRAVOIS, K. A.; McNEW, R. W. Genetic relationships among and selection for rice yield and yield components. Crop Science, Madison, v. 33, n. 2, p. 249-252, 1992.
HALL, A. E.; GRANTZ, D. A. Drought resistance of cowpea improved by selecting for early appearance of mature pods. Crop Science, Madison, v. 21, n. 3, p. 461-461, 1980.
HEDGE, V. S.; MISHRA, S. K. Landraces of cowpea, Vigna unguiculata (L.) Walp., as potential sources of genes for unique characters in breeding.
Genetics resources and Crop Evolution, Dordrecht, v. 56, n. 5, p. 615-627, 2009.
HITIKSHA, K. P.; ACHARYA, R. R.; SHEETAL, R. P. Interrelationship among green pod yield and its yield contributing characters and biochemical characters vegetable cowpea [Vigna unguiculata (L.) Walp.]. Trends in Biosciences, New Delhi, v. 7, n. 23, p. 3972-3976, 2014.
KUMAR, J.; BAHL, P. N. Direct and indirect selection for yield in chickpea. Euphytica, Dordrecht, v. 60, n. 3, p. 197-199, 1992.
MAKOI, J. H. J. R.; CHIMPHANGO, S. B. M.; DAKORA, F. D. Effect of legume plant density and mixed culture on symbiotic N2 fixation in five
cowpea (Vigna unguiculata L. Walp.) genotypes in South Africa. Symbiosis, Normal, v. 48, n. 1, p. 57
-67, 2009.
MISHRA, H. N.; DASH, S. R. A study on variability, character association and path analysis for green pod yield in yard long bean [Vigna unguiculata subsp sesquipedalis (L.) Verdcourt].
Vegetable Science, New Delhi, v. 36, n. 3, p. 319-322, 2009.
MOHAMMADI, K. et al. Effective factors on biological nitrogen fixation. African Journal of
Agricultural Research, Nairobi, v. 7, n. 12, p. 1782-1788, 2012.
MOHAMMED, M. S.; RUSSOM, Z.; ABDUL, S. D. Inheritance of hairiness and pod shattering, heritability and correlation studies in crosses between cultivated cowpea (Vigna unguiculata (L.) Walp.) and its wild (var. pubescens) relative.
Euphytica, Dordrecht, v. 171, n. 3, p. 397-407,
2009.
Rev. Caatinga
NETER, J.; WASSERMAN, W.; KUTNER, M. H.
Applied linear regression models. Homewood: Richard D. Irwin Inc., 1983. 547 p.
NWOFIA, G. E.; OGBONNA, N. D.; AGBO, C. U. Path analysis and heritability estimates of yield and yield components in vegetable cowpea as influenced by planting season. American-Eurasian Journal of Agriculture & Environmental Sciences, Dubai, v. 13, n. 9, p. 1283-1289, 2013.
OGUNBODEDE, B. A. Comparison between three methods of determining the relationships between yield and eight of its components in cowpea, Vigna unguiculata L. Walp. Scientia Horticulturae,
Amsterdam, v. 38, n. 3-4, p. 201-205, 1989.
PADI, F. K.; EHLERS, J. D. Effectiveness of early generation selection in cowpea for grain yield and agronomic characteristics in semiarid West Africa.
Crop Science, Madison, v. 48, n. 2, p. 533-540,
2008.
PEKSEN, A. Fresh pod yield and some pod characteristics of cowpea (Vigna unguiculata L. Walp.) genotypes from Turkey. Asian Journal of Plant Sciences, Deira, v. 3, n. 3, p. 269-273, 2004.
POLEGRI, L.; NEGRI, V. Molecular markers for promoting agro-biodiversity conservation: a case
study from Italy. How cowpea landraces were saved from extinction. Genetic Resources and Crop Evolution, Dordrecht, v. 57, n. 6, p. 867-880, 2010.
ROSIELLE, A. A.; FREY, K. J. Estimates of selection parameters associated with harvest index in oat lines derived from a bulk population. Euphytica, Dordrecht, v. 24, n. 1, p. 121-131, 1975.
SANTOS, A. et al. Correlations and path analysis of yield components in cowpea. Crop Breeding and
Applied Biotechnology, Viçosa, v. 14, n. 2, p. 82-87, 2014.
SAPARA, G. K.; JAVIA, R. M. Correlation and path analysis in vegetable cowpea (Vigna unguiculata L.).
International Journal of Plant Sciences, Amsterdam, v. 9, n. 1, p. 138-141, 2014.
SHIMELIS, H.; SHIRINGANI, R. Variance components and heritabilities of yield and agronomic traits among cowpea genotypes. Euphytica, Dordrecht, v. 176, n. 3, p. 383-389, 2010.
TOEBE, M.; CARGNELUTTI FILHO, A. Multicollinearity in path analysis of maize (Zea mays
L.). Journal of Cereal Science, London, v. 57, n. 3, p. 453-462, May 2013.
UMAHARAN, P.; ARIANAYAGAM, R. P.;
HAQUE, S. Q. Genetic analysis of yield and its componentes in vegetable cowpea (Vigna unguiculata L. Walp.). Euphytica, Dordrecht, v. 96, n. 2, p. 207-213, 1997.