www.ccarevista.ufc.br ISSN 1806-6690
Correlation and path analysis in components of grain yield of cowpea
genotypes
1Correlação e análise de trilha em componentes de produção de grãos de genótipos de
feijão-caupi
Wener Santos de Almeida2*, Francisco Ronaldo Belém Fernandes3, Elizita Maria Teófilo4 e Cândida Hermínia
Campos de Magalhães Bertini4
ABSTRACT -This study aimed at verifying the effect of genotype x environment interaction on the relative contribution of yield components and final production of different cowpea genotypes. For this, data of yield components of 22 cowpea genotypes were evaluated in four environments in the State of Ceará. A one-way ANOVA tested the variability between genotypes and the Scott-Knott test compared the mean values of the genotypes. The correlations were estimated by a path analysis. A differentiated response from the genotypes to each environment was observed for all traits examined, indicating the need to perform the test for each situation separately. The number of pods per plant is the yield component with great potential of genetic gain in additional cycles of selection of more productive genotypes. The number of pods per plant and the number of grains per pod were the yield components with greater direct effects on the productivity.
Key words:Vigna unguiculata. Genotype x environment. Direct and indirect effects.
RESUMO - Objetivou-se com esse trabalho verificar o efeito da interação genótipo x ambiente sobre a contribuição
relativa dos componentes de rendimento e a produção final em genótipos de feijão-caupi. Foram utilizados dados dos componentes de produção de 22 genótipos de feijão-caupi avaliados em quatro ambientes no estado do Ceará. A análise de variância univariada foi utilizada para a determinação da variabilidade existente entre os genótipos e o teste de Scott-Knott a 5% para a comparação das médias entre os genótipos. As correlações foram estimadas através da análise de trilha. Foi observada resposta diferenciada dos genótipos para cada ambiente testado para todos os caracteres avaliados, indicando a necessidade da realização do teste para cada situação. O número de vagens por planta é o componente de rendimento com grande possibilidade de ganhos genéticos em ciclos adicionais de seleção de genótipos mais produtivos. O número de vagens por planta e número de sementes por vagem são os componentes de rendimento que apresentam maiores efeitos diretos sobre a produtividade.
Palavras-chave:Feijão-Caupi. Interação Genótipo x ambiente. Efeitos diretos e indiretos.
*Autor para correspondência
1Recebido para publicação em 04/12/2012; aprovado em 18/05/2014
Parte do trabalho de Monografia do primeiro autor apresentado à coordenação do curso de Graduação em Agronomia, da Universidade Federal do Ceará, Projeto apoiado pelo Conselho Nacional de Desenvolvimento Cientifico e Tecnológico/CNPq
2Departamento de Fitotecnia, Centro de Ciências Agrárias, Universidade Federal do Ceará, Av. Mister Hull 2977, Campus do Pici, Bloco 847,
Fortaleza-CE, Brasil, 60.021-970, [email protected]
INTRODUCTION
The cowpea (Vigna unguiculata L. Walp)
is grown mainly by small farmers, without using technology; thus obtaining low yield levels
(BENVINDO et al., 2010). These low levels may be
caused by phytotechnical practices, low technological level adopted by the farmer and interaction between
genotypes and environments (RIBEIROet al., 2001).
One goal of cowpea breeding programs is the achievement of more productive genotypes, adapted and stable. However, the yield is a complex trait difficult to measure (CARVALHOet al., 2002) and results from the interaction of
several factors, genetic, physiological and environmental, so it cannot be considered separately (GONDIMet al., 2008).
The importance of correlating traits in genetic breeding is the possibility of assessing how the change in one trait could affect others (SANTOS; CARVALHO; SANTOS, 2000), among them the productivity. It is of paramount importance to understanding the relationships between the variables, highlighting for example those variables related to productivity. Allowing the selection of the main variable, characterized by low heritability and/or measurements difficulties, based in other(s), allowing the breeder to achieve faster progresses in the use of direct selection (FERREIRAet al., 2007).
On the other hand, there may be mistakes when interpreting the correlations, since according to Gondim
et al. (2008), they do not determine the direct and indirect
influences of the traits that compound the yield. With regard to this, Cruz and Carneiro (2003) reported that the high correlation between the traits that compound the yield may be result of the effect of a third or a group of traits.
Aiming to better understand the associations between the different traits, Wright (1921) proposed a method of unfolding the estimated correlations, into direct and indirect effects of the variables on a basic variable as the grain yield, whereby the estimates of effects are obtained by regression equations where the variables are previously standardized. This method is called path analysis or path coefficient analysis.
The path coefficient method allows the visualization of the direct effect that a trait caused on another, and the indirect effects of the other related traits, thus supporting the breeder (PAIVA; ROSSETTI; GONÇALVES, 1982).
The main components of cowpea yield are: number of pods per plant, grains number per pod, pod length and mass of 100 grains. Several authors have reported the importance of these yield components in cowpea crops.
Nevertheless, when the genotypes are exposed to different environments, the relationship between yield
components is affected (GONDIMet al., 2008). Therefore,
this study verified the effect of the interaction genotypes x environments on the relative contribution of yield components and the final production in cowpea genotypes.
MATERIAL AND METHODS
Initially, a pre-selection was carried out among 500 genotypes, resulting in 22 genotypes with superior traits as for yield components, important for the production of grains. In this study, 22 cowpea genotypes (CE-03, CE-25, CE-31, CE-46, CE-73, CE-77, CE-104, CE-113, CE-596, CE-790, CE-796, CE-798, CE-930, CE-933, CE-937, CE-939, CE-940, CE-946, CE-947, CE-949, CE-956 and CE-957), all from the cowpea Germplasm Bank (BAGCaupi) of the Center of Agrarian Sciences (CCA/UFC), were evaluated for grain yield and its components in four environments at State of Ceará. Most of these genotypes have differences in plant size, flower color, and grains color.
The four experiments considered in the present study were conducted in different periods (rainy and dry of the crop year of 2010) and locations (Cascavel, Fortaleza, Quixadá and Pentecoste). At municipalities of Cascavel and Quixadá, the sowings were performed on April (rainy period). The experiment consisted of a randomized blocks design with four replicates in plots of 2.8 m x 4.0 m. In order to remove the edge effect, the useful working area was comprised of two central rows (5.6 m2), adding up to 20 plants/plot.
The NPK fertilization was conducted according to the soil analysis and applied to the foundation at sowing. The weeding and pest control were performed according to the crop´s need, and the thinning at 15 days after sowing, resulting in one plant per hole and a population of 35,714 plants ha-1 in the two locations.
At municipalities of Pentecoste and Fortaleza, the experiments were conducted on September and October (dry period). The experiment design consisted of a randomized blocks with four replicates in plots of 4.0 x 4.0 m (Pentecoste) and 2.0 x 3.0 m (Fortaleza), totaling a working area of 8 m2(Pentecoste) and 3 m2 (Fortaleza).
Crops handling were done according to the needs, and the thinning at 15 days after sowing, resulting in two plants per hole (Pentecoste) and one plant per hole (Fortaleza), adding up to a population of 50,000 plants ha-1 and 66.666
plants ha-1, respectively. Irrigations were undertaken by
furrow in Pentecoste and by micro-sprinklers in Fortaleza. The genotypes were evaluated after harvesting, regarding the number of pods per plant (NPP), pod length (PL), grains number per pod (SNP), mass of 100 grains (MHG), and productivity (PROD), estimated in kg ha-1, given
Afterwards, a one-way analysis of variance was run to test the variability between analyzed genotypes, performing the correct stand by the method of covariance, by using the model defined by the equation
ij= µ + gi +bj+ (Xij - ) + ij, where ij = observation
of the genotypei of the repetitionj, µ = overall mean
of the experiment, gi = effect of the genotype i, bj =
effect of the block j, (Xij - ) = deviation observed
in the stand and ij= random error. The comparisons
between the mean values of each examined variable in the different genotypes at each experimental site were performed by the Scott-Knott’s test. Then, it was obtained the estimates of heritability in the broad sense, genetic coefficient of variation, genetic and environmental variances, for each study environment.
In order to obtain the estimates of heritability in the broad sense, the following equation was used:
(1)
Where:
V(G): genetic variance; V(F): phenotypic variance.
The genetic variance was obtained as follows:
(2)
Where:
QMT: mean square treatments; QMR: mean square residual; r = number of blocks.
The phenotypic variance was obtained as follows:
(3)
Where:
QMT: mean square treatments; r = number of blocks.
The genetic coefficient of variation was obtained as follows:
(4)
Where:
V(G): genetic variance; : mean of the trait.
Conduct the study of path analysis, first was diagnosis made multicollinearity. The path analysis was performed according to Li (1975), to determine the direct and indirect effects of the primary components of yield. This analysis was based on the estimate of matrix of coefficients of genetic correlations. For all tests we adopted the minimum significance level of 5%.
Genetic and phenotypic variances, heritability, genetic coefficient of variation, and the path analyses were run using the software Genes (CRUZ, 2006).
RESULTS AND DISCUSSION
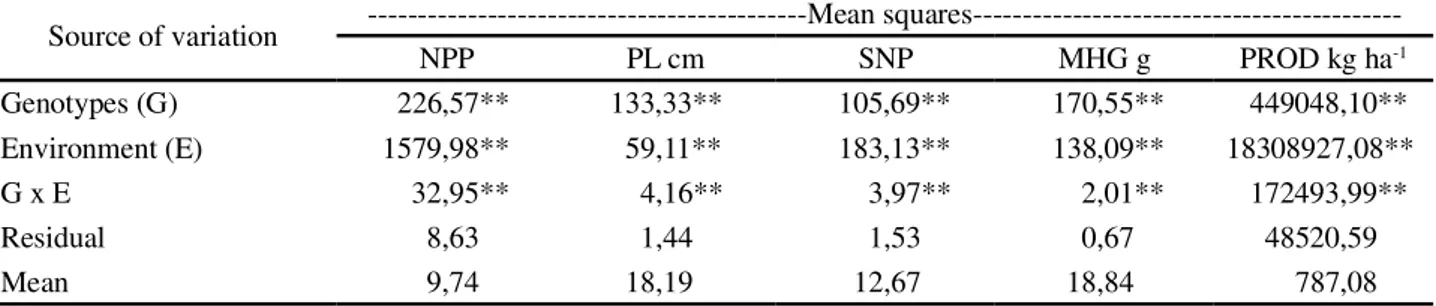
Significant differences were found at 0.01 probability, according to the F test for genotypes, environments, and interaction genotypes x environments for the evaluated variables, evidencing the genetic variability and different behavior of the genotypes in the environments, therefore, indicating the path analysis for each environment (Table 1). Cruz and Regazzi (2004) stated that the environment influences the effects of the primary components on the production, being important the number of environments tested.
The changes in direct and indirect effects of the yield components are caused by the effect of the interaction genotypes x environments. In this sense,
Ribeiro et al. (2003), evaluating the common bean in
two crops, suggested, due to the presence of significant interaction for genotypes x years, the accomplishment of path analysis for each situation.
Working with different periods of soybean sowing, Carvalhoet al. (2002), also found significant interactions
between genotypes and sowing times, indicating the performance of this study for each combination of effects.
The coefficient of variation ranged from 3.52% (MHG) in Quixadá to 37.79% (NPP) in Cascavel (Table 2). Bertini; Teófilo and Dias (2009), studying cowpea, have registered coefficients of variation close to the ones reported in this study, varying between 4.89% and 38.91%, for pod length and productivity, respectively, being considered low-medium values, pointing out a good experimental accuracy for all evaluated traits.
Regarding the productivity (Table 3), the genotypes that stood out in Pentecoste were CE-03, CE-31, CE-73, CE-77, CE-104, CE-596, CE-796, CE-939, CE-949,
CE-956 and CE-957, with means above 900 kg ha-1. In
Fortaleza, stood out CE-31, CE-104, CE-596, CE-796, CE-939, CE-940 and CE-956, with means higher than 450 kg ha-1; in Quixadá, the genotypes CE-31, CE-73, CE-77
and CE-940, with means above 800 kg ha-1, and in Cascavel,
Table 1 -Resume of the analysis of variance related with the number of pods per plant (NPP), pod length (PL), grains number per pod (SNP), mass of 100 grains (MHG), and productivity (PROD)
ns Non significant*;** Significant at 5 and 1% probability, respectively by the F-test
Source of variation ---Mean
squares---NPP PL cm SNP MHG g PROD kg ha-1
Genotypes (G) 226,57** 133,33** 105,69** 170,55** 449048,10**
Environment (E) 1579,98** 59,11** 183,13** 138,09** 18308927,08**
G x E 32,95** 4,16** 3,97** 2,01** 172493,99**
Residual 8,63 1,44 1,53 0,67 48520,59
Mean 9,74 18,19 12,67 18,84 787,08
Table 2 - Results of the analysis of variance performed with the number of pods per plant (NPP), pod length (PL), grains
number per pod (SNP), mass of 100 grains (MHG), and productivity (PROD). (DF = degrees of freedom)
ns Non significant*;** Significant at 5 and 1% probability, respectively by the F-test
Source of variation DF ---Mean
squares---NPP PL cm SNP MHG g PROD kg ha-1
- Casc
---Genotypes (G) 21 60.79** 26.83** 21.08** 44.39** 95752.57**
Residual 63 4.29 2.13 2.11 0.63 4419.41
Mean 5.49 17.55 11.07 19.47 275.17
CV (%) 37.79 8.31 13.12 4.08 24.16
--- Fortaleza
---Genotypes (G) 21 26.04** 42.85** 44.32** 33.74** 22481.71**
Residual 63 2.23 0.92 1.91 0.65 4928.45
Mean 7.30 18.83 14.01 16.97 423.05
CV (%) 20.45 5.11 9.87 4.75 16.59
Pentecoste
---Genotypes (G) 21 207.58** 49.65** 25.99** 43.91** 185208.34**
Residual 63 18.28 1.36 1.30 0.79 34657.09
Mean 15.01 18.97 13.76 19.59 915.67
CV (%) 28.48 6.14 8.28 4.56 20.33
Quixadá
---Genotypes (G) 21 31.01** 26.50** 26.22** 54.56** 110348.8669**
Residual 63 7.22 1.42 0.98 0.46 26900.70
Mean 11.16 17.43 11.83 19.34 703.44
CV (%) 24.07 6.84 8.39 3.52 23.32
The different productivities between genotypes within each environment are due to genetic, physiological and morphological traits intrinsic of each
genotype evaluated (SANTOSet al., 2009).
Freire Filho et al. (2005) studying cowpea
genotypes in Teresina (State of Piauí), have obtained
results similar to found herein, where the genotypes responded differently to variation in the environment. This reinforces the need for path analysis for each environment.
Table 3 - Mean values of grain yield and number of pods per plant of the 22 cowpea genotypes in the environments of Cascavel, Fortaleza, Pentecoste and Quixadá
Genotypes --- PROD (kg ha-1) --- --- NPP
---Casc.* Fort. Pent. Qui Casc. Fort. Pent. Qui.
CE-03 451.03 c* 373.53 b 1204.09 a 631.60 c 10.59 b 778 c 22.3 b 15.0 a
CE-25 115.55 c 441.11 b 803.50 b 739.23 b 234 c 564 c 89 c 86 b
CE-31 329.05 c 454.94 a 1131.15 a 872.37 a 451 c 560 c 14.8 c 10.1 b
CE-46 228.35 b 371.58 b 689.71 c 830.67 b 438 c 614 c 11.8 c 14.1 a
CE-73 262.90 e 407.12 b 997.25 a 997.70 a 297 c 512 c 15.8 c 13.7 a
CE-77 231.61 e 429.63 b 1161.59 a 979.04 a 353 c 549 c 19.7 b 13.1 a
CE-104 221.59 e 586.91 a 1001.82 a 556.32 c 351 c 10.08 b 14.9 c 83 b
CE-113 86.88 f 385.72 b 880.76 b 615.36 c 126 c 532 c 88 c 80 b
CE-596 245.36 e 491.55 a 969.36 a 795.48 b 424 c 686 c 11.5 c 10.2 b
CE-790 73.18 f 404.41 b 559.90 c 592.31 c 599 c 648 c 77 c 98 b
CE-796 443.67 c 537.35 a 1038.58 a 564.06 c 871 b 976 b 21.7 b 11.7 a
CE-798 191.62 e 339.94 b 889.30 b 409.83 c 332 c 634 c 11.7 c 64 b
CE-930 229.42 e 412.48 b 682.29 c 729.42 b 425 c 448 c 69 c 74 b
CE-933 218.01 e 364.80 b 744.65 b 723.13 b 296 c 537 c 91 c 10.8 b
CE-937 189.68 e 370.62 b 614.06 c 719.51 b 309 c 460 c 98 c 99 b
CE-939 247.07 e 519.37 a 930.26 a 818.66 b 280 c 654 c 10.5 c 10.3 b
CE-940 410.16 c 510.79 a 863.58 b 991.80 a 497 c 629 c 85 c 10.2 b
CE-946 77.97 f 274.61 b 546.50 c 448.69 c 263 c 601 c 88 c 85 b
CE-947 218.68 e 364.38 b 896.87 b 593.58 c 555 c 10.66 19.8 b 12.9 a
CE-949 561.07 b 406.61 b 1301.54 a 716.88 b 11.31 b 11.59 b 28.0 a 15.6 a
CE-956 340.60 d 496.70 a 1198.46 a 605.59 c 10.01 b 13.18 a 30.3 a 15.2 a
CE-957 680.01 a 362.78 b 1037.92 a 556.32 c 17.68 a 11.24 b 27.5 a 14.7 a
CV (%) 24.15 16.59 20.33 23.31 37.79 20.45 28.48 24.07
*Casc - Cascavel, Fort - Fortaleza, Pent - Pentecoste and Qui - Quixadá, *Means followed by the same lower case are not significantly different within each location (column) by the Scott-Knott’s test at 5% probability
standing out the mean values of Pentecoste (Tables 3, 4 and 5).
For the trait pod length, in Cascavel and Quixadá, had highlighted the genotypes CE-940 (22.55 and 21.32 cm, respectively), in Fortaleza and Pentecoste, the CE-940 (25.37 cm) and CE-104 (27.42 cm), respectively (Table 4).
Considering the grains number per pod, the genotypes that stood out in Cascavel (31, 73, CE-77, CE-796, CE-930 and CE-933) presented more than 12 grains per pod. In Fortaleza, stood out the genotypes CE-25, CE-31, CE-73, CE-77, CE-930 and CE-933 (SNP>16). The genotypes CE-25, CE-31, CE-73, CE-77, CE-104, CE-113, CE-796, CE-930, CE-933 and CE-939 had been prominent in Pentecoste (SNP>15), and in Quixadá, the genotypes CE-25, CE-31 and CE-77 (SNP>14) (Table 4).
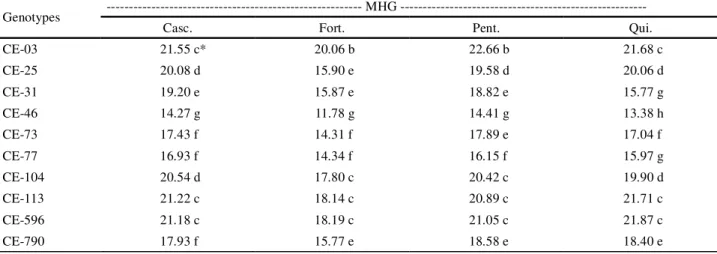
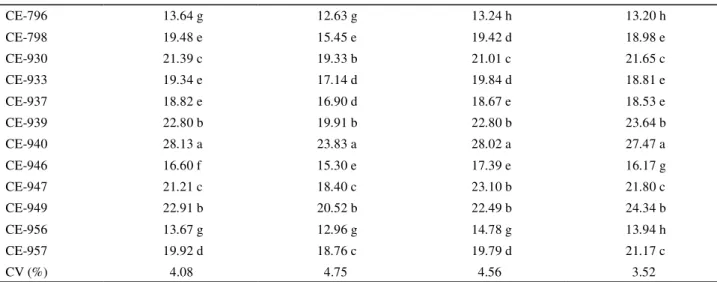
The mass of 100 grains was the most stable component when compared the four environments; with highlight the genotype CE-940 with 28.02, 28.13, 27.47 and 23.83 for Pentecoste, Cascavel, Quixadá and Fortaleza, respectively.
In the Table 6 are listed the values of genetic and statistic parameters for the variables, number of pods per plant, pod length, grains number per pod, mass of 100 grains, and productivity of the 22 cowpea genotypes evaluated in Cascavel, Fortaleza, Pentecoste and Quixadá.
*Means followed by the same lower case are not significantly different within each location (column) by the Scott-Knott’s test at 5% probability,
**Casc - Cascavel, Fort - Fortaleza, Pent - Pentecoste and Qui - Quixadá
Table 5 - Mean values of the mass of 100 grains (MHG) of the 22 cowpea genotypes in the environments of Cascavel, Fortaleza, Pentecoste and Quixadá
Genotypes -- MHG
---Casc. Fort. Pent. Qui.
CE-03 21.55 c* 20.06 b 22.66 b 21.68 c
CE-25 20.08 d 15.90 e 19.58 d 20.06 d
CE-31 19.20 e 15.87 e 18.82 e 15.77 g
CE-46 14.27 g 11.78 g 14.41 g 13.38 h
CE-73 17.43 f 14.31 f 17.89 e 17.04 f
CE-77 16.93 f 14.34 f 16.15 f 15.97 g
CE-104 20.54 d 17.80 c 20.42 c 19.90 d
CE-113 21.22 c 18.14 c 20.89 c 21.71 c
CE-596 21.18 c 18.19 c 21.05 c 21.87 c
CE-790 17.93 f 15.77 e 18.58 e 18.40 e
Table 4 - Mean values of pod length (PL) and grains number per pod (SNP) of the 22 cowpea genotypes in the environments of Cascavel, Fortaleza, Pentecoste and Quixadá
Genotypes --- PL --- SNP
---Casc.** Fort. Pent. Qui. Casc. Fort. Pent. Qui.
CE-03 16.25 d* 16.40 e 16.81 f 16.97 c 8.62 c 9.17 c 10.30 c 8.72 f
CE-25 17.75 c 19.12 c 20.07 d 18.76 c 12.4 b 16.90 a 16.90 a 14.42 a
CE-31 20.01 b 21.61 b 21.77 c 19.93 b 13.07 a 17.32 a 16.55 a 15.05 a
CE-46 16.91 d 17.62 d 15.92 f 17.10 c 12.23 b 14.60 b 13.82 b 13.40 b
CE-73 18.22 c 19.60 c 18.71 e 17.92 c 12.87 a 17.65 a 15.52 a 13.82 b
CE-77 19.17 c 20.25 c 18.70 e 18.38 c 13.97 a 17.45 a 16.35 a 14.87 a
CE-104 21.74 a 23.05 b 27.42 a 22.35 a 11.82 b 13.90 b 15.47 a 11.12 d
CE-113 19.61 c 22.57 b 21.60 c 18.42 c 11.92 b 15.52 b 15.40 a 13.83 b
CE-596 16.86 d 17.75 d 18.40 e 16.61 c 11.05 b 15.15 b 14.73 b 12.3 c
CE-790 13.89 e 19.10 c 19.60 d 17.58 c 6.82 c 14.87 b 13.70 b 10.85 e
CE-796 16.37 d 16.87 e 17.05 f 15.77 d 14.22 a 14.90 b 15.10 a 12.82 c
CE-798 18.33 c 19.27 c 18.55 e 18.10 c 10.92 b 13.37 b 13.02 b 11.72 d
CE-930 20.33 b 22.02 b 21.52 c 20.19 b 13.8 a 17.82 a 16.70 a 15.45 a
CE-933 18.51 c 20.70 c 18.75 e 17.87 c 13.22 a 16.82 a 15.27 a 13.02 c
CE-937 18.58 c 21.68 b 20.88 c 19.93 b 12.02 b 15.47 b 13.75 b 12.95 c
CE-939 17.73 c 18.25 d 21.07 c 17.02 c 11.77 b 15.07 b 15.52 a 13.42 b
CE-940 22.55 a 25.37 a 25.36 b 21.32 a 11.45 b 16.02 b 14.27 b 11.47 d
CE-946 11.87 e 12.52 g 12.65 g 12.51 e 8.7 c 10.65 c 11.12 c 9.40 f
CE-947 16.05 d 16.96 e 16.22 f 15.02 d 8.0 c 10.20 c 8.42 d 7.32 g
CE-949 15.4 d 15.90 e 16.35 f 14.49 d 7.22 c 7.25 d 9.17 d 7.00 g
CE-956 13.47 e 12.70 g 12.47 g 12.53 e 9.77 c 11.15 c 10.75 c 8.96 f
CE-957 16.35 d 14.87 f 17.41 f 14.51 d 8.05 c 6.97 d 10.87 c 8.32 g
Casc - Cascavel, Fort - Fortaleza, Pent - Pentecoste and Qui - Quixadá, *Means followed by the same lower case are not significantly different within each location (column) by the Scott-Knott’s test at 5% probability
Table 6- Genetic and statistical parameters for the response variables analyzed in different cowpea genotypes, for the four environments
Description NPP PL SNP MHG PROD
Cascavel
---CVg (%) 68.51 14.16 19.67 16.99 54.91
CVg/CVe 1.81 1.70 1.50 4.16 2.27
2g 14.12 6.17 4.74 10.94 22833.29
2e 1.07 0.53 0.53 0.16 1104.85
Heritability(%) 92.93 92.00 89.98 98.57 95.38
- Fortaleza
---CVg (%) 33.41 17.19 23.24 16.94 15.66
CVg/CVe 1.63 3.36 2.35 3.56 0.94
2g 5.95 10.48 10.60 8.27 4388.32
2e 0.56 0.23 0.48 0.16 4928.32
Heritability(%) 91.00 97.84 95.68 92.70 78.08
Pentecoste
---CVg (%) 45.82 18.32 18.06 16.75 21.19
CVg/CVe 1.61 2.98 2.18 3.67 0.99
2g 47.32 12.07 6.17 10.77 37637.81
2e 18.27 1.35 1.29 0.79 34657.09
Heritability(%) 91.19 97.27 95.00 98.17 81.29
Quixadá
---CVg (%) 21.84 14.37 21.22 19.01 20.53
CVg/CVe 0.91 2.10 2.53 5.41 0.88
2g 5.95 6.27 6.31 13.53 20862.04
2e 1.80 0.35 0.25 0.11 6725.17
Heritability(%) 76.71 94.64 96.24 99.15 75.62
CE-796 13.64 g 12.63 g 13.24 h 13.20 h
CE-798 19.48 e 15.45 e 19.42 d 18.98 e
CE-930 21.39 c 19.33 b 21.01 c 21.65 c
CE-933 19.34 e 17.14 d 19.84 d 18.81 e
CE-937 18.82 e 16.90 d 18.67 e 18.53 e
CE-939 22.80 b 19.91 b 22.80 b 23.64 b
CE-940 28.13 a 23.83 a 28.02 a 27.47 a
CE-946 16.60 f 15.30 e 17.39 e 16.17 g
CE-947 21.21 c 18.40 c 23.10 b 21.80 c
CE-949 22.91 b 20.52 b 22.49 b 24.34 b
CE-956 13.67 g 12.96 g 14.78 g 13.94 h
CE-957 19.92 d 18.76 c 19.79 d 21.17 c
CV (%) 4.08 4.75 4.56 3.52
and 45.82% (NPP). For Quixadá, between 19.01% (MHG) and 21.84 (NPP). The values indicate the genetic variability in cowpea genotypes in the evaluated traits, indicating the possibility of selection.
Of the yield components, the number of pods per plant presented the highest genetic coefficient of variation for all tested environments, ranging from 21.84 to 68.51%. These high estimations, according to Teixeiraet al. (2007), are due to genetic variability
of the genotypes, once each contributes to a distinct genetic identity.
The variables that contributed most to genetic coefficient of variation were the number of pods per plant and productivity. Several studies have found results similar to the present study. Andrade et al. (2010), studying the
genetic variability in cowpea, registered a maximum genetic coefficient of variation for the grain production of 31.62%. Examining the genetic variability and correlations in cowpea on the production of green bean, Souzaet al.
(2007), also recorded genetic coefficients of variation higher for the number of pods per plant (22.65%) and production (20.86%). Also investigating genetic parameters in cowpea for the production of green
beans, Andradeet al. (2010) verified higher estimates
of genetic coefficient of variation for the production of green pods, indicating this trait as the one with highest variability for the conduction of selection.
The ratio CVg/CVe ranged from 0.88 (PROD) to 5.41 (MHG). Values below unity have occurred in Fortaleza, Pentecoste and Quixadá for the productivity, underlining that this variable has influence from the environment, hindering thus the selection process.
Souza et al. (2007) found similar results, with values
between 0.66 and 1.68, and affirmed that values above unity imply in situations favorable to selection, since the genetic factor is superior to environmental.
For the heritability, the pod length, grains number per pod, and mass of 100 grains presented values above 90% in all studied environments, except the grains number per pod in Cascavel (89.98%). However, the number of pods per plant and productivity ranged from 75.62 to 95.38%.
Given the heritability estimates in the evaluated environments, the productivity had the highest variation. This is probably because it is a trait controlled by several genes, pointing out that the grain productivity is strongly influenced by environmental conditions of more difficult management (LANA; CARDOSO; CRUZ, 2003).
In relation to the heritability, Kurek et al.
(2001) working with common bean, affirmed that the
traits with low heritability tend to hinder the selection process, maybe because they are under environmental influence. On the other hand, if an auxiliary trait has high heritability and is correlated with the interest trait with low heritability, it is more advantageous to perform the selection indirectly through the auxiliary trait.
In the diagnosis of multicollinearity, this was classified as low multicollinearity, according to the criteria proposed by Montgomery and Peck cited by Cruz and Carneiro (2003). Several authors emphasizes the importance of this study when it has aimed to carry out analyzes regression, of path, of index selection, and others. Cruz and Carneiro (2003) report that estimates of the parameters under multicollinearity, can take values absurdities or no consistency with the biological phenomena studied.
In the Table 7 are expressed the direct and indirect effects and the coefficients of genetic correlation between the traits pod length, number of pods per plant, grains number per pod, mass of 100 grains with the productivity of 22 cowpea genotypes evaluated in four environments.
The coefficient of determination (R2) and the
residual effect indicate how much the explanatory variables determine the productivity. The coefficient of determination was 0.905; 0.756; 0.868 and 0.776 and the residual effect was 0.309; 0.494; 0.363 and 0.472 for Cascavel, Fortaleza, Pentecoste and Quixadá, respectively.
Analyzing the correlation coefficient in Cascavel, it was possible to observe that the productivity is positively correlated with the number of pods per plant (0.864) and mass of 100 grains (0.169), indicating that increases in these traits are positively reflected in productivity, and negatively with the grains number per pod (-0.200), pointing out that the higher the number of grains per pod the lower the productivity, and the pod length had no relationship (-0.007) with the productivity.
In Fortaleza, the traits pod length (0.309), number of pods per plant (0.271), grains number per pod (0.289) and mass of 100 grains (0.102) had positive correlation with productivity, but of low magnitude.
Furthermore, in Pentecoste the productivity had positive correlation with the number of pods per plant (0.799) and mass of 100 grains (0.042). The low correlation between pod length (-0.092) and mass of 100 grains (0.042) and productivity indicated lack of association between these variables.
Table 7 - Estimates of direct and indirect effects of productivity in cowpea and yield components: number of pods per plant, grains number per pod, mass of 100 grains, and pod length in environments of Cascavel, Fortaleza, Pentecoste and Quixadá
Traits --- Correlation estimates
---Cascavel Fortaleza Pentecoste Quixadá
-- Pod length
---Direct effect on the productivity -0.062 -0.072 -0.151 0.158
Indirect effect via NPP -0.401 -0.706 -0.580 -0.426
Indirect effect via SNP 0.294 0.949 0.408 0.561
Indirect effect via MHG 0.163 0.138 0.231 0.108
Total -0.007 0.309 -0.092 0.402
Number of pods per plant
---Direct effect on the productivity 1.089 1.255 1.223 0.819
Indirect effect via PD 0.231 0.040 0.071 -0.082
Indirec teffect via SNP -0.233 -1.030 -0.396 -0.443
Indirect effect via MHG -0.015 0.006 -0.100 -0.059
Total 0.864 0.271 0.799 0.235
- Grains number per pod
---Direct effect on the productivity 0.451 1.368 0.670 0.913
Indirect effect via PD -0.040 -0.049 -0.092 0.097
Indirect effect via NPP -0.561 -0.945 -0.723 -0.397
Indirect effect via MHG -0.050 -0.083 -0.069 -0.102
Total -0.200 0.289 -0.215 0.511
Mass of 100 grains
---Direct effect on the productivity 0.322 0.396 0.473 0.421
Indirect effect via PD -0.032 -0.025 -0.074 0.040
Indirect effect via NPP -0.051 0.021 -0.258 -0.115
Indirect effect via SNP -0.070 -0.289 -0.098 -0.222
Total 0.169 0.102 0.042 0.125
Coefficient of determination 0.905 0.756 0.868 0.776
Residual effect 0.309 0.494 0.363 0.472
Therefore, the yield component with greater effect on the productivity in the evaluated environments was the number of pods per plant. Divergent results were verified by Ramos Júnior; Lemos and Silva (2005), which observed greater influence from the mass of 100 grains and grains number per pod on the productivity.
Given the above, it was observed that the yield components and productivity, for each environment, had been correlated with different magnitudes. In relation to the different magnitudes of correlations, Ribeiro et al.
(2001) have ascribed to the fact that they were estimated in different environments. With this, Santos and Vencovsky (1986) affirmed that new correlations should be estimated to aid in the conduct of the study.
Nevertheless, Cabral et al. (2011) commented that
the study of correlations is a measure of association and does not allow concluding about the cause-effect relationship. Silva et al. (2005) added that the path analysis provides
details of direct and indirect effects of the involved traits, thus complementing the information given by the correlation.
Considering the direct effects on productivity, in Cascavel, the number of pods per plant had the highest effect (1.089), followed by the grains number per pod (0.451) and mass of 100 grains (0.322). The pod length (-0.062) had negative effect with productivity and of low magnitude.
followed by the number of pods per plant (1.255) and mass of 100 grains (0.396). The pod length (-0.072), in Fortaleza, was equal to Cascavel, whose effect was negative and of low magnitude.
The component with the highest direct effect on productivity in Pentecoste was the number of pods per plant (1.223), followed by the grains number per pod (0.670) and mass of 100 grains (0.473). The pod length (-0.151) was similar to the other environments, that is, the effect was low and negative.
Differently from the other environments, in the municipality of Quixadá, all the yield components had direct and positive effects, including the pod length (0.158). The component with the greatest direct effect was the grains number per pod (0.913), followed by the number of pods per plant (0.819) and mass of 100 grains (0.421).
These results show that the direct effects of yield components on the productivity varied according to the environment. However, stress the importance of performing these evaluations in the different environments, since it prevent mistakes when selecting
the materials. Searches developed by Ribeiro et al.
(2003) with common bean from two crops, found variations in the direct effects as function of the genotypes, locations and years.
In turn, the indirect effects had relatively
low and negative results. In this way, Kurek et al.
(2001) also found a trend of indirect negative effects, implying in a negative correlation, i.e., the increase in one corresponds to the decrease in the other. The same authors stated that this can be attributed to intrinsic competition of the plant for photoassimilates and to environmental factors.
In general, in this study the selection through traits with indirect effects among yield components seems not to be a good strategy for genetic improvement, once in the most studied components, the indirect effects were low and negative. However, Cabralet al. (2011) indicated
the indirect selection, since the indirect effects were high, being thus an indicative of the feasibility of indirect selection for achieving gains for the trait with higher primary importance.
With regard to the direct effect on the yield, the number of pods per plant and grains number per pod presented good strategy to enhance the productivity. On the other hand, the number of pods per plant is the most important trait, among those evaluated herein, because associated with a high direct effect, it has a high genetic coefficient of variation, ratio CVg/CVe higher than unity, and high heritability, favoring the genotype selection.
CONCLUSIONS
1. The environment influenced on the intensity with which the yield traits explained the productivity;
2. The number of pods per plant is the yield component most likely of genetic gains in additional cycles of selection of more productive genotypes;
3. The number of pods per plant and the grains number per pod are the yield components with higher direct effects on productivity.
REFERENCES
ANDRADE, F. N.et al. Estimativas de parâmetros genéticos
em genótipos de feijão-caupi avaliados para feijão fresco.
Revista Ciência Agronômica, v. 41, n. 2, p. 253-258, 2010.
BERTINI, C. H. C. M.; TEÓFILO, E. M.; DIAS, F. T. C. Divergência genética entre acessos feijão-caupi do banco de germoplasma da UFC.Revista Ciência Agronômica, v. 40,
n. 1, p. 99-105, 2009.
BENVINDO, R. N. et al. Avaliação de genótipos de
feijão-caupi de porte semi-prostrado em cultivo de sequeiro e irrigado.
ComunicataScientiae, v. 1, n. 1, p. 23-28, 2010.
CABRAL, P. D. S. et al. Análise de trilha do rendimento de
grãos de feijoeiro (PhaseolusvulgarisL.) e seus componentes.
Revista Ciência Agronômica, v. 42, n. 1, p. 132-138, 2011. CARVALHO, C. G. P.et al. Correlações e análise de trilha em
linhagens de soja semeadas em diferentes épocas. Pesquisa Agropecuária Brasileira, v. 37, n. 3, p. 311-320, 2002.
CRUZ, C. D.; CARNEIRO, P. C. S.Modelos biométricos aplicados ao melhoramento de plantas. 3. ed. Viçosa: UFV, 2003. 585 p. CRUZ C. D; REGAZZI A. J.Modelos biométricos aplicados ao melhoramento genético. 3. ed. rev. Viçosa: UFV. 2004. 480 p. CRUZ, C. D. Programa GENES: análise multivariada e
simulação. Viçosa: UFV, 2006. 175 p.
FERREIRA, F. M.et al. Relações fenotípicas e genotípicas entre componentes de produção em cana-de-açúcar.
Bragantina, v. 66, n. 4, p. 605-610, 2007.
FREIRE FILHO, F. R. et al. Adaptabilidade e estabilidade
produtiva de feijão-caupi. Ciência Rural, v. 35, n. 1, p. 24-30, 2005.
GONDIM, T. C. O.et al. Análise de trilha para componentes
do rendimento e caracteres agronômicos de trigo sob desfolha. Pesquisa Agropecuária Brasileira, v. 43, n. 4, p. 487-493, 2008.
LANA, A. M. Q.; CARDOSO, A. A.; CRUZ, C. D. Herdabilidades e correlações entre caracteres de linhagens de feijão obtidas em monocultivo e em consórcio com o milho.
LI, C. C.Path analysis: aprimer. Pacific Grove: Boxwood, 1975. 346 p.
KUREK, A. J. et al. Análise de trilha como critério de
seleção indireta para rendimento de grãos em feijão.Revista Brasileira de Agrociência, v. 7, n. 1, p. 29-32, 2001. PAIVA, J. R. de.; ROSSETTI, A. G.; GONÇALVES, P. Uso de coeficiente de caminhamento no melhoramento de seringueira.Pesquisa Agropecuária Brasileira, v. 17, n. 3, p. 433-440, 1982.
RAMOS JÚNIOR, E. U.; LEMOS, L. B.; SILVA, T. R. B. Componentes da produção, produtividade de grãos e características tecnológicas de cultivares de feijão.
Bragantia, v. 64, n. 1, p. 75-82, 2005.
RIBEIRO, N. D.et al. Correlações genéticas de caracteres
agromorfológicos e suas implicações na seleção de genótipos de feijão carioca.Revista Brasileira de Agrociência, v. 7, n. 2, p. 93-99, 2001.
RIBEIRO, N. D.et al. Genotype x environmentinteraction in common beanyiel dandyield components.Crop Breedingand Applied Biotechnology, v. 3, n. 1, p. 27-34, 2003.
SANTOS, J. B.; VENCOVSKY, R. Correlação fenotípica e genética entre alguns caracteres agronômicos do feijoeiro
(Phaseolusvulgaris L.).Ciência Prática, v. 103, p. 265-272, 1986.
SANTOS, R. C.; CARVALHO, L. P.; SANTOS, V. F. Análise de coeficiente de trilha para os componentes de produção em amendoim. Ciência Agrotécnica, v. 24, p. 13-16, 2000.
SANTOS, J. F.et al. Produção e componentes produtivos de
variedades de feijão-caupi na micro região cariri paraibano.
Engenharia Ambiental, v. 6, n. 1, p. 214-222, 2009. SILVA, S. A. et al. Análise de trilha para os componentes de rendimento de grãos em trigo.Bragantia, v. 64, n. 2, p.
191-196, 2005.
SOUZA, C. L. C.et al. Variability and correlations in cowpea
populations for green-grain production.Crop Breeding and Applied Biotechnology, v. 7, n. 3, p. 262-269, 2007. TEIXEIRA, N. J. P. et al. Produção, componentes de
produção e suas inter-relações em genótipos de feijão-caupi (Virnaunguiculata (L.) Walp.) de porte ereto.Revista Ceres,
v. 54, n. 314, p. 374-382, 2007.