Rev. Caatinga
GENOTYPE BY ENVIRONMENT INTERACTION IN GREEN COWPEA
ANALYZED VIA MIXED MODELS
1JOSÉ TORRES FILHO2*, CHRISTIANE NORONHA GOMES DOS SANTOS OLIVEIRA2, LINDOMAR MARIA DA
SILVEIRA2, GLAUBER HENRIQUE DE SOUSA NUNES2, ANTÔNIO JOSÉ RODRIGUES DA SILVA2, MATHEUS
FELIPE NOGUEIRA DA SILVA2
ABSTRACT - The restricted maximum likelihood/best linear unbiased prediction (REML/BLUP) mixed model method has been used to study the effects of genotype by environment interaction (G x E) in various crops including cowpea. This work aimed to analyze the G x E interaction via mixed models to identify cowpea genotypes that meet high adaptability, stability and productivity of pods and green grains when grown under Mossoró, Rio Grande do Norte State conditions. Crop value and use were evaluated in two growing seasons, using randomized complete blocks design with 23 genotypes and four replications. The genetic parameters were estimated by the REML/BLUP procedure and selection was based on the harmonic mean of the relative performance of genetic values (HMRPGV). Agreement between the HMGV, relative performance of genotypic values (RPGV) and HMRPGV statistics, provided genotype discrimination. Furthermore, the HMRPGV results enabled the simultaneous selection of superior genotypes for productivity, adaptability and stability. For the productivities of pods and green grains, the most notable genotypes were the cultivars BRS Xiquexique and BRS Aracê, and the line MNC05-835B-15, which showed a high productivity of grains, adaptability and stability, and could be grown in the two growing seasons considered in the study.
Keywords: Adaptability. BLUP/REML. Stability. Vigna unguiculata.
INTERAÇÃO GENÓTIPOS x AMBIENTES EM GENÓTIPOS DE FEIJÃO-CAUPI VERDE ANALISADA VIA MODELOS MISTOS
RESUMO- A metodologia de modelos mistos REML/BLUP tem sido empregada para estudar os efeitos da interação genótipos x ambientes (G x E) em várias culturas, inclusive em feijão-caupi. O objetivo deste trabalho foi analisar a interação genótipos por ambientes em feijão-caupi via modelos mistos e identificar genótipos que reúnam alta adaptabilidade, estabilidade e produtividade de vagens e grãos verdes nas condições de Mossoró, RN. Os genótipos foram avaliados em ensaios de valor de cultivo e uso conduzidos em duas épocas de cultivo, sob delineamento experimental de blocos completos casualizados, com 23 genótipos e quatro repetições. Os parâmetros genéticos foram estimados via procedimento REML/BLUP, e a seleção baseou-se no método da média harmônica do desempenho relativo dos valores genéticos (MHPRVG). Houve concordância entre as estatísticas MHVG, PRVG e MHPRVG na discriminação dos genótipos, sendo que esta última possibilitou a seleção simultânea de genótipos superiores em produtividade, adaptabilidade e estabilidade. Para as produtividades de vagens e grãos verdes os genótipos de maior destaque foram as cultivares BRS Xiquexique, BRS Aracê e a linhagem MNC05-835B-15 que reuniram alta produtividade de grãos, adaptabilidade e estabilidade, podendo ser cultivados nas duas épocas de cultivo consideradas no estudo.
Palavras-chave: Adaptabilidade. BLUP/REML. Estabilidade. Vigna unguiculata.
_____________________
*Corresponding author
1Received for publication in 08/14/2016; accepted in 11/30/2016. Paper approved from IV CONAC 2016.
Extracted from the second author's Master's dissertation.
Rev. Caatinga
INTRODUCTION
Cowpea [Vigna unguiculata (L.) Walp.], an African leafy vegetable, was introduced in Brazil by the State of Bahia after it was brought in by Portuguese settlers in the middle of the sixteenth century. It is currently cultivated in several Brazilian states (FREIRE FILHO, 1988). Although the species has a well-established association with subsistence production, particularly in the North and Northeast of Brazil, it has increasingly gained space between the great crops, as an interim harvest in productive arrangements or as a main culture in the Brazilian Cerrados, mainly in the State of Mato Grosso (FREIRE FILHO, 2011).
The production of cowpea is more concentrated in northeastern Brazil, in semi-arid areas, where other annual legumes do not develop satisfactorily due to irregular rainfall and high temperatures (FREIRE FILHO, 2011). Even though these factors are limiting for many crops of economic interest, it does not prevent the cultivation of cowpea, which, besides tolerating these climatic conditions, presents a low cost of production compared to other species of economic interest in the region. The flexibility of its exploitation is also a factor that can be indicated as responsible for the wide cowpea cultivation in the region because it can be used for the production of both dry grain and green beans. The green bean production can add value to the product and can be a viable alternative for cowpea producers (ANDRADE, 2010), either to supply local markets or processing industries.
The exploitation of cowpea for the production of green grains may be an alternative for producers in the Northeast region, thus avoiding competition with the high-tech entrepreneurs who achieve productivities that are often higher than those observed for most northeastern states in Brazil. In particular, in areas where irrigation is possible, green bean cultivation can be practiced throughout the year. However, when using adapted cultivars, consideration must be given not only to the climate of the cropping region but particularly the market characteristics, given the consumer will be responsible for the acceptance of the product.
Considering that the expression of the productive potential of cowpea genotypes can be positively or negatively affected by the environmental conditions of the place of cultivation, it is recommended that the evaluations be done in several places, or at representative seasons of the region, in which it is intended to cultivate the cowpea. In the evaluation of cultivars under various cultivation conditions, the interaction of genotypes
by environments (G x E) is common. This phenomenon is explained by the differential behavior of the genotypes in different environments. The interaction G x E has a role in the phenotypic manifestation and may hinder the work of the breeder in recommending cultivars or in the selective process (NUNES et al., 2011). There are many published studies on the G x E interaction of cowpea, regarding various regions of the country and the various growth habits of the plant, whether erect, semi-erect, semi-prostrate or prostrate, for green grains and dry grains (SANTOS et al., 2008; PASSOS et al., 2011; BARROS et al., 2013; TEODORO et al., 2015a; SANTOS et al., 2016).
Many methods to study the adaptability and productive stability of cowpea genotypes have been proposed. These include the more traditional ones, to those based on analysis of variance, linear regression, non-linear regression and segmented regression (SANTOS et al., 2008), well as more recent approaches, such as the multivariate analyses, AMMI and GGE Biplot (BARROS et al., 2013), and neural networks (TEODORO et al., 2015b).
In recent years, there has been an increase in the application of mixed models to various themes of plant breeding of annual crops, such as in the analysis of the G x E interaction. In this context, an alternative to studying the adaptability and stability of genotypes is the method of harmonic mean relative performance of genotypic values (HMRPGV), advocated by Resende (2004). Although this method has been applied to various cultures, its use in value and cultivation trials with cowpea remain restricted (SANTOS et al., 2016; TORRES et al. 2015; TORRES et al., 2016).
The HMRPGV method generates results in the unit or scale of the assessed trait that can be directly interpreted as genetic values. Furthermore, it allows simultaneous selection for adaptability, stability and productivity. The model adjusts the effects of environments and blocks within environments in the vector of fixed effects, thus contemplating all degrees of freedom available from these sources of variation. Thus, for predicted genotypic values obtained for a given genotype, in each environment, data from all the environments are used simultaneously. Also, random effects (genotypes and G x E interaction) are predicted with greater precision than other methods because the entire data set is used and interaction noises are eliminated when best linear unbiased predictions (BLUPs) are produced (RESENDE, 2007a).
Rev. Caatinga
productivity, adaptability and stability, in Mossoró, Rio Grande do Norte (Brazil).
MATERIAL AND METHODS
Twenty-three cowpea genotypes were used
(Table 1), of which, 20 were from Embrapa Meio-Norte, Teresina-PI and three were local
cultivars collected from Rio Grande do Norte municipalities.
Table 1. Cowpea genotypes evaluated for green bean production.
1, 2, 3Local cultivars marketed as green bean in the states of Ceará, Piauí and Mato Grosso; 4Local cultivars used to produce dry and green grains in the state of Rio Grande do Norte.
Two experiments were carried out at the Experimental Garden of the Department of Plant Sciences (DPS) at the Federal Rural University of Semi-Arid (FRUSA), Campus Mossoró, RN, located at 5º11'S latitude, 37º20'W longitude and 18 m altitude. The climate according to Köppen's classification is 'BShW', namely dry and very hot, with a dry climatic season (June to January) and a rainy season (February to May). The temperature
ranges from 21.3-34.5ºC. The average annual rainfall is around 625 mm (CARMO FILHO; ESPÍNOLA SOBRINHO; MAIA NETO, 1991). The soil of the experimental area was classified as Ultisol (EMBRAPA, 1999). The experiments were conducted from March 23-May 17 and August 13-October 24, 2014. The temperature and precipitation data that occurred during these periods is shown in Figure 1.
Figure 1. Mean air temperature and rainfall that occurred in Mossoró, RN, from March to November 2014.
Treatments Genotypes Genotype types
1 MNC00-586F-303-9 Line
2 MNC00-595F-2 Line
3 MNC00-595F-27 Line
4 MNC05-835B-15 Line
5 MNC05-835-B-16 Line
6 MNC05-841-B-49 Line
7 MNC05-847B-123 Line
8 MNC05-847B-126 Line
9 MNC99-541F-15 Line
10 BRS Guariba Cultivar
11 BRS Tumucumaque Cultivar
12 BRS Xiquexique Cultivar
13 Paulistinha1 Cultivar
14 Vagem Roxa-THE2 Cultivar
15 Azulão-MS3 Cultivar
16 Sempre-Verde-CE1 Cultivar
17 BRS Aracê Cultivar
18 Pingo-de-ouro-1-21 Cultivar
19 MNC02-701F-2 Line
20 MNC99-510f-16-1 Line
21 São Miguel4 Cultivar
22 Filipe Guerra4 Cultivar
Rev. Caatinga
The experimental design was a randomized complete block with 23 treatments and four replications. Each treatment was represented by a genotype (Table 1). The experimental plot consisted of five 5.00 m rows, with 0.80 m spacing between rows. The spacing between holes was 0.25 m, with two plants per hole. The harvest area of the plot consisted of the two central rows.
Soil preparation consisted of a plowing and harrowing at depth of 0.30 m. Prior to planting, soil samples were collected from the area for fertility analysis, which was carried out at the Plant Nutrition Laboratory of the Plant Research Center of the Semi-Arid at the DPS. The following soil results
were observed: first season (pH = 5.8; EC = 181.4 μs m-1; P = 13.9 mg dm-3 and
K = 150.1 mg dm-3); second season (pH = 7.7,
EC = 179.5 μs m-1, P = 14.0 mg dm-3 and
K = 182.25 g dm-3). Fertilization was not used
because is not the usual practice of most of the producers that grow cowpea in the municipality of Mossoró and surroundings. Drip irrigation was used. Manual weeding was performed when necessary, as well as pest control.
The following characteristics were evaluated: number of days to start flowering (NDF), defined as the number of days that elapsed from the time of planting to the appearance of the first flowers in at least 50% of the plot; number of days for green pod maturation (NDGPM); number of days that elapsed from planting to the appearance of the first green pods, at around 70% humidity; growth habit (GH), which was established through a scale of grades ranging from 1 (erect habit) to 4 (prostrate habit); green pod productivity (GPP), obtained by the weight of pods harvested in the plot harvest area in gm-1 and transformed to kg ha-1; green grains
productivity (GGP), obtained by weight of grains harvested in the plot harvest area in gm-1 and
transformed to kg ha-1, and green grain index (GGI),
determined by the equation GGI = [(GW10P/W10P) * 100] where GW10P is the
grain weight of 10 pods and W10P is the weight of 10 pods.
The Selegen-Reml/Blup software statistical model 54 (RESENDE, 2007b) was used to evaluate the adaptability and stability of the cowpea
genotypes, which is described as
y = Xb + Zg + Wc + e, where y, b, g, c, and e, correspond, respectively, to the means of the blocks through the environments (fixed vectors), genotype effects (random), G x E interaction effects (random) and of random errors, and X, Z and W = incidence matrices for b, g and c, respectively. The distributions and structures of means (E) and variances (Var), using the model adjusted from the mixed model equations were:
,
where ; in which
and represents individual heritability, in the broad sense in the block;
is the coefficient of determination of the effects of G x E interaction;
is the genotypic variance among cowpea
genotypes; is the variance of the G x E
interaction; is the residual variance between
plots, and corresponds
to the genotype correlation of the genotypes, through environments.
The interactive estimators of the variance components, by restricted maximum likelihood (REML), via the Expectation-Maximization (EM) algorithm, are:
;
; and ;
where: and are derived from
, where C is the coefficient matrix of the mixed model equations; tr is the dot matrix operator; r(x) is the rank of the matrix x; N is the total number of data, q
is the number of genotypes, and s is the number of G x E combinations.
Using this model, the BLUP or REML/BLUP predictors of the free genotypic values of the
interaction G x E were obtained by , where
is the average of all the environments and is the free genotypic effect of the interaction G x E. For each environment j, genotypic values (Vg) are
Rev. Caatinga
mean of environment j, is the genotype effect of
genotype i in environment j, and is the effect of G x E interaction relative to genotype i.
The prediction of the genotypic values, obtained by capitalizing the average interaction
in the various environments, was given by
, which was calculated by:
, where is the general average of all environments; n is the number of environments
and is the genotype effect of genotype i.
Simultaneous selection for productivity, stability and adaptability of cowpea genotypes was performed by the HMRPGV, which is calculated as
, where n is the number of sites where
genotype i was evaluated and is the genotype value of the genotype i in the environment j, expressed as the proportion of the mean of that environment.
RESULTS AND DISCUSSION
In the context of mixed models, selective accuracy (Acg) was used to evaluate the experimental accuracy. This parameter includes the experimental coefficient of variation, the number of repetitions and the genotypic coefficient of variation. Based on the classification of Resende and Duarte
(2007), where a moderate accuracy is ≥ 0.50 but ≤ 0.65, the NDF, GH and GGI presented a
moderate accuracy. For the characteristics NDGPM, GPP and GGP, a low accuracy (0.10 ≤ Acg < 0.50) was observed (Table 2).
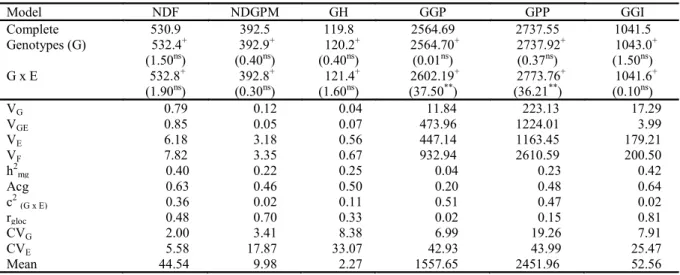
Table 2. Analysis of deviance, estimates of variance components, mean heritability and selective accuracy of six characteristics obtained from the evaluation of 23 cowpea genotypes evaluated in two growing seasons.
Likelihood ratio test value (χ2): Chi-square values of 3.84 and 6.63 for significance levels of 5 and 1%,
respectively. + Deviance of the adjusted model without this effect; c2
(G x E): effect of interaction G x E on the phenotypic variance; h2
mg: mean heritability; Acg: Selective accuracy; rgloc: genetic correlation between all environments. NDF: number of days to start flowering, NDGPM: number of days for green pod maturation, GH: growth habit, GPP: green pod productivity, GGP: green grain productivity, and GGI: green grain index.
Elevated accuracies indicate a high correlation between predicted and true genotypic values. Therefore, the obtained accuracies revealed a low to moderate experimental quality and, therefore, less security and credibility in the selection of superior genotypes regarding the characteristics studied. Estimates of accuracy in cowpea trials in the literature are limited. The estimate for the production of green grains in the present study was inferior to that observed (0.82) by Torres et al. (2015), when evaluating semi-prostrate cowpea genotypes in four
environments in the State of Mato Grosso do Sul. The absence of significance for the effect of genotypes, for all the characteristics (Table 2), indicates a certain homogeneity among the evaluated genotypes. The reduced values of heritability (between 0.04 and 0.42) corroborates with the lack of variability among the cultivars. The average heritability presented in the present work is estimated when the means of the blocks are used as a selection criterion (RESENDE, 2002). A comparison between works requires considerable prudence on the part of
Model NDF NDGPM GH GGP GPP GGI
Complete 530.9 392.5 119.8 2564.69 2737.55 1041.5
Genotypes (G) 532.4+ (1.50ns)
392.9+ (0.40ns)
120.2+ (0.40ns)
2564.70+ (0.01ns)
2737.92+ (0.37ns)
1043.0+ (1.50ns)
G x E 532.8+
(1.90ns)
392.8+ (0.30ns)
121.4+ (1.60ns)
2602.19+ (37.50**)
2773.76+ (36.21**)
1041.6+ (0.10ns)
VG 0.79 0.12 0.04 11.84 223.13 17.29
VGE 0.85 0.05 0.07 473.96 1224.01 3.99
VE 6.18 3.18 0.56 447.14 1163.45 179.21
VF 7.82 3.35 0.67 932.94 2610.59 200.50
h2
mg 0.40 0.22 0.25 0.04 0.23 0.42
Acg 0.63 0.46 0.50 0.20 0.48 0.64
c2(G x E) 0.36 0.02 0.11 0.51 0.47 0.02
rgloc 0.48 0.70 0.33 0.02 0.15 0.81
CVG 2.00 3.41 8.38 6.99 19.26 7.91
CVE 5.58 17.87 33.07 42.93 43.99 25.47
Rev. Caatinga
the researchers. The observed estimate for grain productivity in the present study, was lower than those observed by Passos et al. (2011) when evaluating 20 genotypes of upright cowpea in 2 years in Cruz das Almas-BA, as well as that reported by Torres et al. (2015), when comparing semi-prostrate cowpea in the State of Mato Grosso. Heritability values for grain productivity are usually medium or low because the said trait has quantitative inheritance.
A significant effect of the interaction G x E was verified only for GGP and GPP (Table 2), indicating that for these characteristics, there was a differential behavior of the genotypes with the growing season. In genotype evaluation trials, the G x E interaction plays a fundamental role and can greatly influence the selection process of superior genotypes. Consequently, the process of recommending new cultivars can sometimes be difficult. The interaction G x E in cowpea has been commonly observed in elite line trials in several Brazilian states (SANTOS et al., 2008; VALADARES et al., 2010; BARROS et al., 2013; SANTOS et al., 2016).
It is important to estimate the magnitude of the interaction G x E on the phenotypic manifestation because its pronounced occurrence evidences the need to evaluate the genotypes in several environments to ensure greater security in the recommendation of the best ones. The c2 component quantifies how much of the phenotypic variance is
explained by the variance component of the interaction G x E. In the present work, it was verified that the interaction G x E influenced 51 and 47% of the phenotypic variance for the characters GGP and GPP, respectively (Table 2). This result reveals the difficulty in recommending genotypes. The reduced estimates of the average genotypic correlation with the genotypes performance (rgloc) confirm the considerable influence of the interaction G x E on the characteristics studied. Regarding the interaction G x E, the small rloc values evidenced the greater predominance of the complex component (which depends on the genetic correlation of the genotypes in the environments) than the simple component (which is linked to the differences in variability between the genotypes) (CRUZ; CASTOLDI, 1991). In this situation, there are different rankings between genotypes in different environments. The predominance of the complex component of the G x E interaction in cowpea was also found by Santos et al. (2008), Valadares et al. (2010), Passos et al. (2011), Barros et al. (2013), Teodoro et al. (2015a) and Santos et al. (2016).
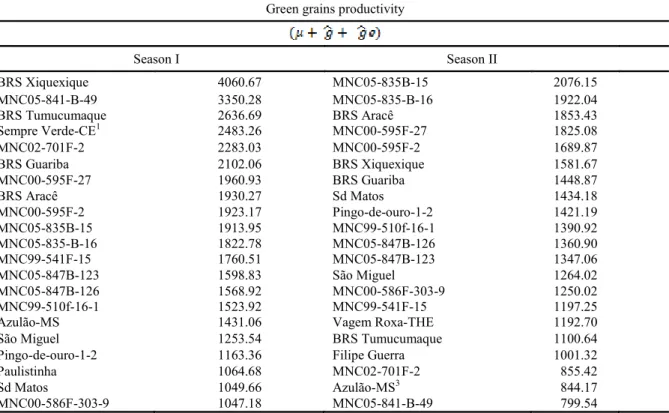
Therefore, the genotypes rankings in the two growing seasons for the GGP and GPP characteristics were altered (Table 3). For example, for GGP, line MNC05-841-B-49 has the highest
estimate of in the first season, while in the second season it presented one of the smallest estimates.
Table 3. Estimates of for the productivity of green pods and grains in cowpea genotypes evaluated in
two growing seasons.
Green grains productivity
Season I Season II
BRS Xiquexique 4060.67 MNC05-835B-15 2076.15
MNC05-841-B-49 3350.28 MNC05-835-B-16 1922.04
BRS Tumucumaque 2636.69 BRS Aracê 1853.43
Sempre Verde-CE1 2483.26 MNC00-595F-27 1825.08
MNC02-701F-2 2283.03 MNC00-595F-2 1689.87
BRS Guariba 2102.06 BRS Xiquexique 1581.67
MNC00-595F-27 1960.93 BRS Guariba 1448.87
BRS Aracê 1930.27 Sd Matos 1434.18
MNC00-595F-2 1923.17 Pingo-de-ouro-1-2 1421.19
MNC05-835B-15 1913.95 MNC99-510f-16-1 1390.92
MNC05-835-B-16 1822.78 MNC05-847B-126 1360.90
MNC99-541F-15 1760.51 MNC05-847B-123 1347.06
MNC05-847B-123 1598.83 São Miguel 1264.02
MNC05-847B-126 1568.92 MNC00-586F-303-9 1250.02
MNC99-510f-16-1 1523.92 MNC99-541F-15 1197.25
Azulão-MS 1431.06 Vagem Roxa-THE 1192.70
São Miguel 1253.54 BRS Tumucumaque 1100.64
Pingo-de-ouro-1-2 1163.36 Filipe Guerra 1001.32
Paulistinha 1064.68 MNC02-701F-2 855.42
Sd Matos 1049.66 Azulão-MS3 844.17
Rev. Caatinga
Table 3. Continuation.
The inverse behavior occurred with the Sd Matos genotype that presented better performance in the second experiment. The GPP also presented a change in the genotypes classification between trials. This indicates that there are genotypes that can be used as a function of the growing season, allowing the G x E interaction to be exploited because it is included in the estimation of the genotype mean in
each of the growing seasons .
Although considered a rustic crop and adapted to high temperatures and water deficit, the cowpea presents differential responses of genotypes to the cultivation conditions (FREIRE FILHO, 2005). The temperatures and the rainfall observed in the first growing season were both higher than those observed in the second season (Figure 1). This variation could be responsible for the differentiated behavior of some genotypes regarding the different growing seasons.
However, cultivation of a genotype over a wide range of cropping sites or conditions (environments) is one of the objectives of cowpea breeding programs. One approach to attenuate the interaction G x E is to identify in the evaluated group those productive genotypes with greater stability and adaptability. In the context of the mixed models, the HMRPGV-BLUP technique allows the incorporation of stability, adaptability and the mean value of the trait of interest in a single statistic from genotypic data (RESENDE, 2002).
The harmonic mean of genotypic values (HMGV) is a parameter that allows selection based on stability and productivity. According to the mentioned criteria, the genotypes BRS Xiquexique, MNC05-835B-15, BRS Aracê, MNC00-595F-27 and MNC05-835-B-16 stood out for GPP. For GGP, the BRS Aracê, BRS Xiquexique, BRS Guariba, MNC00-595F-2 and MNC05-835B-15 genotypes were the highlights (Table 4).
Green grains productivity
Season I Season II
Filipe Guerra 870.63 Paulistinha 757.92
Vagem Roxa-THE 745.57 Sempre Verde-CE 492.57
Green pods productivity
Season I Season II
BRS Aracê 5598.26 MNC05-835B-15 4285.22
BRS Xiquexique 5327.95 BRS Guariba 3499.65
MNC05-841-B-49 5186.82 MNC00-595F-2 3431.62
BRS Tumucumaque 3973.96 MNC00-595F-27 2885.98
Sempre-Verde-CE1 3555.71 BRS Aracê 2842.74
MNC00-595F-2 3255.75 MNC05-835-B-16 2811.53
BRS Guariba 3198.65 BRS Xiquexique 2699.04
MNC02-701F-2 3073.01 Sd Matos 2250.27
MNC00-595F-27 2875.15 MNC05-847B-123 2232.93
MNC99-510f-16-1 2798.07 MNC00-586F-303-9 2105.96
MNC05-835-B-16 2635.21 MNC05-847B-126 2084.52
MNC99-541F-15 2590.40 MNC99-510f-16-1 2072.86
MNC05-835B-15 2588.47 Pingo-de-ouro-1-2 1968.04
MNC05-847B-126 2407.83 São Miguel 1925.24
MNC05-847B-123 2325.92 Filipe Guerra 1672.92
Azulão-MS 2023.55 Vagem Roxa-THE 1589.26
São Miguel 1812.71 Azulão-MS3 1458.68
Pingo-de-ouro-1-2 1776.52 BRS Tumucumaque 1440.60
Sd Matos 1609.47 MNC05-841-B-49 1407.05
MNC00-586F-303-9 1549.49 MNC99-541F-15 1397.86
Filipe Guerra 1475.55 MNC02-701F-2 1282.07
Paulistinha 1193.23 Paulistinha 954.13
Rev. Caatinga
Table 4. The genotypic values (HMGV), adaptability of genotypic values (AGV) and harmonic mean values of the relative performance of genotypic values (HMRPGV) for productivities of green grains of cowpea genotypes evaluated in two seasons of cultivation.
Gen: Genotype; (M*μ): HMRPGV*μ; 1: MNC00-586F-303-9; 2: MNC00-595F-2; 3: MNC00-595F-27; 4:
MNC05-835B-15; 5: MNC05-835-B-16; 6: MNC05-841-B-49; 7: MNC05-847B-123; 8: MNC05-847B-126; 9:
MNC99-541F-15; 10: BRS Guariba; 11: BRS Tumucumaque; 12: BRS Xiquexique; 13: Paulistinha; 14: Vagem
Roxa-THE; 15: Azulão-MS; 16: Sempre-Verde-CE; 17: BRS Aracê; 18: Pingo-de-ouro-1-2; 19: MNC02-701F-2; 20:
MNC99-510f-16-1; 21: São Miguel; 22: Filipe Guerra; 23: Sd Matos.
Adaptability is the ability of the genotype to be advantageously responsive to environmental improvement (MARIOTTI et al., 1976). In order to identify this characteristic, it is necessary to use appropriate methods, such as the relative performance of the genotypic values (RPGV) that capitalizes the responsiveness of each genotype to the improvement of the environment. For GPP, the results were similar to those of the HMGV, with the most prominent genotypes being BRS Xiquexique, MNC05-835B-15, BRS Aracê, MNC00-595F-27 and MNC05-835-B-16. For GGP, the highlights were BRS Aracê, BRS Xiquexique, MNC05-835B-15, BRS Guariba and MNC00-595F-2 (Table 4).
The HMRPGV method, based on genotypic values predicted by mixed models, groups in a single statistic, stability, adaptability and productivity, facilitating, in a unique way, the selection of superior
genotypes (RESENDE, 2007a). The HMRPGV * μ provides the genotypic values of each genotype penalized by instability and capitalized by the adaptability in the unit of measure of the characteristic of interest. For the GPP, the genotypes
BRS Xiquexique, MNC05-835B-15, MNC00-595F-27, BRS Aracê and MNC05-835-B-16 were highlighted, with a mean
value 1.57, 1.27, 1.22, 1.22 and 1.20 times, respectively, the average of the seasons in which they were cultivated (Table 4).
For GGP, the genotypes BRS Aracê, BRS Xiquexique, MNC00-595F-2, BRS Guariba and MNC05-835B-15 were the highlights, with an average response of 1.61, 1.53, 1.36, 1.36 and 1.28 times, respectively, the average of the environment in which they were grown (Table 4).
For GGP and GPP, simultaneously, among Gen Green pods productivity Green grains productivity
HMGV AGV HMRPGV (M*μ) HMGV AGV HMRPGV (M*μ)
1 1139.6 1195.2 0.72 1123.8 1785.4 1895.2 0.71 1750.9
2 1798.9 1834.6 1.17 1817.7 3341.4 3411.9 1.36 3330.1
3 1890.6 1931.4 1.22 1901.5 2880.6 2930.1 1.17 2879.9
4 1991.8 2060.5 1.27 1978.9 3227.4 3606.5 1.28 3127.8
5 1871.1 1929.5 1.20 1863.2 2720.5 2781.1 1.10 2709.2
6 1290.9 1920.2 0.92 1431.4 2213.6 3104.7 0.97 2390.5
7 1462.2 1490.8 0.95 1482.4 2278.5 2311.9 0.93 2284.5
8 1457.5 1486.2 0.95 1474.2 2234.5 2263.0 0.92 2255.5
9 1425.2 1471.4 0.94 1469.9 1815.8 1949.7 0.77 1888.8
10 1715.4 1768.4 1.13 1767.3 3342.4 3425.7 1.36 3323.10
11 1553.0 1791.7 1.07 1662.1 2114.6 2586.9 0.92 2250.6
12 2276.6 2691.9 1.57 2448.3 3582.9 3908.9 1.53 3741.2
13 885.5 910.0 0.58 909.93 1060.4 1076.2 0.44 1075.8
14 917.6 1031.1 0.57 884.9 1102.7 1286.3 0.43 1060.8
15 1061.9 1119.3 0.71 1107.5 1695.3 1733.6 0.71 1731.56
16 822.1 1363.8 0.59 920.4 1327.7 2043.2 0.59 1444.52
17 1891.1 1935.0 1.22 1897.2 3770.7 4111.1 1.61 3936.6
18 1279.4 1347.2 0.81 1259.4 1867.4 1916.6 0.76 1855.1
19 1244.5 1493.3 0.86 1341.9 1809.3 2096.9 0.78 1910.7
20 1454.4 1484.6 0.94 1465.1 2381.5 2429.1 0.99 2428.2
21 1258.8 1292.6 0.81 1257.9 1867.3 1908.0 0.76 1860.1
22 931.4 971.2 0.59 921.1 1568.1 1613.9 0.63 1555.5
Rev. Caatinga
the outstanding genotypes, are the cultivars BRS Xiquexique and BRS Aracê, BRS Guariba cultivar stood out mainly for GGP (Table 4).
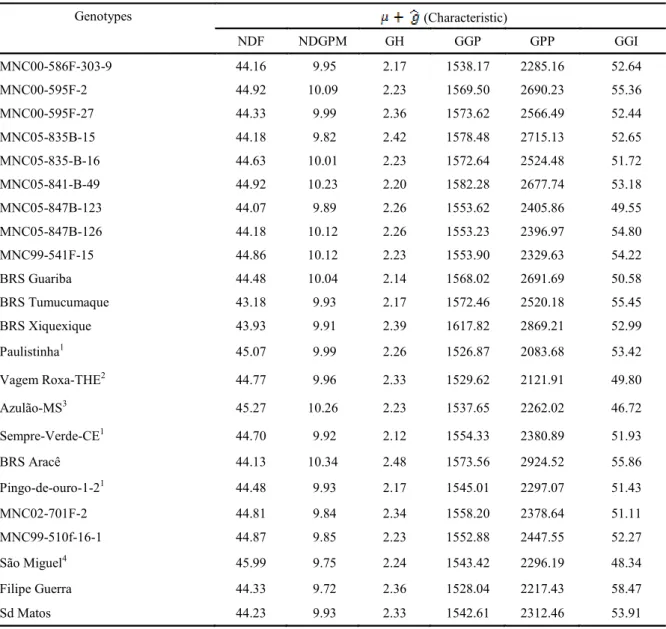
The major lineage for GPP and GGP was MNC05-835B-15, followed by MNC00-595F-27, MNC05-835-B-16 and MNC00-595F-2. Also, the HMRPGV values were greater than 1.0, producing,
therefore, more than the average of the seasons in which they were cultivated (Table 4). These lines have an NDF around 45 days (Table 5). The GGI observed for these lineages varied between 50 and 55%, which was similar to those found in the improved cultivars.
Table 5. Estimates of the genotypic mean of six characteristics evaluated in 23 genotypes of cowpea in two growing seasons.
NDF: number of days to start flowering. NDGPM: number of days for green pod maturation. GH: growth habit. GPP: green pods productivity. GGP: green grains productivity. GGI: green grains index. 1.2.3 Local cultivars commercialized in the market as green beans in the states of Ceará, Piauí and Mato Grosso; 4 Local Cultivar used for the production of green and dry grains in the State of Rio Grande do Norte.
The GGI measures the efficiency of the genotype regarding the allocation of photosynthates to the grains, a characteristic commonly observed by cowpea producers because the most productive cultivar in terms of green pods is not always the most productive in terms of green grains (FREIRE FILHO, 2005). In the present study, the best yields of green pods and grains, as well as GGIs above
50%, were observed in the same genotypes.
It should be emphasized that the creoles cultivars cultivated in the States of Ceará, Rio Grande do Norte and Piauí, presented an inferior performance to the cultivars developed by Embrapa and to the lineages themselves. Thus, it can be inferred that the producers that use these genotypes to produce green grains could increase their
Genotypes (Characteristic)
NDF NDGPM GH GGP GPP GGI
MNC00-586F-303-9 44.16 9.95 2.17 1538.17 2285.16 52.64
MNC00-595F-2 44.92 10.09 2.23 1569.50 2690.23 55.36
MNC00-595F-27 44.33 9.99 2.36 1573.62 2566.49 52.44
MNC05-835B-15 44.18 9.82 2.42 1578.48 2715.13 52.65
MNC05-835-B-16 44.63 10.01 2.23 1572.64 2524.48 51.72
MNC05-841-B-49 44.92 10.23 2.20 1582.28 2677.74 53.18
MNC05-847B-123 44.07 9.89 2.26 1553.62 2405.86 49.55
MNC05-847B-126 44.18 10.12 2.26 1553.23 2396.97 54.80
MNC99-541F-15 44.86 10.12 2.23 1553.90 2329.63 54.22
BRS Guariba 44.48 10.04 2.14 1568.02 2691.69 50.58
BRS Tumucumaque 43.18 9.93 2.17 1572.46 2520.18 55.45
BRS Xiquexique 43.93 9.91 2.39 1617.82 2869.21 52.99
Paulistinha1 45.07 9.99 2.26 1526.87 2083.68 53.42
Vagem Roxa-THE2 44.77 9.96 2.33 1529.62 2121.91 49.80
Azulão-MS3 45.27 10.26 2.23 1537.65 2262.02 46.72
Sempre-Verde-CE1 44.70 9.92 2.12 1554.33 2380.89 51.93
BRS Aracê 44.13 10.34 2.48 1573.56 2924.52 55.86
Pingo-de-ouro-1-21 44.48 9.93 2.17 1545.01 2297.07 51.43
MNC02-701F-2 44.81 9.84 2.34 1558.20 2378.64 51.11
MNC99-510f-16-1 44.87 9.85 2.23 1552.88 2447.55 52.27
São Miguel4 45.99 9.75 2.24 1543.42 2296.19 48.34
Filipe Guerra 44.33 9.72 2.36 1528.04 2217.43 58.47
Rev. Caatinga
production systems by using cultivars more appropriate for this market.
CONCLUSIONS
There was high agreement between the HMGV, RPGV and HMRPGV statistics regarding genotype discrimination, and the latter allowed the simultaneous selection of superior genotypes in productivity, adaptability and stability. BRS Xiquexique and BRS Aracê cultivars, and the MNC05-835B-15 lineage were highlighted as producing the greenest pods and grains in the environmental conditions of Mossoró, Rio Grande do Norte.
ACKNOWLEDGEMENTS
Special thanks are due to Embrapa Meio -Norte for supplying the genetic material used in this study, as well as to Universidade Federal Rural do Semi-Árido for making the facilities available to accomplish this research and to the Conselho Nacional de Pesquisa e Desenvolvimento Científico for the provision of a scholarship of scientific initiation.
REFERENCES
ANDRADE, F. N. Avaliação e seleção de linhagens de tegumento e cotilédone verdes para o mercado de feijão-caupi verde. 2010. 110 f. Dissertação (Mestrado em Produção Vegetal:
Produção e Manejo de Espécies Vegetais) – Universidade Federal do Piauí, Teresina,
2010.
BARROS, M. A. et al. Adaptabilidade e estabilidade produtiva de feijão caupi de porte semiprostrado. Pesquisa Agropecuária Brasileira, Brasília, v. 48, n. 4, p. 403-410, 2013.
CARMO FILHO, F.; ESPÍNOLA SOBRINHO, J.; MAIA NETO, J. M. Dados climatológicos de Mossoró: um município semi-árido nordestino. Mossoró, RN: ESAM, 1991. 121 p.
CRUZ, C. D.; CASTOLDI, F. L. Decomposição da interação genótipos x ambientes em partes simples e complexa. Revista Ceres, Viçosa, v. 38, n. 219, p. 422-430, 1991.
EMPRESA BRASILEIRA DE PESQUISA
AGROPECUÁRIA - EMBRAPA. Sistema
brasileiro de classificação de solos. Rio de Janeiro, RJ: Embrapa Solos, 1999. 412 p.
FREIRE FILHO. F. R. Feijão-caupi no Brasil: produção, melhoramento genético, avanços e desafios. Teresina, PI: Embrapa Meio-Norte, 2011. 84 p.
FREIRE FILHO. F. R. Melhoramento genético. In: FREIRE FILHO, F. R.; LIMA, J. A. A.; RIBEIRO, V. Q. (Eds.). Feijão-caupi: avanços tecnológicos. Brasília: Embrapa Informação Tecnológica, 2005. cap. 1, p 29-75.
FREIRE FILHO, F. R. Origem. evolução e domesticação do caupi. In: ARAÚJO, J. P. P.; WATT, E. E. (Eds.). O caupi no Brasil. Brasília: EMBRAPA, Ibadan: IITA, 1988. p. 26-46.
MARIOTTI, J. A. et al. Análisis de estabilidad y adaptabilidad de genotipos de cana de azúcar. I. Interacciones dentro de un localidad ex perimental. Revista Agronómica del Noroeste Argentino, Tucumán, v. 13, n. 14, p. 105- 127, 1976.
NUNES, G. H. S. et al. Influência de variáveis ambientais sobre a interação genótipos x ambientes em meloeiro. Revista Brasileira de Fruticultura, Jaboticabal, v. 33, n. 4, p. 1194-1199, 2011.
PASSOS, A. R. et al. Ganho por seleção direta e indireta em caupi considerando a interação G x E. Revista da FZVA, Uruguaiana, v. 18, n. 1, p. 18-33. 2011.
RESENDE, M. D. V.; DUARTE, J. B. Precisão e controle de qualidade em experimentos de avaliação de cultivares. Pesquisa Agropecuária Tropical, Brasília, v. 37, n. 3, p. 182-194, 2007.
RESENDE, M. D. V. Genética biométrica e estatística no melhoramento de plantas perenes. Brasília, DF: Embrapa Informação Tecnológica, 2002. 975 p.
RESENDE, M. D. V. Matemática e Estatística na análise de experimentos e no melhoramento genético. Colombo, PR: Embrapa Florestas, 2007a. 362 p.
RESENDE, M. D. V. Novas abordagens estatísticas na análise de experimentos de campo. Colombo, PR: Embrapa Floresta, 2004. 60 p.
RESENDE, M. D. V. Software SELEGEN-REML/ BLUP: sistema estatístico e seleção genética computadorizada via modelos lineares mistos. Colombo, PR: Embrapa Florestas, 2007b. 359 p.
Rev. Caatinga
SANTOS, C. A. F. et al. Comportamento agronômico e qualidade culinária de feijão-caupi no Vale do São Francisco. Horticultura Brasileira, Brasília, v. 26, n. 3, p. 404-408, 2008.
TEODORO. P. E. et al. Perspectiva bayesiana na seleção de genótipos de feijão-caupi em ensaios de valor de cultivo e uso. Pesquisa Agropecuária Brasileira, Brasília, v. 50, n. 10, p. 878-885, 2015a. TEODORO. P. E. et al. Redes neurais artificiais para identificar genótipos de feijão-caupi semiprostrado com alta adaptabilidade e estabilidade fenotípicas. Pesquisa Agropecuária Brasileira, Brasília, v. 50, n. 11, p. 1054-1060, 2015b.
TORRES, F. E. et al. Interação genótipo x ambiente em genótipos de feijão-caupi semiprostrado via modelos mistos. Bragantia, Campinas, v. 74, n. 3, p. 255-260, 2015.
TORRES F. E. et al. Simultaneous selection for cowpea (Vigna unguiculata L.) genotypes with adaptability and yield stability using mixed models. Genetics and Molecular Research, Ribeirão Preto, v. 15, n. 2, p. 1-11, 2016.