* Corresponding author: E-mail: [email protected] Received: December 18, 2015 Approved: April 12, 2016
How to cite: Carvalho PSM, Franco LB, Silva SA, Sodré GA, Queiroz DM, Lima JSS. Cacao Crop Management Zones Determination Based on Soil Properties and Crop Yield. Rev Bras Cienc Solo. 2016;40:e0150520.
Copyright: This is an open-access article distributed under the terms of the Creative Commons Attribution License, which permits unrestricted use, distribution, and reproduction in any medium, provided that the original author and source are credited.
Cacao Crop Management Zones
Determination Based on Soil
Properties and Crop Yield
Perla Silva Matos de Carvalho(1)
, Laís Barreto Franco(1)
, Samuel de Assis Silva(2)* , George Andrade Sodré(3)
, Daniel Marçal de Queiroz(4)
and Julião Soares de Souza Lima(2) (1)
Universidade Estadual de Santa Cruz, Departamento de Ciências Agrárias e Ambientais, Campus Soane Nazaré de Andrade, Ilhéus, Bahia, Brasil.
(2)
Universidade Federal do Espírito Santo, Departamento de Engenharia Rural, Alegre, Espírito Santo, Brasil. (3)
Centro de Pesquisas do Cacau, Comissão Executiva do Plano da Lavoura Cacaueira, Ilhéus, Bahia, Brasil. (4)
Universidade Federal de Viçosa, Departamento de Engenharia Agrícola, Campus Viçosa, Viçosa, Minas Gerais, Brasil.
ABSTRACT: The use of management zones has ensured yield success for numerous agricultural crops. In spite of this potential, studies applying precision agricultural techniques to cacao plantations are scarce or almost nonexistent. The aim of the present study was to delineate management zones for cacao crop, create maps combining soil
physical properties and cacao tree yield, and identify what combinations best fit within
the soil chemical properties. The study was conducted in 2014 on a cacao plantation in a Nitossolo Háplico Eutrófico (Rhodic Paleudult) in Bahia, Brazil. Soil samples were collected in a regular sampling grid with 120 sampling points in the 0.00-0.20 m soil layer, and pH(H2O), P, K+, Ca2+, Mg2+, Na+, H+Al, Fe, Zn, Cu, Mn, SB, V, TOC, effective CEC, CEC at pH 7.0, coarse sand, fine sand, clay, and silt were determined. Yield was measured in all the 120 points every month and stratified into annual, harvest, and early-harvest
cacao yields. Data were subjected to geostatistical analysis, followed by ordinary kriging
interpolation. The management zones were defined through a Fuzzy K-Means algorithm
for combinations between soil physical properties and cacao tree yield. Concordance analysis was carried out between the delineated zones and soil chemical properties
using Kappa coefficients. The zones that best classified the soil chemical properties were defined from the early-harvest cacao yield map associated with the clay or sand fractions. Silt content proved to be an inadequate variable for defining management
zones for cacao production. The delineated management zones described the spatial
variability of the soil chemical properties, and are therefore important for site-specific
management in the cacao crop.
INTRODUCTION
In recent years, cacao (Theobroma cacao) plantations located in the south of the state of Bahia have faced a serious yield crisis, largely due to the appearance and dissemination of witches’ broom disease (Souza Jr. et al., 2011), which is caused by the Moniliophthora perniciosa fungus. The disease has reduced dry pod production in the region by 60 % (Sodré et al., 2007).
The impact of witches’ broom disease has been partially overcome through the use of clonal and seminal cacao varieties, leading to an expected gradual recovery of cacao production in Brazil (Arévalo et al., 2012). Nevertheless, Chepote et al. (2013) state that
the sustainability of cacao cultivation will only be attained through specific production
systems including the use of soil amendment and fertilizers.
Soils typically exhibit large variations in physicochemical properties over the whole of
the production field, so fertilization practices based only on average values lead to errors
that may jeopardize the entire management system (Silva et al., 2010). Determining
spatial variability, on the other hand, allows different sites to be identified within the same field that exhibit homogeneous features related to chemical and physical properties of soil and crop yield, and this will further enable the adoption of specific management
strategies (Davatgar et al., 2012).
In precision agriculture, the use of agronomic practices such as fertilization, weed control, and pest and disease control is performed in a spatially variable manner depending on
information collected in the field (Ortega and Santibáñez, 2007). However, the right
application rate of agricultural inputs in terms of space and time using precision agriculture has proven to be a challenge (Booltink et al., 2001; Anselin et al., 2004).
An alternative for resolving this problem is the formation of specific management zones
based on characteristics and variables that are essential for certain production patterns of
agricultural crops (Fraisse et al., 2001). In the case of cacao cultivation, defining management
zones could be a key factor for improving management practices, and thus, for regaining large
yield indexes. The division of production fields into sub-regions including a combination of yield-limiting and quality factors allows specific and independent strategies to be implemented for each sub-region, thereby improving the efficiency of cacao crop management.
Several studies have been conducted for the purpose of defining management zones for different agricultural crops (Fraisse et al., 2001; Whelan and McBratney, 2001; Li et al., 2007; Valente et al., 2012). The main variables used and the benefits of localized
management practices for production systems have been highlighted in these studies. However, there are no studies on the use of precision agriculture techniques for a production management system for cacao crop.
This study investigated the possibility of using management zones in cocoa plantation and the possibility of using the same variables applied in other crops to generate this zones. The aim of the present study was to delineate management zones and create maps of combinations between soil physical properties and cacao yield. The combinations
that best fit the chemical properties of the soils were also identified.
MATERIALS AND METHODS
Description of experimental area
This study was conducted in an experimental area of approximately 1 ha belonging to the Cacao Research Center (Centro de Pesquisas do Cacau - CEPEC). The area is located at km 22 of the Jorge Amado highway in the municipality of Ilhéus in the south of the
Climate in the region is classified as Af, humid tropical climate (Köppen and Geiger, 1928),
with average annual rainfall of 1,830 mm, relative humidity of 80 %, and average annual temperature between 21.5 and 25.5 °C. The experimental area contained 31 cacao
progenies planted at a spacing of 3.0 × 1.5 m. The soil was classified as a Nitossolo
Háplico Eutrófico (Rhodic Paleudult), according to the Brazilian System of Soil Classification
(Santos et al., 2013).
The experimental area has been cultivated since 2003 with a regular cacao cultivar in an agroforestry system using erythrina at a spacing of 24 × 24 m. Shading of the area is regular, except in the northwest and central regions, where there is a higher incidence of sunlight due to lower density of plant cover.
Sampling methodology
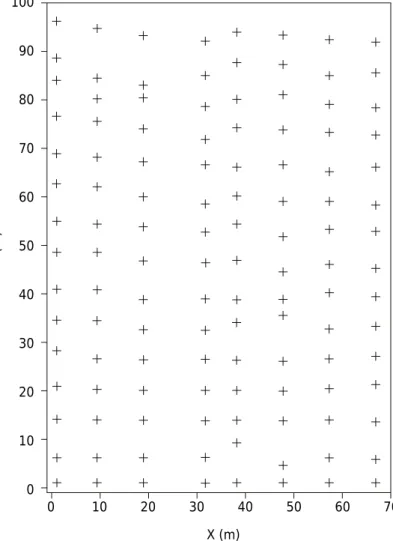
A regular sampling grid composed of 120 points was delineated with adoption of a local coordinate system with minimum and maximum spacing between points of 6.6 m and 9.5 m, respectively (Figure 1). Each sampling point was composed of a single cacao tree.
Soil collection was performed at each sampling point under the projection of the cacao tree canopy at a distance of 0.40 m from the trunk. Soil was collected from 0.0-0.20 m depth layers with the aid of a Dutch auger. Four subsamples (1 subsample per quadrant) were used to make up composite samples. The soil of each composite sample was
processed to obtain air-dried fine earth (ARFE).
Physical and chemical analyses
Particle size analysis was performed on soil samples to quantify the coarse sand, fine
sand, total sand, clay, and silt fractions. In addition, chemical analyses were performed to determine the properties: P, K+
, Ca2+ , Mg2+
, Na+
, Fe, Cu, Mn, Zn, Al3+
, pH in water, potential acidity (H+Al), and total organic carbon (TOC). The sum of exchangeable bases
(SB), effective cation exchange capacity (effective CEC), cation exchange capacity at pH
7.0 (CEC pH 7.0), base saturation index (V), and Al3+
saturation index (m) were calculated. Both chemical and physical analyses were performed following the methods proposed by Donagema et al. (2011).
Determination of cacao yield
The yield of cacao trees was determined monthly throughout the year of 2014. The yield
was stratified into early-harvest cacao (March to August), harvest cacao (September
to February), and annual production (production in all months). Production of healthy fruits was evaluated per sampling point by determining the weight of dry pods per plant. The results of dry pod production per plant were extrapolated to yield (kg ha-1
) per sampling point.
Data analysis
Geostatistical analysis was performed on data to identify and quantify the degree of spatial dependence of the physical properties of soil and cacao yield (harvest, early-harvest, and
annual). This analysis is the first step in delineating management zones and was carried
out in order to adjust the theoretical functions of Matheron’s experimental variogram, given in equation 1:
γ(h) = 1
2N(h) [z(xi) – z(xi + h)] 2
N(h)
i = 1
Σ
Eq. 1Experimental semivariance was calculated assuming isotropic behavior of spatial
dependence. In fitting theoretical functions to variograms, the following experimental
models were tested: linear with plateau, spherical, Gaussian, and exponential. The model
that best fit the experimental data was selected by analyzing the smallest residual sum of squares (RSS) and the highest coefficient of determination (R²). The cross validation coefficient (R²-VC) was also considered. Geostatistical analyses were performed on Vesper
1.62 software (Minasny et al., 2006).
Delineation of management zones
The management zones were defined from values interpolated by ordinary kriging and
according to a regular grid by applying the Fuzzy K-Means algorithm. This method is based on the minimization of equation 2, in accord with Guastaferro et al. (2010).
J = xi
(j) – cj
2
n
i – 1
Σ
kj – 1
Σ
Eq. 2where xi
(j) – cj
2
is the distance between the data point and the center of the cluster; n is the number of data; and k is the number of clusters.
The optimal class number was determined based on two indexes (Guastaferro et al., 2010):
the Fuzzy Performance Index – FPI, and Normalized Classification Entropy – NCE. The FPI
and NCE indexes vary from 0 to 1. Values close to 0 (zero) indicate distinct classes, with few samples that have low adhesion (Equation 3), and values close to 1 (one) indicate
Figure 1. Distribution of sampling points in the experimental area. 100
90
80
70
60
50
40
30
20
10
0
Y (m)
X (m)
no distinct classes, with a high number of samples that have low adhesion (Equation 4). Accordingly, the optimal number of classes is the number that minimizes both indexes.
MFB
(z) = 0 z ≤ b1 ou z > b2 Eq. 3
MFB(z) = 1 b1 ≤ z ≤ b2 Eq. 4
where MFB
is a pertinence function that assumes the value 0 or 1; z is an individual that may or may not be a member of a group; and b1 and b2 are the settled limits.
The maps of management zones were created using 20 different combinations
between soil physical properties and cacao tree yield (harvest, early-harvest, and annual): Total sand, Clay, Silt, Total sand + Clay, Total sand + Silt, Clay + Silt, Total Sand + Clay + Silt, Harvest, Harvest + Total sand, Harvest + Clay, Harvest + Silt, Early-harvest, Early-harvest + Total Sand, Early-harvest + Clay, Early-harvest + Silt, Early-harvest + Harvest, Early-harvest + Harvest + Total Sand, Early-harvest + Harvest + Clay Early-harvest + Harvest + Silt, Early-harvest + Harvest + Total Sand + Clay
+ Silt. The classification for generating management zones was carried out with two, three, and five classes. Soil physical properties were used due to their low temporal
variability, which allowed management zones with higher repeatability over the years to be obtained. Yield was used as the main response of an agricultural crop in regard to management, especially because it represents the central purpose of agriculture.
The best management zone was defined by evaluating the correlation levels between the zones and the classificatory variables, the soil chemical properties in this case.
Kappa indexes were calculated in accordance with Kitchen et al. (2005). According
to these authors, the Kappa coefficient indicates acceptance among classifications;
the larger the Kappa index, the higher the correlation between the zone and the
classificatory variables.
According to the methodology proposed by Congalton and Mead (1986) and used by Valente et al. (2012) and Alves et al. (2013), the following intervals were considered:
Kappa <0, the correlation is poor and not significant (D); 0 ≤ Kappa <0.20, the correlation is significant but poor (C); 0.20 ≤ kappa ≤ 0.40, significant but reasonable correlation (B); and Kappa > 0.40, significant and good correlation (A),
The management zones that did not minimize the FPI and NCE indexes in the same class
were evaluated with different input variables to determine the most important class (Fridgen et al., 2004). The criterion used to define the best class was in accord with the
method adopted by Alves et al. (2013).
RESULTS AND DISCUSSION
In geostatistical analysis (Figure 2), all size fractions, and harvest and early-harvest cacao
yield showed spatial dependence. The theoretical models that best fit the experimental
variograms were the spherical and Gaussian models. The spherical model is considered
to be the most frequent well-fitted model for soil and plant data (Dalchiavon et al., 2012;
Lima et al., 2013).
The fit of the pure nugget effect model (PNE) indicates that the annual cacao yield did
not exhibit spatial dependence among samples. The absence of spatial dependence does not signify lack of variability in the phenomenon. However, this variability is not related to space, but occurs randomly (Lima et al., 2013). According to these authors,
the properties well-fitted to the PNE model should be used as based on average values
The highest spatial variability was observed for cacao yield, with ranges of 12 and 12.5 m for harvest and early-harvest yields, respectively. Large genetic and, consequently, high yield variabilities were expected since the cacao plantation was formed by progenies.
Among the size fractions, silt had the lowest range value (62 m). Souza et al. (2004) state that silt incorporates parts of variability from other size fractions during its determination process, which contributes to an increase in its variability.
Spatial dependence, as measured by the spatial dependence index (SDI), was significant
for total sand, clay, and early-harvest and harvest cacao yield, and moderate for silt, which is in accord with Cambardella et al. (1994). For these authors, a SDI that is powerful for physical properties is related to intrinsic factors of the soil, such as its formation and mineralogy. Oliveira et al. (2013) found moderate SDI values for clay and weak values for silt and sand in a Cambisol under an agroforestry system.
1.72
1.29
0.86
0.43
0.0
0.0 30.0 60.0 90.0
Total Sand
Gaussian C0 = 0.09
C0+C = 1.66
a = 78 m R2 = 98.6 % SDI = 94 % SQR = 5.19
1.84
1.38
0.92
0.46
0.0
0.0 3.5 70.0 105.0
Clay
Spherical C0 = 0.12
C0+C = 1.67
a = 100 m R2 = 96 %
SDI = 93 % SQR = 2.58
Semivarianc e 1.46 1.09 0.73 0.36 0.0
0.0 30.0 60.0 90.0
Silt
Spherical C0 = 0.40
C0+C = 1.21
a = 62 m R2 = 89 %
SDI = 67 % SQR = 2.34
1.13
0.85
0.57
0.28
0.0
0.0 25.0 50.0 75.0
Early-Harvesty
Gaussian C0 = 0.29
C0+C = 1.11
a = 12.5 m R2 = 82 % SDI = 74 % SQR = 1.88
Distance (m) 1.13 0.85 0.56 0.26 0.0
0.0 15.0 30.0 45.0
Harvesty
Spherical C0 = 0.20
C0+C = 1.06
a = 12 m R2 = 94 % SDI = 81 % SQR = 2.82
1.13
0.85
0.57
0.28
0.0
0.0 3.5 70.0 105.0
Annual Harvesty
Nugget Effect
Figure 2. Models and parameters of variograms for the soil physical properties and for the cacao yield. C0: nugget effect; C0+C: sill; a: range (m); R
2
Eight zone combinations minimized the indexes with two classes (Total Sand, Clay, Silt, Total Sand + Clay, Total Sand + Silt, Clay + Silt, Total Sand + Clay + Silt and Early-harvest + Harvest + Total Sand + Clay + Silt), eight with three classes (Harvest, Harvest + Total Sand, Harvest + Clay, Harvest + Silt, Early-harvest + Total Sand, Early-harvest + Clay, Early-harvest + Silt, and Early-harvest + Harvest), and three with four classes (Early-harvest + Harvest + Total Sand, Early-harvest + Harvest _ Clay, and Early-harvest + Harvest + Silt)
(Table 1). Only the zone defined for the early-harvest cacao yield (T) minimized the indexes with a different number of classes (FPI - 2 classes and NCE - 5 classes). Fridgen
et al. (2004) recommend additional analysis for the cases in which the indexes do not
match a single number of classes, evaluating the correlation among different zones with classificatory variables.
When management zones are defined from a single variable, the FPI and NCE indexes
tend to be minimized in two classes, as can be observed for Total Sand, Clay, Silt, and T. These results corroborate those previously reported by Peralta et al. (2015),
where the highest relative efficiency for zones defined from individual variables
was obtained for two classes. For combinations involving more than one variable,
combinations were fitted with two, three, and four classes; Valente et al. (2012)
observed minimized FPI and NCE indexes in three classes for management zones of
coffee crop defined as based on variable combinations. Similar results were observed
by Morari et al. (2009).
Taking into account that the highest combination number (16) had minimum FPI and NCE indexes for two and three classes, these are the most recommended combinations to delineate management zones for the cacao crop. Peralta et al. (2015) state that
a lower number of classes in the definition of zones makes application of localized
management practices more economically viable, mainly due to greater simplicity in
subdividing the production field. Four was the best number of classes for delineating fertility management zones in a rice field found by Davatgar et al. (2012). Bazzi et al. (2013) observed that more than three classes is effective for fertility management
of an area planted to soybean.
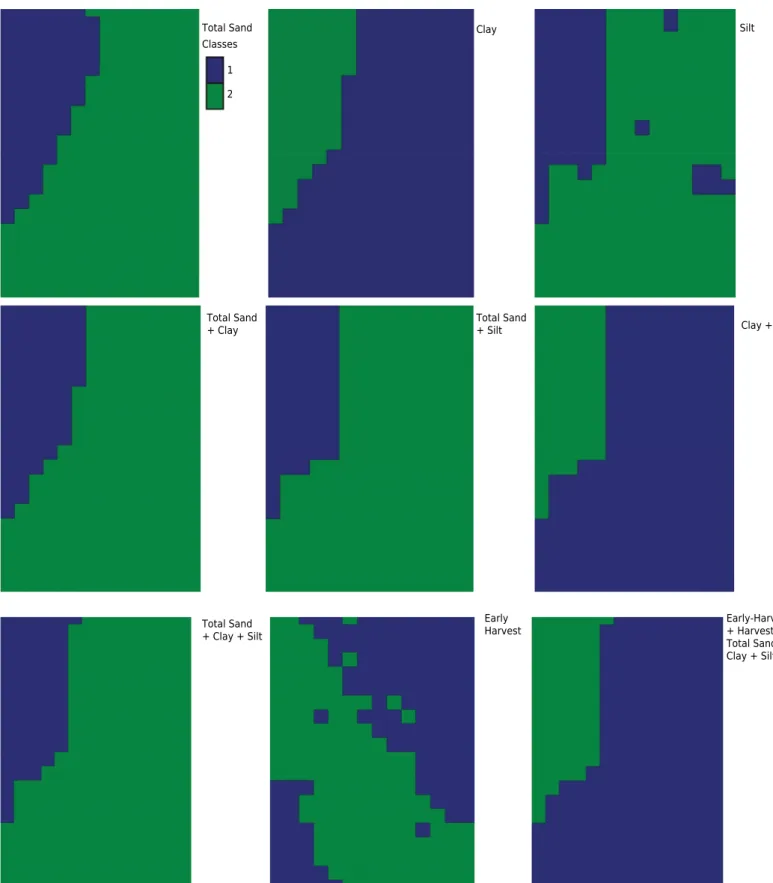
From the selection of an optimal number of classes for each combination of variables, management zone maps for the cacao crop were created (Figures 3, 4, and 5). The average centroid values and respective standard errors of the combinations of variables in each management zone are summarized in tables 2 to 4. These tables have the purpose of supporting interpretation of the maps.
The maps of management zones defined for individual variables were similar to the original
spatial variability maps, particularly for total sand and clay, in which the highest spatial distribution values were noticed in the upper-left and lower-right regions of the area, respectively. In these regions, there are the lowest total sand class Total Sand (class 1) and highest clay class (class 2), with values of 309.34 and 375.90 k kg-1
, respectively (Table 2). Pedroso et al. (2010) report that this similarity in behavior is characteristic of the Fuzzy K-Means algorithm, which is dependent on the quality of the spatial variability map of the original variable.
Except for the combinations Total Sand, Clay, Total Sand + Clay, Total Sand + Silt, Clay + Silt, Total Sand + Clay + Silt and Early-Harvest + Harvest + Total Sand + Clay+ Silt, the other
combinations, regardless of the number of zones defined, exhibited more disperse classes
The discontinuity of management zones increased along with an increasing number of classes. This behavior was expected since the variability among variables used in the
combinations and the stratification of clusters are also increased. Salami et al. (2011) report that management zones defined from variables comprising widely divergent spatial
distributions tend to produce higher discontinuities, even with a small number of classes.
Evaluating the contribution of the size fractions within the combinations, the behavior of Clay and Total Sand are similar up to three classes. Silt contributes to increase the discontinuity among zones and generates maps with discontinuous classes. This response is explained by the larger variation in this fraction, since its standard deviation was high for all classes (Tables 2 and 3).
Analyzing at figure 5, which shows the combination whose indices FPI and NCE were
minimum of four classes is observed similarity between the maps. Management zones divided into four classes, and that which comprises yield data (early-harvest and harvest)
can be defined in combination with any size fraction without significantly altering the final result, not only in regard to the spatial distribution of classes, but also the average
centroid values (Table 4).
The management zone maps were cross-tabulated with the maps of classificatory variables (Table 5), respecting the number of classes necessary to obtain an efficient
tabulation (Kitchen et al., 2005). This correlation analysis was performed for the purpose
of comparing the different input variables used to define management zones, and to identify the most important variable for delineating specific sites of fertility management
for cacao cultivation.
The management zones presented Kappa coefficient values ranging from poor to good. The Kappa coefficients were significant for most classificatory variables (Table 5). The Table 1. Fuzzy Performance Index (FPI) and Normalized Classification Entropy (NCE) indexes for each class of each management zone
Values in bold indicate minimization of the indexes for the management zones of classes.
Management zone FPI NCE
2 3 4 5 2 3 4 5
Total sand 0.2105 0.2894 0.2779 0.3111 0.2607 0.3154 0.2877 0.3034
Clay 0.1461 0.1800 0.2647 0.2776 0.1873 0.2091 0.2668 0.2625
Silt 0.1410 0.1555 0.2167 0.2630 0.1823 0.1833 0.2202 0.2495
Total sand + clay 0.1799 0.3002 0.3028 0.3205 0.2345 0.3285 0.3104 0.3141
Total sand + silt 0.1896 0.3980 0.3838 0.4446 0.2508 0.4170 0.3888 0.4305
Clay + silt 0.1577 0.3130 0.3736 0.3963 0.2095 0.3393 0.3742 0.3851
Total Sand + clay + silt 0.1787 0.3833 0.3915 0.4329 0.2375 0.4021 0.3923 0.4175
Harvest 0.2294 0.2171 0.2815 0.3286 0.2798 0.2450 0.2896 0.3096
Harvest + total sand 0.5170 0.4075 0.4654 0.4545 0.5929 0.4556 0.4852 0.4606
Harvest + clay 0.4469 0.3529 0.4081 0.4328 0.5241 0.3993 0.4277 0.4368
Harvest + silt 0.4261 0.3452 0.4022 0.4125 0.5044 0.3900 0.4201 0.4179
Early-harvest 0.2837 0.2954 0.3068 0.2915 0.3469 0.3317 0.3160 0.2882
Early-harvest + total sand 0.5401 0.4076 0.4758 0.4955 0.6119 0.4620 0.4996 0.5022
Early-harvest + clay 0.5564 0.3527 0.4163 0.4819 0.6225 0.4046 0.4394 0.4792
Early-harvest + silt 0.5803 0.3549 0.4095 0.4104 0.6496 0.4045 0.4316 0.4234
Early-harvest + harvest 0.5524 0.4743 0.5095 0.5225 0.6205 0.5204 0.5313 0.5287
zones for combinations between Early-harvest + Harvest + Total Sand, Early-harvest + Harvest + Clay and Early-harvest + Harvest + Silt were the only combinations that
showed significant correlation with all soil properties. However, the indexes of these
combinations were not considered good (> 0.40). This fact was only observed for the combinations between Total Sand, Early-harvest + Total Sand, Early-harvest + Clay, Early-harvest + Silt, Harvest + Total Sand and Harvest + Clay.
Figure 3. Management zones with two classes, defined by the mapping of spatial variability of Total Sand, Clay, Silt, Total Sand + Clay, Total Sand + Silt, Clay + Silt, Total Sand + Clay + Silt, Early-Harvest, Early-Harvest + Harvest + Total Sand + Clay + Silt.
Total Sand
1
2 Classes
Clay Silt
Total Sand
+ Silt Clay + Silt
Total Sand + Clay
Total Sand + Clay + Silt
Early Harvest
The properties calcium (Ca), total organic carbon (TOC), iron (Fe), and base saturation index
(V) were the only properties that had Kappa coefficients higher than 0.40. The Ca and Fe maps were the maps best classified by the zones (highest Kappa values), especially for Early-harvest
+ Total Sand, Early-harvest + Clay and Early-harvest + Silt. Sousa et al. (2007) report that calcium (Ca2+
) favors the development of the cacao tree root system, increasing resistance of
Figure 4. Management zones with three classes, defined by mapping the spatial variability of the combination of Harvest + Total Sand, Harvest + Clay, Harvest + Silt, Harvest, Early-Harvest + Total Sand, Early-Harvest + Clay, Early-Harvest + Silt and Early-Harvest + Harvest.
Harvest + Total Sand
1
2
3 Classes
Harvest + Clay
Harvest + Silt
Harvest Early-Harvest
+ Total Sand
Early-Harvest + Clay
Early-Harvest + Silt
the plants against water deficit and improving phosphorus uptake. Deficiency of Fe, for its part,
causes severe damage to cacao tree growth and, consequently, to yield (Chepote et al., 2013).
For P and K, the largest correlations were observed for Early-harvest + Harvest + Total Sand. To increase the representability of the zones, Valente et al. (2012) report that selection of the best zones should take the largest absolute Kappa values into account.
Management
zone Class
Early-harvest Harvest Total sand Clay Silt
Mean s(1) Mean s Mean s Mean s Mean s
kg ha-1
g ha-1 Early-harvest
+ harvest + total sand + clay + silt
1 2301.44 739.64 1464.58 753.90 481.02 4559 149.40 39.64 353.65 60.00
2 2712.22 381.04 1090.59 572.13 301.62 49.29 380.13 58.45 57.84 83.54 Early-harvest 1 1745.85 333.98
2 2950.20 360.40
Total sand 1 309.34 50.76
2 486.10 39.25
Clay 1 147.48 36.49
2 375.90 60.28
Silt 1 57.37 73.21
2 359.38 47.63
Total sand +
clay 1 303.40 47.39 374.23 61.39
2 483.84 41.44 146.94 35.71
Total sand +
silt 1 297.97 47.35 48.14 71.59
2 479.58 46.96 352.30 61.05
Clay + silt 1 151.20 42.28 352.30 61.05
2 385.04 55.19 48.14 71.59
Total sand +
clay + silt 1 297.11 45.73 385.53 54.13 49.46 74.51
2 479.82 46.47 151.06 41.90 351.93 61.92
Table 2. The centroids of the best management zones with their respective classes
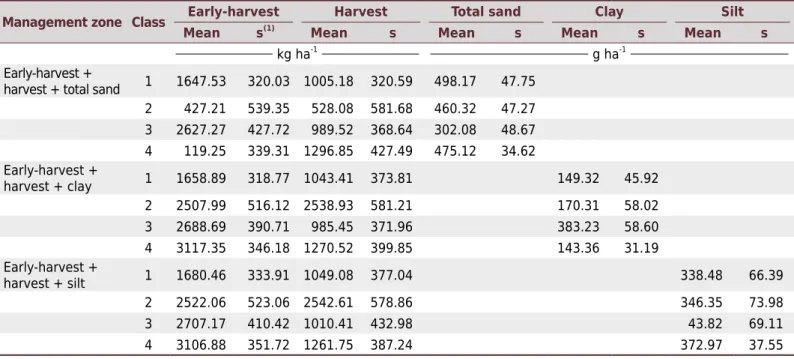
Figure 5. Management zones with four classes, defined by mapping the spatial variability of the combination of Early-Harvest + Harvest + Total Sand, Early-Harvest + Harvest + Clay and Early-Harvest + Harvest + Silt.
Early-Harvest + Harvest + Total Sand
Early-Harvest + Harvest + Clay
Early-Harvest + Harvest + Silt
1
2
3
Table 3. The centroids of the best management zones with their respective classes
Management
zone Class
Early-harvest Harvest Total sand Clay Silt
Mean s(1)
Mean s Mean s Mean s Mean s
kg ha-1
g ha-1
Harvest 1 941.85 242.92
2 2036.93 371.35
3 3863.23 781.06
Harvest + total sand 1 991.47 357.60 307.10 51.28
2 1028.60 291.80 493.16 42.09
3 2370.79 577.92 463.45 43.85
Harvest + clay 1 1005.14 370.17 381.92 58.84
2 1028.90 295.14 146.17 40.43
3 2391.98 570.66 163.87 52.81
Harvest + silt 1 990.04 431.77 49.38 70.07
2 1047.53 289.61 354.44 49.91
3 2387.28 573.24 355.36 66.94
Early-harvest +
total sand 1 1698.04 330.83 493.57 43.82
2 2640.38 412.68 305.96 49.05
3 3030.82 364.71 474.38 34.05
Early-harvest + clay 1 1698.36 321.93 148.61 42.02
2 2693.53 381.41 380.67 57.34
3 3012.99 373.66 149.97 35.79
Early-harvest + silt 1 2699.70 404.73 50.22 70.90
2 1709.71 332.22 340.91 65.70
3 3005.78 376.56 370.40 39.48
Early-harvest +
harvest 1 1686.71 320.05 1027.56 375.95
2 2620.59 541.36 2452.38 574.41 3 2950.13 378.95 1080.93 333.39 (1)
s: standard deviation.
Table 4. The centroids of the best management zones with their respective classes
(1)
s: standard deviation.
Management zone Class Early-harvest Harvest Total sand Clay Silt
Mean s(1)
Mean s Mean s Mean s Mean s
kg ha-1
g ha-1 Early-harvest +
harvest + total sand 1 1647.53 320.03 1005.18 320.59 498.17 47.75 2 427.21 539.35 528.08 581.68 460.32 47.27 3 2627.27 427.72 989.52 368.64 302.08 48.67 4 119.25 339.31 1296.85 427.49 475.12 34.62 Early-harvest +
harvest + clay 1 1658.89 318.77 1043.41 373.81 149.32 45.92
2 2507.99 516.12 2538.93 581.21 170.31 58.02
3 2688.69 390.71 985.45 371.96 383.23 58.60
4 3117.35 346.18 1270.52 399.85 143.36 31.19
Early-harvest +
harvest + silt 1 1680.46 333.91 1049.08 377.04 338.48 66.39
2 2522.06 523.06 2542.61 578.86 346.35 73.98
3 2707.17 410.42 1010.41 432.98 43.82 69.11
Carvalho et al.
Cacao Cr
op Management Zones Deter
mination Based on Soil P
roperties...
13
R
ev Bras Cienc Solo 2016;40:e0150520
Total sand 0.26 B -0.25 D 0.34 B -0.25 D 0.41 A 0.17 C 0.20 B -0.20 D 0.42 A 0.27 B 0.31 B 0.21 B 0.34 B 0.34 B 0.23 B 0.21 B Clay 0.22 B -0.24 D 0.31 B -0.24 D 0.38 B 0.17 C 0.22 B -0.21 D 0.38 B 0.25 B 0.35 B -0.33 D -0.32 D 0.31 B 0.20 B -0.32 D Silt 0.19 C -0.22 D 0.22 B -0.24 D 0.32 B 0.20 B 0.20 B -0.17 D 0.29 B 0.18 C 0.40 B -0.31 D 0.24 B 0.25 B -0.23 D -0.33 D Total sand +
clay 0.23 B -0.24 D 0.31 B -0.24 D 0.38 B 0.16 C 0.22 B -0.21 D 0.39 B 0.26 B 0.35 B -0.33 D 0.31 B 0.31 B 0.21 B -0.33 D Total Sand +
Silt 0.19 C -0.23 D 0.28 B -0.23 D 0.34 B 0.16 C 0.23 B -0.20 D 0.35 B 0.24 B 0.39 B -0.31 D 0.28 B 0.28 B -0.29 D -0.30 D Clay + silt 0.19 C -0.23 D 0.28 B -0.23 D 0.34 B 0.16 C 0.23 B -0.20 D 0.35 B 0.24 B 0.39 B -0.31 D 0.28 B 0.28 B -0.29 D -0.30 D Total sand +
clay + silt 0.19 C -0.23 D 0.28 B -0.23 D 0.34 B 0.17 C 0.24 B -0.20 D 0.35 B 0.22 B 0.39 B -0.31 D 0.28 B 0.28 B -0.29 D -0.30 D Harvest 0.15 C 0.12 D -0.16 D -0.06 D -0.05 D -0.07 D 0.17 C -0.11 D 0.22 B -0.21 D -0.18 D 0.19 C 0.17 C -0.13 D -0.12 D -0.06 D Harvest +
total sand 0.23 B 0.13 C 0.32 B 0.28 B 0.65A 0.13 C 0.20 B 0.28 B 0.29 B 0.29 B 0.43A 0.16 C 0.28 B 0.36 B 0.26 B 0.22 B Harvest +
clay 0.22 B 0.14 C 0.30 B -0.30 D 0.63A 0.14 C 0.22 B 0.27 B 0.28 B 0.29 B 0.46A 0.19 C 0.26 B 0.33 B 0.24 B 0.20 B Harvest + silt 0.24 B 0.15 C 0.26 B -0.28 D 0.61A 0.13 C 0.20 B 0.26 B 0.23 B 0.27 B 0.47A 0.19 C 0.24 B 0.31 B 0.20 B 0.19 C Early-harvest 0.14 C 0.01 D 0.30 B 0.22 B 0.35 B 0.14 C 0.18 C 0.23 B 0.30 B 0.21 B 0.16 C 0.25 B 0.30 B 0.43A 0.24 B 0.25 B Early-harvest
+ total sand 0.12 C 0.02 D 0.27 B -0.01 D 0.33 B 0.12 C 0.19 C 0.24 B 0.26 B 0.22 B 0.19 C 0.03 C 0.27 B 0.41A 0.20 B 0.22 B Early-harvest
+ clay 0.10 C 0.03 D 0.17 C 0.0 D 0.28 B 0.16 C 0.21 B 0.22 B 0.20 B 0.20 B 0.22 B 0.04 C 0.22 B 0.36 B 0.15 C 0.20 B Early-harvest
+ silt 0.17 C 0.18 C 0.14 C 0.29 B 0.30 B 0.08 D 0.19 C 0.07 D 0.24 B 0.13 C 0.26 B 0.27 B 0.05 C 0.16 C 0.07 D 0.04 D Early-harvest
+ harvest 0.24 B 0.22 B 0.39 B 0.32 B 0.38 B 0.10 C 0.11 C 0.21 B 0.32 B 0.39 B 0.32 B 0.33 B 0.35 B 0.34 B 0.28 B 0.22 B Early-harvest
+ Harvest + Total Sand
0.23 B 0.21 B 0.35 B 0.31 B 0.36 B 0.13 C 0.13 C 0.21 B 0.33 B 0.36 B 0.33 B 0.34 B 0.32 B 0.32 B 0.25 B 0.21 B
Early-harvest + harvest + clay
0.20 B 0.20 B 0.34 B 0.30 B 0.36 B 0.15 C 0.14 C 0.23 B 0.31 B 0.32 B 0.36 B 0.32 B 0.30 B 0.31 B 0.22 B 0.20 B
Early-harvest + harvest + silt
Soil pH(H2O), Ca 2+
/Mg2+
ratio, and TOC were the only chemical properties that showed
significant correlations with all combinations. According to Alves et al. (2013), organic matter and pH are best classified in terms of management zone. The base saturation
index (V) showed correlation with all combinations, except for Harvest Yield and Early-harvest + Harvest. Arévalo et al. (2012) report that cacao cultivation requires fertile soils and good availability of Ca2+
, Mg2+ , K+
, and Na+
, which are quantified by the
V index. Overall, base saturation is related to the availability of exchangeable bases,
which affect the exchange capacity on the surface of colloids, especially in the presence
of H+
and Al3+
ions (Raij, 2011).
As the management zone for early-harvest cacao (T) did not minimize the FPI and NCE indexes with the same number of classes, correlations with 2 and 5 classes were evaluated (Table 6), in accordance with Alves et al. (2013). The results obtained with the
Kappa coefficient indicate that the optimal number of classes for management zones of early-harvest cacao was 2 because of the higher number of well-classified properties.
Based on the findings of this study, it can be affirmed that the combinations Early-harvest + Total Sand, Early-harvest + Clay, Early-harvest + Harvest + Total Sand, Early-harvest + Harvest + Clay and Early-harvest + Harvest + Silt displayed the best performance for delineating management zones for cacao cultivation. As the highest
correlation values were identified for Early-harvest + Total Sand and Early-harvest + Clay, and no differences were observed among the maps created from these combinations,
the variables recommended to delineate management zones for cacao cultivation, in the area under investigation, were the early-harvest cacao yield and the total sand or total clay fractions.
The delineation of management zones using variable clusters leads to more satisfactory results (Kitchen et al., 2005); however, the best zones are those that make the procedure
for recommendation of soil amendment and fertilizers in specific sites more feasible
from technical, operational, and economic points of view. Morari et al. (2009) state that Table 6. Kappa Index of management zone and early-harvest cacao and chemical properties
A, B, C, and D: Kappa index good, fair, bad, and very bad, respectively, at 95 % significance. Equal letters in the same row and different columns indicate equality values between management zones.
Chemical property Management zone
Two classes Five classes
pH(H2O) 0.01 C 0.16 C
H+Al 0.15 C 0.14 C
P 0.20 B 0.13 C
K+
0.27 B 0.17 C
Ca2+
0.04 C 0.23 B
Mg2+
0.09 C 0.09 C
Ca2+ /Mg2+
0.01 C 0.13 C
SB 0.20 B 0.13 C
TOC 0.34 B 0.23 B
Na+
0.18 C 0.16 C
Fe 0.45 A 0.26 B
Zn 0.34 B 0.21 B
Cu 0.04 C 0.12 C
V 0.04 C 0.14 C
Effective CEC 0.02 C 0.09 C
the most economically viable management zones are those delineated with a smaller number of combinations and classes.
CONCLUSIONS
The methodology applied to delineate management zones for cacao cultivation was satisfactory, allowing the establishment of cluster patterns between soil properties and cacao yield.
The site-specific application of inputs in cacao cultivation must be performed in two or three specific management units that have different fertility levels.
For the cacao crop, the variables recommended to define management zones are
early-harvest cacao yield and the total sand or total clay fractions.
ACKNOWLEDGMENTS
The authors gratefully acknowledge the National Council for Scientific and Technological Development (Conselho Nacional de Desenvolvimento Científico e Tecnológico – CNPq) for financially supporting this research.
REFERENCES
Alves SMF, Alcântara GR, Reis EF, Queiroz DM, Valente DSM. Definição de zonas de manejo a partir de mapas de condutividade elétrica e matéria orgânica. Biosci J. 2013;29:1-11.
Anselin L, Bongiovanni R, Lowenberg-Deboer J. A spatial econometric approach to the economics of site-specific nitrogen management in corn production. Am J Agric Econ. 2004; 86:675-87. doi:10.1111/j.0002-9092.2004.00610.x
Arévalo E, Ram A, Valle RR. Integração de práticas de manejo no cultivo de cacau. In: Valle RR, editor. Ciência, tecnologia e manejo do cacaueiro. Itabuna: Vital; 2012. p.324-70.
Bazzi CL, Souza EG, Uribe-Opazo MA, Nóbrega LHP, Rocha DM. Management zones definition using soil chemical and physical attributes in a soybean area. Eng Agríc 2013;34:952-64. doi:10.1590/S0100-69162013000500007
Booltink HWG, Alphen BJ, Batchelor WD, Paz JO, Stoorvogel JJ, Vargas R. Tools for optimizing management of spatially-variable fields. Agric Syst. 2001;70:445-76. doi:10.1016/S0308-521X(01)00055-5
Cambardella CA, Moorman TB, Novak JM, Parkin TB, Karlen DL, Turco RF, Konopka AE.
Field-scale variability of soil properties in Central Iowa soils. Soil Sci Soc Am J. 1994;58:1501-11. doi:10.2136/sssaj1994.03615995005800050033x
Chepote RE, Sodré GA, Reis EL, Pacheco RG, Marrocos PCL, Valle RR. Recomendações de corretivos e fertilizantes na cultura do cacaueiro no sul da Bahia. Ilhéus: CEPLAC/CEPEC; 2013. (Boletim técnico, 203).
Congalton RG, Mead RA. A review of discrete multivariate analysis techniques used in assessing the accuracy of remotely sensed data from error matrices. IEEE T Geosci Remote. 1986;24:169-74. doi:10.1109/TGRS.1986.289546
Dalchiavon FC, Carvalho MP, Andreotti M, Montanari R. Variabilidade espacial de atributos da fertilidade de um Latossolo Vermelho Distrófico sob sistema de plantio direto. Rev Cienc Agron. 2012;43:453-61.
Davatgar N, Neishabouri MR, Sepaskhah AR. Delineation of site specific nutrient management zones for a paddy cultivated area based on soil fertility using fuzzy clustering. Geoderma. 2012;174:111-8. doi:10.1016/j.geoderma.2011.12.005
Fraisse CW, Sudduth KA, Kitchen NR. Delineation of site-specific management zones by
unsupervised classification of topographic attributes and soil electrical conductivity. Trans ASAE. 2001;44:155-66. doi:10.13031/2013.2296
Fridgen JJ, Kitchen NR, Sudduth KA, Drummond ST, Wiebold WJ, Fraisse CW. Management Zone Analyst (MZA): software for subfield management zone delineation. Agron J. 2004;96:100-8. doi:10.2134/agronj2004.0100
Guastaferro F, Castrignano A, Benedetto D, Sollitto D, Troccoli A, Cafarelli B. A comparison of different algorithms for the delineation of management zones. Precis Agric. 2010;11:600-20. doi:10.1007/s11119-010-9183-4
Kitchen NR, Sudduth KA, Myers DB, Drummond ST, Hong SY. Delineating productivity zones on claypan soil fields using apparent soil electrical conductivity. Comput Electron Agric. 2005;46:285-308. doi:10.1016/j.compag.2004.11.012
Köppen W, Geiger R. Die Klimate der Erde. Gotha: Verlag Justus Perthes; 1928. (Wall-map 150 cm × 200 cm).
Li Y, Shi Z, Li F. Delineation of site-specific management zones based on temporal and spatial variability of soil electrical conductivity. Pedosphere. 2007;17:156-64. doi:10.1016/S1002-0160(07)60021-6
Lima JSS, Silva AS, Silva JM. Variabilidade espacial de atributos químicos de um Latossolo Vermelho-Amarelo cultivado em plantio direto. Rev Cienc Agron. 2013;44:16-23.
Minasny B, McBratney AB, Whelan BM. VESPER version 1.62. Australian Centre for Precision Agriculture. Sydney: McMillan Building A05, The University of Sydney; 2006.
Morari F, Castrignanò A, Pagliarin C. Application of multivariate geostatistics in delineating management zones within a gravelly vineyard using geo-electrical sensors. Comput Electron Agric. 2009;68:97-107. doi:10.1016/j.compag.2009.05.003
Oliveira DP, Ferreira TO, Romero RE, Farias PRS, Costa MCG. Microrrelevo e a distribuição de frações granulométricas em Cambissolos de origem calcária. Rev Cienc Agron. 2013;44:676-84. doi:10.1590/S1806-66902013000400003
Ortega RA, Santibáñez OA. Determination of management zones in corn (Zea mays L.) based on soil fertility. Comput Electron Agric. 2007;58:49-59. doi:10.1016/j.compag.2006.12.011
Pedroso M, Taylor J, Tisseyre B, Charnomordic B, Guillaume S. A segmentation algorithm for the delineation of agricultural management zones. Comput Electron Agric. 2010;70:199-208. doi:10.1016/j.compag.2009.10.007
Peralta NR, Costa JL, Balzarinia M, Franco MC, Córdoba M, Bullocke D. Delineation of management zones to improve nitrogen management of wheat. Comput Electron Agric. 2015;110:103-13. doi:10.1016/j.compag.2014.10.017
Raij Bvan. Fertilidade do solo e manejo de nutrientes. Piracicaba: IPNI; 2011.
Salami BT, Okogun JA, Sanginga N. Delineation of management zones by classification of soil physico-chemical properties in the Northern Savanna of Nigeria. Afr J Agric Res. 2011;6:1572-9. doi:10.5897/AJAR10.573
Santos HG, Almeida JA, Oliveira JB, Lumbreras JF, Anjos LHC, Coelho MR, Jacomine PKT, Cunha TJF, Oliveira VA. Sistema brasileiro de classificação de solos. 3a ed. Rio de Janeiro: Embrapa Solos; 2013.
Silva SA, Lima JSS, Souza GS, Oliveira RB, Xavier AC. Lógica fuzzy na avaliação da fertilidade do solo e produtividade do café conilon. Rev Cienc Agron. 2010; 41:9-17.
Sodré GA, Corá JE, Souza Júnior JO. Caracterização física de substratos à base de serragem e recipientes para crescimento de mudas de cacaueiro. Rev Bras Frutic. 2007;29:339-44. doi:10.1590/S0100-29452007000200029
Souza Jr JO, Carmello QAC, Sodré GA. Substrato e adubação fosfatada para a produção de mudas clonais de cacau. Rev Bras Cienc Solo. 2011;35:151-9. doi:10.1590/S0100-06832011000100014
Souza ZM, Marques Júnior J, Pereira GT, Moreira LF. Variabilidade espacial do pH, Ca, Mg e V% do solo em diferentes formas do relevo sob cultivo de cana-de-açúcar. Cienc Rural. 2004;34:1763-71. doi:10.1590/S0103-84782004000600015
Tisseyre B, Mcbratney AB. A technical opportunity index based on mathematical morphology for site-specific management: an application to viticulture. Precis Agric. 2008;9:101-13. doi:10.1007/s11119-008-9053-5
Valente SDM, Queiroz DM, Pinto FAC, Santos NT, Santos FL. Definition of management zones in coffee production fields based on apparent soil electrical conductivity. Sci Agric. 2012;69:173-9. doi:10.1590/S0103-90162012000300001