Engineering
ISSN: 1809-4430 (on-line)
_________________________
2 Universidade Estadual Paulista (UNESP), Faculdade de Ciências Agrárias e Veterinárias/ Jaboticabal - SP, Brasil. 3 Universidade Federal de Viçosa/ Viçosa - MG, Brasil.
TIMES OF EFFICIENCY AND QUALITY OF SOYBEAN CROP MECHANICAL OPERATION IN GEOMETRY FUNCTIONS OF PLOTS
Doi:http://dx.doi.org/10.1590/1809-4430-Eng.Agric.v37n1p106-115/2017
CARLA S. S. PAIXÃO1*, ADÃO F. DOS SANTOS2, MURILO A. VOLTARELLI3,
ROUVERSON P. DA SILVA2, FRANCIELE M. CARNEIRO2
1*Corresponding author. Universidade Estadual Paulista (UNESP), Faculdade de Ciências Agrárias e Veterinárias/
Jaboticabal - SP, Brasil. E-mail: [email protected]
ABSTRACT: The knowledge of the operational quality of soybean harvester provides useful information to management in order to obtain the maximum performance of all available resources, with minimal expenses. The aimed of this study was to evaluate the quality of mechanized soybean harvesting operation in different formats of plots through statistical process control. Treatments were established from the formats of existing plots in the area (irregular, trapezoidal and rectangular). The activities carried out during the harvest were monitored (harvesting, unloading, handling, maneuvering and climate charts) and through these activities were made the calculation of capacity and harvesting operation efficiencies. In the determination of total losses were used 4 circular frames of 0.33 m² each, the grain losses were considered below and above these frames. The statistical analysis was by means of statistical process control opting for the use of the type CUSUM charts. The rectangular plot showed greater management efficiency and harvesting efficiency. The trapezoidal shape facilitated the maneuvers relative to others. The rectangular plot has better quality of operation in relation to others. The CUSUM control chart showed to be effective in preventing instability and maintenance of process quality.
KEYWORDS: grain harvester, CUSUM, machine performance, Glycine max (L.) Merrill.
INTRODUCTION
According to ASAE standard D497.6 (2009), time field efficiency or efficiency is defined as the ratio between the time effectively used and the total time available, when considering only the operations performed in cultivated field. This efficiency is related to the unused total working width of the machine, with the operator's habits, time and maneuvering characteristics of the area (ARALDI et al., 2013).
Considering that the shape of the blocks is of great importance for increasing time efficiency, the ideal plot shape is rectangular, being influenced by the width of the platform and the length and width of the blocks (WHITNEY, 1988). Also according to the author an ideal situation, the maneuvering time would be the minimum possible, which maximize the efficiency of the operation level and the harvester remain most of the time removing the production area, however, in practice this ideal condition is difficult to occur.
Among the factors that affect the operational capacity of the combine harvest, the scroll speed is one of the crucial point, as they increase or decrease the speed of harvest, influences the permissible capacity of the combine to process the mass harvested, so this decision should also take into account the acceptable loss levels for each region or production unit to meet its quality standards (CUNHA & ZANDBERGEN, 2007; MAGALHÃES et al., 2007).
Some authors have made the use of statistical process control, using quality indicators for monitoring of mechanized agricultural operations. In these works, the tool typically used to identify non-random causes or special causes arising from instability of the process are the individual values of control charts (CHIODEROLI et al., 2012; COMPAGNON et al., 2012; CASSIA et al., 2013; SILVA et al., 2013; VOLTARELLI et al., 2013; ZERBATO et al., 2013; VOLTARELLI et al., 2014).
As alternatives control charts of individual values, there is the control chart of the cumulative sums (CUSUM) type V-mask, suitable for monitoring processes subject to small and persistent changes (FOLLADOR, 2012). This chart, the decision on the status of the process is based on the accumulated information of several previous samples, not only the last of them, it is possible to signal more quickly small misadjustment, and identify the time when there is a change (MONTGOMERY, 2009). We also emphasize that the CUSUM has a higher stringency in relation to the letters of individual values for detecting variations in the process and can also be applied to analysis of other statistical variables, beyond the middle such as range and standard deviation of subgroup (MUKHERJEE et al., 2013).
Assuming that the efficiency of time and losses of mechanized harvesting of soybean can reduce the quality of this process, the aim of this study was to evaluate the efficiency and quality of the operation of mechanized harvesting of soybeans due to the geometry of the plots, by controlling statistical process.
MATERIAL AND METHODS
The experiment was conducted in the municipality of Conceição das Alagoas - MG, in the dependences of the São Sebastião farm, located near the geodetic coordinates 19º47'40 "S and 48º08'54" W, with average altitude of 801 m, and the weather classified according to Köppen -Geiger as Aw. The soil of the experimental area was classified as eutrophic ultisol Red-yellow with medium texture (EMBRAPA, 2013).
It was evaluated in the same area, three plots of different shapes and characteristics (Table 1).
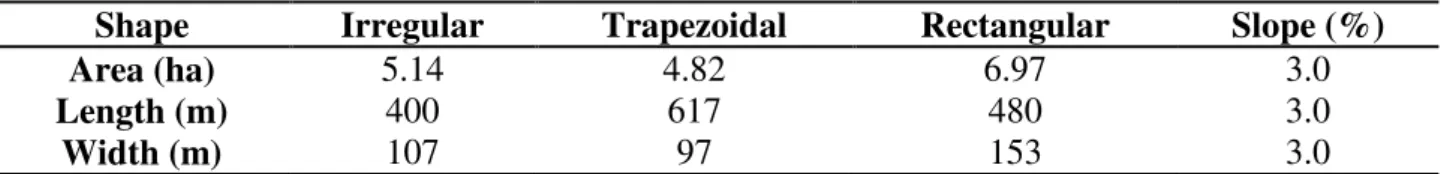
TABLE 1. Characteristics of the evaluated plots formats and their respective areas.
Shape Irregular Trapezoidal Rectangular Slope (%)
Area (ha) 5.14 4.82 6.97 3.0
Length (m) 400 617 480 3.0
Width (m) 107 97 153 3.0
All plots were sown with the cultivar BMX Turbo RR spacing of 0.50 m between rows and 22 seeds m-1. Harvest was done by a combine harvester, model MF 5650 Advanced, 2010 with approximately 700 hours of work, with nominal power of 130 kW (175 hp), equipped with cutting deck 5.00 m wide and track system tangential type. The areas were classified as mild relief, in which the harvest was carried out on the same day.
With the data, we calculated the variables related to the operation (time spent during the operation and the length / width of the field) and the efficiency of operation (field efficiency) as ASABE EP 496.3 (2009) standards and efficiency time and capabilities as MIALHE (1974).
The effective field capacity was calculated according to the methodology described by MIALHE (1974) [eq. (1)]:
(1)
On what,
Efc: Effective field capacity (ha h-1); A: area of the field (ha), and
Tho: harvesting operation time (h).
The operational field capacity was calculated according to the methodology described by MIALHE (1996) [eq. (2)]:
(2)
On what,
Ofc: operational Field capacity (ha h-1); Td: discharge time (h);
Ts: maintenance or stop time (h); Tm: maneuver time (h), and Tcs: climatic stop time (h).
To calculate the harvest efficiency (Eh), field efficiency (Ef) and management efficiency (Em) we used the methodology described by ASABE EP 496.3 (2009) standards according to eqs (3), (4) and (5):
(3) On what,
Eh (%): Harvest efficiency.
(4)
On what,
Ef (%) Field efficiency (%).
(5) On what,
The harvest time (Th) discharge time (Td) and maintenance or stop time (Ts) were calculated according to the methodology described by MIALHE (1996) according to eqs (6), (7) and (8), respectively.
(6)
(7)
(8)
For the calculation of maneuver time, we used the formula according to the methodology of ASABE EP 496.3 (2009), maneuver, [eq. (9)]:
(9)
Also, using the methodology described by MIALHE (1974) determined the ratio length/width (L / W) of each plot (equation 10).
(10)
On what,
L / W: ratio length / width of plots; L:Average lengths of each plots (m), and W:Average width of each plots (m).
Monitoring the combine harvester was accompanied from the beginning to the end of the operation; the total loss was quantified at regular intervals until the end of the harvest in each plot. It was used circular frames made with hoops of 0.33 m²,sealed with shading screen resembling with sieves, we use three hoops of the same size, which together had a total area of approximately 1.00 m². The hoops were launched soon after the passage of the harvester platform at predetermined points, so that two hoops were willing outside of the tracing of wheel sets of the harvester (left and right) and a third was launched between the rear axle (middle). We collected all the grains and pods present inside and below the hoops after the passage of the harvester.
The losses in mechanical harvesting of soybeans were defined as follows: the summation of the grains and pods found above and below the screen portraying as total losses. Eight samples were collected per plot every 20 minutes at random times throughout the harvest period, based on standards of Statistical Process Control (SPC). The characterization of the loss of water content was effected by means of a digital meter model G600, by collecting 10 samples in the morning and 10 in the afternoon, with a mean of 12.7% day for all formats plots evaluated.
The SPC tool used to monitor the loss was the control chart (CUSUM). This statistical method accumulates samples of the information mulling also a process that is; the samples have the same weight. The procedure is based on the successive collecting samples of size n, which is obtained statistics accumulated sum.
samples (n > 1) this statistic is the accumulated sum of the deviations from the sample mean with respect to the nominal value. In this sense, the control charts CUSUM kind V mask, proposed by BARNARD (1959) was drafted by eqs (11) and (12):
(11)
(12)
On what:
is the standardized observation .
The decision procedure is to place the V mask in the control chart the cumulative sum with the point 0 about the last value of and line 0P parallel to the horizontal. When all the previous cumulative sums, , ..., are located within the two arms of the mask, the process is under control. However, if any of the cumulative sums is located outside the mask's arms, the process is considered out of control. On actual use, the V mask should be applied to each new point on the CUSUM chart, when it is graphed, and it is assumed that the arms of the mask extend back toward of the source.
The performance of the V mask is determined by the distance d and the angle θ, the decision interval h and the slope (slope) k of the mask arms.
(13)
(14)
In these two equations, A is the horizontal distance in tracing of the V mask between successive points in terms of unit distance on the vertical scale.
Thus, the limit of losses (LE) was recommended by the production unit being evaluated in 60 kg ha-1 (EMBRAPA, 2002). Because of the calculation basis used in the CUSUM control chart, V mask model, is possible the occurrence of samples with negative values, however this situation is not considered bad, since all values in the case of this study, which are below the limit set as a goal (60 kg ha-1), they will be considered better results, as losses are below the maximum limit accepted by the production unit.
RESULTS AND DISCUSSION
Table 2 shows the results of operating performance quality indicators on mechanical harvest of soybeans. In trapezoidal plot, the effective field capacity (Efc) and the operating field capacity (Ofc) showed similar values, 1.55 and 1.42 ha h-1, respectively. This fact is related with the lowest total time spent (harvesting, maneuver, discharge, problem and climate stop) at the plot in this format over the other.
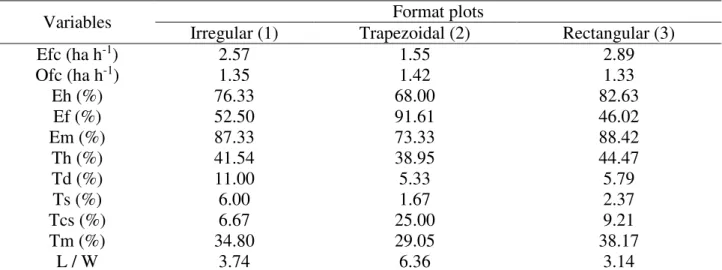
TABLE 2. Analysis of time, movement and efficiency of mechanical harvesting of soybeans in different plots.
Variables Irregular (1) Trapezoidal (2) Format plots Rectangular (3)
Efc (ha h-1) 2.57 1.55 2.89
Ofc (ha h-1) 1.35 1.42 1.33
Eh (%) 76.33 68.00 82.63
Ef (%) 52.50 91.61 46.02
Em (%) 87.33 73.33 88.42
Th (%) 41.54 38.95 44.47
Td (%) 11.00 5.33 5.79
Ts (%) 6.00 1.67 2.37
Tcs (%) 6.67 25.00 9.21
Tm (%) 34.80 29.05 38.17
L / W 3.74 6.36 3.14
Efc=effective field capacity; Ofc=operational field capacity; Eh= harvest efficiency; Ef= field efficiency; Em= management efficiency; Th= harvest time; Td= discharge time; Ts= maintenance or stop time; Tcs= Time climatic stop; Tm= maneuver time; L/W= length and width.
PITTA et al. (2014) reported that to carry out the monitoring of the efficiency of agricultural machinery in the field using the Controller Area Network (CAN) has enabled the management of operations, since times were collected through broadsides computers providing greater accuracy in analysis data. This result compared to the present study, based on the average technological level of the property, it is not useful for management and monitoring of the harvest, since the collection of information through chronometer and manual annotations obtains satisfactory results.
For field efficiency (Ef), which is the relationship between the two capacities (effective and operational), it is observed that plot 2 showed higher (91.61%), followed by plots 1 (52.60%) and 3 (46.02%). This situation can be explained by the proximity of Efc and Ofc values of the trapezoidal plot, making this next ratio of 100%. Note that for the other evaluated plots (irregular and rectangular) harvesting efficiency values were very near as well as their operational capacity values. The management efficiency (Em) suggests the impact of downtime on the harvesting operation, which can be seen the best result for plot 3 (88.42%) followed by plot 1 (87.33%) and plot 2 (73.33%). These results are due to mainly to climatic stop time (Tcs), whereas plot 2 (trapezoidal) even with the lowest results in other variables (Ts, Td and Tm), had climatic stop time (Tcs) very high (25%), making the Em lower than the other stands evaluated.
Watching the harvest time (Th), it was found in the rectangular plot the highest value compared to other plots; due to this plot format facilitate the logistics of mechanized soybean harvesting, providing longer shots for the operation.
When comparing the three plots in relation to the discharge time (Td) and the maintenance or stop time (Ts), noted that plot 1 showed the highest values 11 and 6% respectively. A possible explanation is the plot has an irregular shape, which made it difficult to access a bulk carrier tank to the machine for unloading of soybeans and several times the platform angle of attack was damaged; often causing accumulation of straw between the harvester mechanisms that is the "bushings".
ARALDI et al. (2013) studying the time efficiency in mechanical harvesting of rice in various conditions, using combined harvesters, reported an average time of discharge 10.8%, this value being near of found for this study in relation to irregular plot and higher than the other models of plots.
results can be explained by their high length / width (L / W = 6.36) which reduces the number of operations per area harvested and therefore the operational capacity of the combiner.
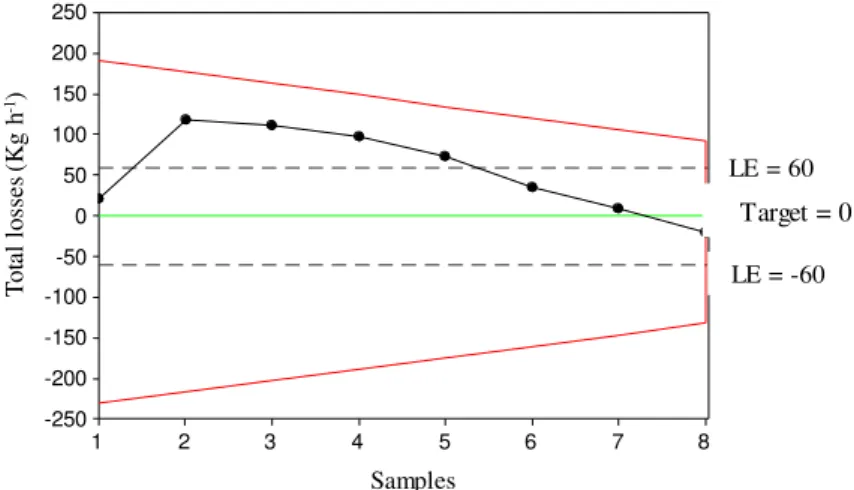
Based on statistical process control for total losses, irregular plot presented process stability throughout the evaluation period, with all points between the upper and lower lines of the V mask (Figure 1). 8 7 6 5 4 3 2 1 250 200 150 100 50 0 -50 -100 -150 -200 -250 Amostras P e rd a s t o ta is ( kg h a -¹ ) Meta=0 LE=60 LE=-60 T ot al l os se s (K g h -1) Samples
Goal = 0 LE = 60
LE = -60
Target = 0 Target = 0Target = 0
FIGURE 1. CUSUM control charts for total losses in the soybean mechanical harvesting in the irregular plot format.
It can be observed that only three points (sample 1, 7 and 8) possessed sample values near zero by means of cumulative sum, that is, smaller loss values. This presents a favorable condition for the mechanical harvesting process of soybean, due to the amount smaller of losses occurring at harvest compared to the limit set for the operation (LE = 60 kg ha-1). Moreover, 50% of the points which are above the established limit of losses represent larger amounts of losses, but showing process stability.
MACHADO et al. (2012) evaluated the losses in mechanical harvesting of soybean, reported that loss to be at an acceptable level, the harvester shall operate at a speed of 7 km h-1 associating the drawing machine rotation so as to minimize the total losses. These results can be considered opposites to the present study, since the average speed is 5 km h-1 which also confers losses within the limits set by the producing unit.
The use of CUSUM chart gives greater rigor to the analysis of the process because of its calculation base. Further LEIRAS et al. (2007) point out that when it comes to small samples is preferable to its choice instead of the letters of Shewhart. However, the interpretation of it has importance in order to elucidate the process in the best possible way to identify whether or not there was the occurrence of external factors influencing the quality of the operation.
According to GRAHAM et al. (2014) the use of CUSUM control charts of tabular type was effective for detection and rapid election of special causes acting in the course of a process and can be more accurate than letters of individual values because of their algorithm based calculation. This may be different from the results of this study, since the charts V mask type did no detect special cause, and this may be due to their lower stringency when compared to CUSUM tabular which does not point to an inefficiency of the monitoring process.
8 7 6 5 4 3 2 1 20 0 -20 -40 -60 -80 -100 -120 -140 -160 Amostras P er da s to ta is ( kg h a-¹) Meta=0 LE=-60 T ot al l os se s (K g h -1) Samples
Goal = 0
LE = -60
Target = 0Target = 0
FIGURE 2. CUSUM control charts for total losses in the soybean mechanical harvesting in the trapezoidal plot format.
On the other hand, when observing the behavior of the values of the cumulative sum along the harvesting process, there is a tendency of loss values decrease over time from the number of sample 3. This result can be effective in decision making for assiduous monitoring of the process, since the CUSUM control chart identifies small variations in the middle of a process, which are absorbed by other models of cards (CRUZ et al., 2014).
The total losses in mechanical harvesting of soybeans to the rectangular plot showed instability of the process because there is a point (sample 1) above the top line of the control V mask (Figure 3). However, this value of the cumulative sum may prove to be favorable harvesting since it has the least amount of losses, being set below the control limit.
8 7 6 5 4 3 2 1 50 0 -50 -100 -150 -200 -250 -300 -350 -400 Amostras P e rd a s t o ta is ( K g h a -¹ ) Meta=0 LE=-60 T ot al l os se s (K g h -1) Samples
Goal = 0
LE= -60
Target = 0
Target = 0
FIGURE 3. CUSUM control charts for total losses in the soybean mechanical harvesting in the rectangular plot format.
It is also observed that there are 87.5% of the sampling points within the limits of the V mask, a condition which portrays the losses in mechanical harvesting of soybean meeting the production unit quality standards, it is not necessary the adequacy of the process as a whole, so there is reduced variation of loss levels.
Furthermore, note that since the start of collection of the samples there was a trend of loss values decrease along harvesting process, the situation is beneficial to the operation, as reflected in increased level of its quality. This situation is similar to that described by MONTGOMERY (2009) which states that the reduction of variability is inversely proportional to increase the quality of operations or processes to be performed.
CONCLUSIONS
The trapezoidal shape of the plot showed better efficiency, less time spent on bedside maneuver, while the time spent on rectangular plot was larger on bedside maneuvers, management and harvest efficiencies.
The trapezoidal plot showed lower variability of total losses, with higher quality process. The total losses for the rectangular plot presented instability process, however the data is mostly below the limit.
The CUSUM control chart is suitable for monitoring the soybean harvest process, it acted as a management tool to avoid interference in the process quality, since it indicates faster small misadjustment, as well as accurately identifies the moment in which it occurs.
REFERENCES
ARALDI, F.P.; SCHLOSSER, F.J.; CARVALHO, A.F.; FRANTS, G.U.; RIBAS, L.R. Eficiência operacional na colheita mecanizada em lavouras de arroz irrigado. Ciência Rural, Santa Maria, v.43, n.3, p.445-451, 2013.
ASAE - American Society of Agricultural Engineers. ASAE EP 497.6 JUN09: Agricultural machinery management data. In: ASAE standards 2009: standards engineering practices data. St. Joseph, 2009. p.350-357.
BARNARD, G.A. Control charts and stochastic processes. Journal of the Royal Statistical Society,
v.21, n.2, p.239-271, 1959.
CASSIA, M. T.; SILVA, R. P.; CHIODEROLLI, C. A.; NORONHA, R. H. F.; SANTOS, E. P. Quality of mechanized coffee harvesting in circular planting system. Ciência Rural, Santa Maria, v.43, n.1, p.28-34, 2013.
CHIODEROLI, C.A.; SILVA, R.P.; NORONHA, R.H.F.; CASSIA, M.T.; SANTOS, E.P. Perdas de grãos e distribuição de palha na colheita mecanizada de soja. Bragantia, Campinas, v.71, n.1, p.112-121, 2012.
COMPAGNON, A.M.; SILVA, R.P.; CASSIA, M.T.; GRAAT, D.; VOLTARELLI, M.A. Comparação entre métodos de perdas na colheita mecanizada de soja. Scientia Agropecuaria, Trujillo, v.3, n.3, p.215-223, 2012.
CRUZ, D. V.; FILHO, M. C.; FALCÃO, A. P. S. T. Controle estatístico de processos aplicado ao monitoramento do ph e turbidez das águas no abastecimento de Campina Grande – PB. Revista
Brasileira de Biometria, São Paulo, v.32, n.4, p.459-477, 2014.
CUNHA, J.P.A.R.; ZANDBERGEN, H.P. Perdas na colheita mecanizada da soja na região do Triângulo Mineiro e Alto Paranaíba, Brasil. Biosciense Journal, Uberlândia, v.23, n.4, p.61-66, 2007. EMBRAPA – Empresa Brasileira de Pesquisa Agropecuária. Tecnologias de produção de soja: Paraná: 2003. Londrina: Embrapa Soja, 2002. 195p. (Sistemas de produção, 2).
EMBRAPA - Empresa Brasileira de Pesquisa Agropecuária. Sistema Brasileiro de Classificação de
Solos. 3. ed. Brasília, DF: Embrapa, 2013. 353 p.
GRAHAM, M. A.; CHAKRABORTI, S.; MUKHERJEE, A. Design and implementation of CUSUM exceedance control charts for unknown location. International Journal of Production Research,
London, v.52, n.8, p.5546–5564, 2014.
LEIRAS, A.; COSTA, A. F. B.; EPPRECHT, E. K. Planejamento do controle estatístico de processos com baixa fração não conforme restrito a amostras pequenas. Revista Produção, São Paulo, v.17, n.1, p.139-150, jan./abr. 2007.
MACHADO, T. A.; SANTOS, F. L.; CUNHA, J. P. B.; CUNHA, L. M.; COELHO, L. M. Perdas na plataforma de corte de uma colhedora combinada de grãos na colheita de soja. Engenharia na
Agricultura, Viçosa, MG, v.20, n.6, p.537-543, 2012.
MAGALHÃES, S.C.; OLIVEIRA, B.C.; TOLEDO, A.; TABILE, R.A; SILVA, R.P. Perdas quantitativas na colheita mecanizada de soja em diferentes condições operacionais de duas colhedoras.
Bioscience Journal, Uberlândia, v.25, n.5, p.43-48, 2009.
MIALHE, L. G. Manual de mecanização agrícola. São Paulo: Editora Agronômica Ceres, 1974. 301 p.
MIALHE, L. G. Máquinas agrícolas: ensaios e certificações. Piracicaba: CNPq-PADCT/TIB; FEALQ, 1996. p.600 – 650.
MONTGOMERY, D. C. Introdução ao controle estatístico da qualidade. 4. ed. Rio de Janeiro: LTC, 2009. p.100 – 200.
MUKHERJEE, A.; GRAHAM, M. A.; CHAKRABORTI, S. Distribution-free Exceedance CUSUM Control Charts for Location. Communications in Statistics – Simulation and Computation, New York, v.42, n.5, p.1153–1187, 2013.
PITLA, S. K.; LIN, N.; SHEARER, S. A.; LUCK, J. D. Use of controller area network (CAN) data to determine field efficiencies of agricultural machinery. Applied Engineering in Agriculture, St. Joseph, v.30, n.6, p.829-839, 2014.
SILVA, R. P.; CASSIA, M. T.; VOLTARELLI, M. A.; COMPAGNON, A. M.; FURLANI, C. E. A. Qualidade da colheita mecanizada de feijão (Phaseolus vulgaris) em dois sistemas de preparo do solo.
Ciência Agronômica, Fortaleza, v.44, n.1, p.61-69, 2013.
VOLTARELLI, M. A.; SILVA, R. P.; ROSALEN, D. L.; ZERBATO, C.; CASSIA, M. A. Quality of performance of the operation of sugarcane mechanized planting in day and night shifts. Australian
Journal Crop Science, Brisbane, v.7, n.9, p.1396-1406, 2013.
VOLTARELLI, M. A.; SILVA, R. P.; ZERBATO. C.; SILVA, V. F. A.; CAVICHIOLI, F. A. Agronomic capability of mechanized sugarcane planting. Australian Journal of Crop Science,
Lismore, v.8, n.10, p.1448 – 1460, 2014.
VOLTARELLI, M. A.; SILVA, R. P.; CASSIA, M. T.; ORTIZ, D. F.; T. L. S. Qualidade do corte basal de cana-de-açúcar utilizando-se de três modelos de facas. Engenharia Agrícola, Jaboticabal, v.35, n.6, p.528-541, 2015.
WALTER, O. M. F. C.; HENNING, E.; CARDOSO, M. E.; SAMOHYL, R. W. Aplicação individual e combinada dos gráficos de controle Shewhart e CUSUM: uma aplicação no setor metal mecânico.
Gestão e Produção, São Carlos, v.20, n.2, p.271-286, 2013.
WITNEY, B. Choosing and using farm machines. Essex: Longman Scientific and Technical, 1988. 412p.