Productivity of soybean in management zones with
application of different sowing densities
Produtividade da soja em zonas de manejo com a aplicação de diferentes densidades de semeadura
Rafaela Greici da Motta Camicia1,2* Marcio Furlan Maggi2 Eduardo Godoy de Souza2 Claudio Leones Bazzi3
Evandro André Konopatzki2 Gabriela Karoline Michelon4 José Bruno Santos Pinheiro2
ISSNe 1678-4596
INTRODUCTION
Precision agriculture (AP) aims accurate management of agricultural inputs to increase
profits, reduce losses, and preserve the environment
(BIER & SOUZA, 2017). This farming management concept recommends the use of local inputs according to local needs, spatial variability of production, and related factors. However, localized
application of precision farming involves the use of special equipment which may raise the initial investment in machinery to values that the small farmer may not be able to afford. An alternative is to divide the stands into areas of management (also known as management units or management zones, i.e. MZ), with the goal of allowing the use ofagricultural inputs at the constant rate, but still taking advantage of spatial variability.
1Departamento de Matemática e Estatística, Universidade Tecnológica Federal do Paraná (UTFPR), 85884-000, Medianeira, PR, Brasil. E-mail: [email protected]. *Corresponding author.
2Programa de Pós-graduação em Engenharia Agrícola (PGEAGRI), Sistemas Biológicos Agroindustriais, Universidade Estadual do Oeste do Paraná (UNIOESTE), Cascavel, PR, Brasil.
3Departamento de Ciência da Computação, Universidade Tecnológica Federal do Paraná (UTFPR), Medianeira, PR, Brasil.
4Programa de Pós-graduação em Tecnologias Computacionais para o Agronegócio (PPGTCA), Universidade Tecnológica Federal do Paraná (UTFPR), Medianeira, PR, Brasil.
ABSTRACT: The present study aimed to assess the efficiency of sowing at variable rates for soybean cultivation in two management zones
(MZs) which were defined based on stable attributes and correlated with productivity using the Fuzzy C-means clustering algorithm and the kriging interpolation.Seeding was carried out in the 2015/2016 and 2017/2018 crops with a variation of 20% of seeds and crop row spacing of 0.70m. In each MZ, 8 plots with higher and lower seed density were established. Productivity was measured using a harvest monitor connected to a harvester. Data were filtered and submitted to descriptive analysis. Productivity maps were generated using the inverse square distance interpolation for each seeding density. In the MZ with the highest productive potential (MZ 1), the productivity was 3.39 and 3.18t ha-1, and
in the MZ with the lowest productive potential (MZ 2) the productivity was 3.30 and 3.11t ha-1 for the years 2016 and 2018, respectively.
Interpolation estimated higher productivity with the application of 15 plants m-1. Based on the economic analysis, it is suggested in this study
the application of 214,000 plants ha-1 in both MZs.
Key words: precision agriculture, grain production, management zones.
RESUMO: O trabalho avaliou a eficiência da semeadura à taxa variada para cultura da soja em duas zonas de manejo (ZMs), as quais foram
definidas com base em atributos estáveis e correlacionados com a produtividade, por meio do algoritmo de agrupamento Fuzzy C-means e o interpolador krigagem. A semeadura foi realizada nas safras 2015/2016 e 2017/2018, com variação de 20% de sementes e espaçamento entre linhas de 0,70m. Em cada ZM foram estabelecidas 8 parcelas em que variou-se maior e menor densidade de sementes. A produtividade foi medida com monitor de colheita acoplado em uma colhedora. Os dados foram filtrados e submetidos à análise descritiva, os mapas de produtividade foram gerados utilizando-se o interpolador inverso do quadrado da distância para cada densidade de semeadura. Na ZM com maior potencial produtivo (ZM 1) a produtividade foi de 3,39 e 3,18t ha-1, na ZM de menor potencial produtivo (ZM 2) foi de 3,30 e 3,11t ha-1,
para os anos de 2016 e 2018, respectivamente. O interpolador estimou maior produtividade com a aplicação de 15 plantas m-1; pela análise
econômica, sugere-se, dentro do estudado, a aplicação de 214.000 plantas ha-1 nas duas ZMs.
Palavras-chave: agricultura de precisão, produção de grãos, unidades de manejo.
2 Camicia et al.
Definition of MZs is the delimitation of subareas with topographic, soil and similar crop characteristics within a field. Among the many variables that can be used for this definition, those that are stable and spatially correlated with productivity are often recommended for use (GAVIOLI et al., 2016). Delimitation of MZs is a form of classifying spatial variability within a field (BAZZI et al., 2015).
MZs can generate several management
strategies specific to the area (SCHENATTO et al.,
2016) including sowing with different densities (MILANI et al., 2006). The growing interest in increasing crop yields has stimulated the use of intensive management. According to SANGOI et al. (2002), there is an optimal population in which crop productivity is maximized. The performance of maize, for example, is often affected by differential management because corn is sensitive to environmental factors and changes in plant arrangement (LICHT et al., 2016). However, soybean crops with smaller densities - around 10 to 15 plants m-1 - are being successfully used. These
crops do not reduce productivity significantly, and
reduce production costs by decreasing seed costs (TOURINO et al. al., 2002).
Studies have shown that changes in sowing rate may lead to an increase in grain yield. LUDWIG et al. (2011) evaluated different soybean cultivars in three plant populations (250, 400, and 550 thousand plants ha-1). These authors obtained
better results for the population of 550 thousand plants ha-1. In contrast, PETTER et al. (2016)
reported that densities of 200 and 300 thousand plants m-2 provided higher grain yield and better use
of photosynthetically active radiation efficiency.
RIBEIRO et al. (2017) tested 4 population densities (300, 400, 500, and 600 thousand plants per ha-1)
in 6 cultivars, and described that regardless of the soybean cultivar, plant density of up to 600,000ha-1
does not affect grain yield.
In addition, studies on the reduction of line spacing showed that, for some soybean varieties, this reduction may lead to productivity gain (WALKER et al., 2010). However, in varieties that have more
plasticity, the final productivity is not always influenced when spacings larger than recommended
are used. In this sense, the reduction of row spacing from 57 to 19cm (PROCÓPIO et al., 2014) decreased soybean yield BRS 294 PR. A number of authors including WORKU & ASTATKIE (2011) and GULLUOGLU et al. (2017) have been testing the use of spacings of up to 70cm for soybean cultivars.
In this context, the present study aimed to evaluate soybean crop yield with the application of densities 171,200, 214,000, and 257,000 plants ha-1
spaced between 0.70m lines in MZs pre-established in a commercial agricultural area.
MATERIALS AND METHODS
The data used in this study were collected in a rural property located in the city of Céu Azul, located in the West of Paraná, south Brazil, with geographical coordinates of latitude 25º06’32’’S and longitude 53º49’55’’O and average elevation of 752m. The sampled area has 15.5ha (hectares), typical Dystroferric Red Latosol (EMBRAPA, 2006), and cultivated in a no-tillage system for more than 10 years, with a sequence of soybean, wheat, oats, and corn.
The composition of chemical attributes and granulometry of the area presented in a depth of 0-0.2m mean values of P (Phosphorus): 23.45mg dm-3 (2016) and 22.04mg dm-3 (2017);
K (Potassium): 0.61Cmolc dm-3 (2016) and
0.55Cmolc dm-3 (2017); MO (organic matter):
34.83 and 30.91g dm-3, respectively, for 2016 and
2017; pH: 5.4 (2016) and 5.2 (2017); sand: 19.22%; silt: 19.28%; and clay: 61.48% (2016). Results of
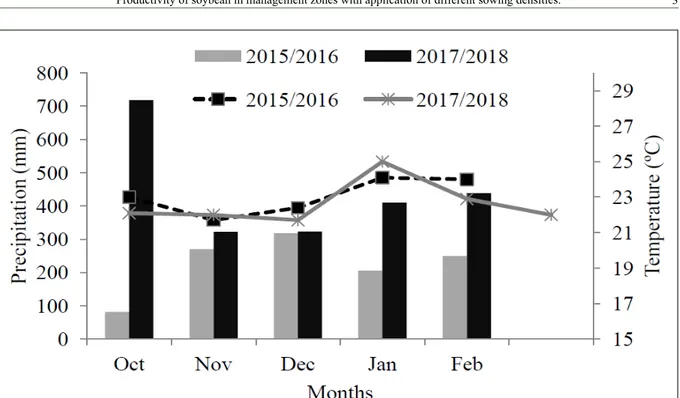
climate data are presented in figure 1.
Sowing of the crops was performed in two MZs established by SCHENATTO et al. (2016) (Figure 2A), and was subdivided into 4 regions that considered the relief of the area and the level curves, and which were also subdivided into 4 plots (Figure 2B) and consisted of 4 treatments and 4 replicates. Dimensions: MZ1: 8.51ha, MZ 2: 7.01ha; Plots: 1, 2, 3, 4, 5, 6, 7, 8, 9, 10, 11, 12, 13, 14, 15, and 16 with 0.36; 1.32; 1.07; 0.85; 1.40; 0.57; 0.49; 0.79; 0.76; 0.69; 1.05; 1.55; 0.79; 1.23; 0.67, and 1.93ha, respectively.
In the delineation of the MZs, soil size (clay, sand, and silt contents), soil resistance to penetration, elevation and slope were used as candidate variables, correlating them with soybean yield data collected in the 2011/2012 and 2012/2013 harvests (SCHENATTO et al., 2016). Thematic maps were generated by the Fuzzy C-means clustering method using a SDUM software (BAZZI et al., 2015) with kriging interpolation, with the presentation of management zone 1 (MZ 1) as the one with the greatest productive potential, and management zone 2 (MZ 2) as the one with the lowest productive potential.
variable rate monitor coupled with 15 m-1 seeds in odd
plots and 18 m-1 seeds in pairs (Figure 2B). Along with
sowing, on October 17, 2015, there was application of 145kg ha-1 of chemical fertilizer formulated 08-40-00,
and the harvest was performed on February 23, 2016. On October 19, 2017, the same cultivar was sown again, with 12 seeds m-1 being sown in odd plots and
15m-1 seeds in pairs (Figure 2B). In this particular case,
the harvest was performed on February 22, 2018. In both years the line spacing was 70cm; although, not very common, the producer has been using such spacing with satisfactory results and, as a result, even, there is seed saving, a number of authors including MACHADO et al. Figure 1 - Monthly averages of rainfall and temperature for the 2015/2016 and 2017/2018 crops for the municipality of Céu Azul-PR,
Brazil. Source: Paraná Meteorological System (SIMEPAR).
4 Camicia et al.
(2018), RAMBO et al. (2003), and PIRES et al. (2000) stated that this response may be related to the phenotypic plasticity that soybean plants present since they compensate for the increase in spacing with the increase of individual pod production which contribute to a greater tolerance to this variation. Thinning was performed 15 days after emergence which guaranteed the number of plants and their spatial distribution corresponding to the population of respective treatments (214,000 and 257,000 plants ha-1 in
the 2015/2016 harvest, and 171,200 and 214,000 plants ha-1 for the 2017/2018 harvest) for both
years of study.
Productivity was measured with AFS PRO 600 harvest monitor (Case IH, Racine, USA) connected to a CASE IH 2388 harvester (CASE IH, Sorocaba, Brazil). The file from the harvest monitor was converted using a AFS Case software and filtered as suggested by MICHELAN et al. (2007).
For each of the 16 plots filtered with
productivity data, an exploratory analysis was performed, measuring position (mean), dispersion (standard deviation), and distribution pattern
(coefficient of variation and variance). The median
values were compared with the Tukey test at 5% probability using the R software (R DEVELOPMENT CORE TEAM, 2013).
The inverse square distance (ISD) interpolation was the method used for the interpolation of data as proposed by BETZEK et al. (2017). Productivity maps were then constructed using the ArcGIS software.Maps were constructed for each sowing density. Then the map algebra was performed, and a map of the difference between the crop productivity map using higher and lower sowing densities was reported.
For the economic analysis of the adjustment of the populations to the study area, the soybean sale price of R$ 60.00 and R$ 63.00 per bag of 60kg were used for 2016 and 2018, respectively. The acquisition cost of soybean seeds was R$ 5.50 kg-1 in 2015 and R$ 5.78 kg-1 in 2017. To calculate
how many seeds were in 1kg of soybean, the values made available by the manufacturer of the weight of 1 thousand soybeans were used which is based on the diameter of the seed.
The purchase cost of the seeds (R$ ha-1)
was obtained by multiplying the number of seeds used in 1 hectare and the price of 1 seed, and the correction rate (5%) from the statistical correlation was added to this value. The income (R$ ha-1)
was obtained from the product between average productivity (t ha-1) and price of the ton (R$).
RESULTS AND DISCUSSION
Achieved productivity
The average total productivity was 3.36 and 3.14t ha-1 (tons per hectare) for soybeans in 2016
and 2018, and was 16.7% above and 5.7% below the national average productivity of the same period, which was 2.88 and 3.33t ha-1 (EMBRAPA SOJA,
2016; EMBRAPA SOJA 2018). Comparatively, in the agricultural years 2011/2012 and 2012/2013, when an average of 257,000ha-1 plants were applied in this area,
the production was 2.44 and 3.93t ha-1, respectively.
In the first year of study in the fields where 15m-1 plants were applied, the average
productivity was 3.36t ha-1, while in the plots with
18 plants m-1 the average productivity decreased
to 3.34t ha-1; an average difference of 0.02t ha-1
more for the lowest sowing density. In the second year of the study, average soybean yield was 3.08t ha-1 with 12 plants m-1 and 3.20t ha-1 with 15m-1
plants. This result is in agreement with the one published by TOURINO et al. (2002) that reported the use of densities of 10 to 15 plants m-1 without
a significant reduction in productivity, keeping productivity levels at 0.60m spacing and even increasing it at the lowest density with a spacing of 0.45m.
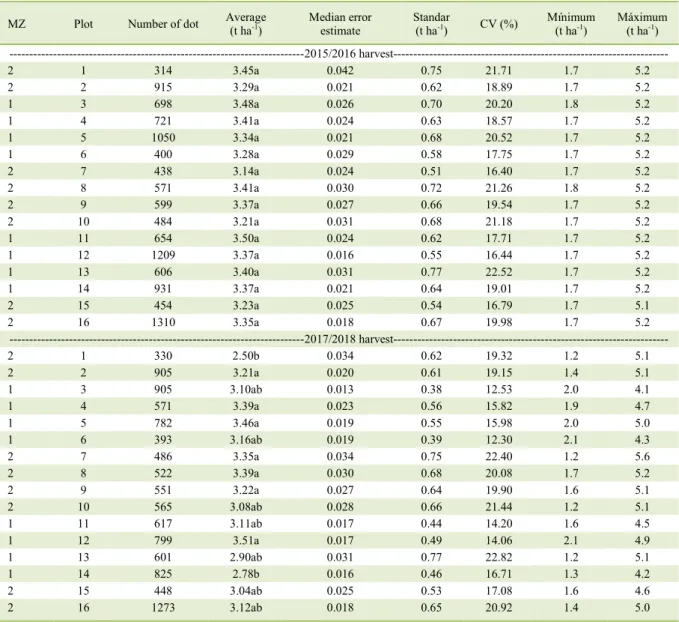
Soybean productivity values obtained are presented in table 1, in which the average production for soybean (2015/2016) in MZ 1 was 3.39t ha-1, with
3.43 and 3.36t ha-1 for 15 and 18m-1 plants, respectively.
In the 2017/2018 harvest, production in MZ 1 was 3.18t ha-1, 3.14 and 3.21t ha-1 for 12 and 15 plants m-1,
with a difference of approximately 0.07t ha-1.
It was noted that the average of MZ 2 was 3.30 and 3.11t ha-1 of soybean for 2016 and
2018, respectively. In this region, there was a larger production with density of 18 plants m-1
(mean 3.31t ha-1) while the density of 15 plants
m-1 had a productivity of 3.30t ha-1 in the first year
of study. However, in the second year of testing, 15 plants m-1 (3.20t ha-1), more than 12 plants m-1
(3.03t ha-1) were produced.
Based on the data provided in table 1, we inferred that plots with higher productivity for soy were 12, 11, and 3 with 3.51 (17/18), 3.50 (15/16), and 3.48 (15/16) t ha-1, respectively, followed by
plots 1, 4, 8, and 13, with 3.45, 3.41, 3.41, and 3.40t ha-1 (related to 15/16). It is noted that, except
the group with the introduction of 15 plants m-1.
This finding may be explained by the 2015/2016
harvest based on the report published by RIBEIRO et al. (2017) which stated that in low densities soybean plants tend to produce more branches and; therefore, increase the number of pods per plant and the number of grains by pod as well. As a result, there are fewer plants per area and increased production by each individual. Overall, the lowest average productions were observed in
MZ 2 plots. The standard deviation in soybean crops in the years studied ranged ranged between 0,38 and 0,77 for the productivity variable. Data
from the coefficient of variation (CV) ranged from
12.30% to 22.80%. These CV average values were also noted by SANTI et al. (2013) in soy, corn, and wheat productions.
It was observed that there was no statistical difference in the zone management zone parameter in the 2 years of study. A similar Table 1 - Descriptive analysis of soybean productivity in the years 2015/2016 and 2017/2018.
MZ Plot Number of dot Average (t ha-1)
Median error estimate
Standar
(t ha-1) CV (%)
Mínimum (t ha-1)
Máximum (t ha-1)
---2015/2016 harvest---
2 1 314 3.45a 0.042 0.75 21.71 1.7 5.2
2 2 915 3.29a 0.021 0.62 18.89 1.7 5.2
1 3 698 3.48a 0.026 0.70 20.20 1.8 5.2
1 4 721 3.41a 0.024 0.63 18.57 1.7 5.2
1 5 1050 3.34a 0.021 0.68 20.52 1.7 5.2
1 6 400 3.28a 0.029 0.58 17.75 1.7 5.2
2 7 438 3.14a 0.024 0.51 16.40 1.7 5.2
2 8 571 3.41a 0.030 0.72 21.26 1.8 5.2
2 9 599 3.37a 0.027 0.66 19.54 1.7 5.2
2 10 484 3.21a 0.031 0.68 21.18 1.7 5.2
1 11 654 3.50a 0.024 0.62 17.71 1.7 5.2
1 12 1209 3.37a 0.016 0.55 16.44 1.7 5.2
1 13 606 3.40a 0.031 0.77 22.52 1.7 5.2
1 14 931 3.37a 0.021 0.64 19.01 1.7 5.2
2 15 454 3.23a 0.025 0.54 16.79 1.7 5.1
2 16 1310 3.35a 0.018 0.67 19.98 1.7 5.2
---2017/2018 harvest---
2 1 330 2.50b 0.034 0.62 19.32 1.2 5.1
2 2 905 3.21a 0.020 0.61 19.15 1.4 5.1
1 3 905 3.10ab 0.013 0.38 12.53 2.0 4.1
1 4 571 3.39a 0.023 0.56 15.82 1.9 4.7
1 5 782 3.46a 0.019 0.55 15.98 2.0 5.0
1 6 393 3.16ab 0.019 0.39 12.30 2.1 4.3
2 7 486 3.35a 0.034 0.75 22.40 1.2 5.6
2 8 522 3.39a 0.030 0.68 20.08 1.7 5.2
2 9 551 3.22a 0.027 0.64 19.90 1.6 5.1
2 10 565 3.08ab 0.028 0.66 21.44 1.2 5.1
1 11 617 3.11ab 0.017 0.44 14.20 1.6 4.5
1 12 799 3.51a 0.017 0.49 14.06 2.1 4.9
1 13 601 2.90ab 0.031 0.77 22.82 1.2 5.1
1 14 825 2.78b 0.016 0.46 16.71 1.3 4.2
2 15 448 3.04ab 0.025 0.53 17.08 1.6 4.6
2 16 1273 3.12ab 0.018 0.65 20.92 1.4 5.0
Notes: Zone 1: Higher productive potential, Zone 2: Lower productive potential, tons per hectare (t ha-1), Percentage (%), Coefficient of
6 Camicia et al.
result was obtained for the sowing density in crop 2015/2016, and the averages did not differ statistically between each other. In 2017/2018, there were some statistical differences in the production between plots, but these were statistically similar between the MZs.
Productivity maps
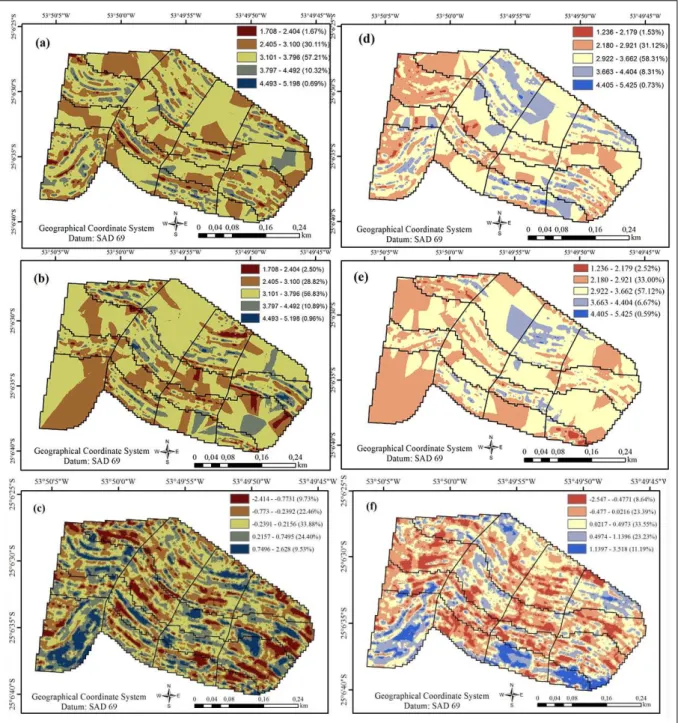
Productivity maps of the soybean crop were constructed based on results obtained with the application of densities of 15 and 18 plants m-1 (2015/2016 harvest) and are shown in figures
3A and 3B. The maps shown in figure 3D and 3E
were constructed based on results obtained with the application of 12 and 15 plants m-1 (2017/2018
harvest). In both cases, it is observed that the area was divided into 5 color classes to demonstrate productivity zones.
In the 2015/2016 harvest, it was noted that with the application of 18m-1 plants, 57.20%
of the area (8.9ha) had a productivity between 3.1 and 3.8t ha-1. In figure 3B, it is shown that
the productivity of 3.1 to 3.8t ha-1 was reported
in 56.83% of the planted area. Values for higher and lower sowing density had a slight variation. Thus, it is possible to observe in the map of the productivity difference (see Figure 3C) that 55% of the area presents negative values, denoting higher productivity when the density of sowing of 15 plants m-1 was used. Production was increased
in 45% of the area with the highest density of sowing. We should highlight the fact that these values are valid for the cultivar of study using a spacing of 0.70m. With the attribute table provided by the software, there is increased production for the lowest sowing density with a difference of approximately 0.31 tons for the total area. A different result was reported by CRUZ et al. (2016). These researchers noted an increase in productivity as the plant population increased which may be explained by spacing, climate, variety or other undetermined factor in this study. In contrast, MACHADO et al. (2018) observed that the densities of 16 and 12 plants m-1 provided
better grain yields for the UFUS LVR and UFU 7,910 genotypes, respectively. Densities of 12 and 14 of plants m-1 resulted in higher numbers
of pods and productivity for cultivar UFUS 8,301 with a spacing of 0.50m.
In 2017/2018, with the application of the highest sowing density (15 plants m-1), 58.31% of
the results were within the range of 2.9 to 3.7t ha-1
(Figure 3D), with an estimated average of 3.22t
ha-1 for the total area. With 12 plants m-1, this
percentage for the same interval was 57.12%, and the average production for this density estimated at 3.06t ha-1.
The map of the difference between the densities of 15 and 12 plants m-1 (Figure 3F)
emphasizes a larger production difference between sowing densities when compared to the 2015/2016 harvest. Approximately 68% of the area presented only positive values denoting higher productivity when the seeding density of 15 plants m-1 was used,
with a difference of approximately 2 tons being characterized for the total area.
Economic analysis
As there was no significant difference
between the MZs, we estimated sowing at the constant rate in the entire area. For soybean, a population of 171,200 plants ha-1 would require
505kg of the legume with a cost of R$ 188,311ha-1;
631kg of soybeans would be required for a population of 214,000ha-1 plants with a cost of R$ 223.90ha -1 (2015/2016) and R$ 235.16ha-1 (2017/2018); a
population of 257,000 plants ha-1 would need 758kg
of soybean seeds at a cost of R$ 268.97ha-1.
Data on seed density with its respective average yield and seed cost for the implantation of soybean seeding densities are presented in figure 4. The graph presented in figure 4A shows a decrease in productivity with increasing soybean seed density in the 2015/2016 harvest (equivalent to a loss of R$ 20.00 ha-1) and a 12% increase
in acquisition of seeds for the implantation of the population of 18 plants m-1 throughout the planting
area (R$ 45.07 ha-1). In figure 4B, the application
of 12 and 15 plants m-1 is compared which
generated a cost of R$ 47.03 for the application of the highest density and caused an increase in the final revenue of R$ 115.50 ha-1 resulting in a
substantial population increase.
CONCLUSION
The management zone (MZ) with greater productive potential presented better results but these
were not significant in terms of productivity since
there was no statistical difference between mean values. Seed densities produced yield differences. For soybean with a line spacing of 0.70m, the density of 15 plants m-1 provided the highest yields. Based on results of the economic analysis, the use of this density in the entire area is the best option in order to
8 Camicia et al.
ACKNOWLEDGMENTS
The authors gratefully acknowledge the Universidade Estadual do Oeste do Paraná (UNIOESTE - PR, Brazil), and the agronomist engineer Aldo Tasca, owner of the experimental area where the present study was carried out.
DECLARATION OF CONFLICTING INTERESTS
The authors declare no conflict of interest. The
founding sponsors had no role in the design of the study; in the collection, analyses, or interpretation of data; in the writing of the manuscript, and in the decision to publish the results.
AUTHORS’ CONTRIBUTIONS
The authors contributed equally to the manuscript.
REFERENCES
BAZZI, C. L. et al. Management zones applied to pear orchard.
International Journal of Food Agriculture and Environment,
v. 13, n. 1, p. 86-92, 2015. Available from: <http://ppat.md.utfpr. edu.br/resources/14639640321231.pdf>. Accessed: May 21, 2017.
BETZEK, N. M. et al. Interpolation methods for thematic maps of soybean yield and soil chemical attributes Métodos de interpolação para mapas temáticos de produtividade da soja e atributos químicos Figure 4 - (a) Relation of the productivity of soybean crop in the 2015/2016 harvest and the cost with
do solo. Semina: Ciências Agrárias, v. 38, n. 2, p. 1059-1070, 2017. Available from: <http://www.uel.br/revistas/uel/index.php/ semagrarias/article/viewFile/24585/20850>. Accessed: Dec. 14, 2017. doi: 10.5433/1679-0359.2017v38n2p1059.
BIER, A. B.; SOUZA, E. G. Interpolation selection index for delineation of thematic maps. Computers and Electronics in
Agriculture, v. 136, p. 202–209, 2017. Available from: <https://
www.sciencedirect.com/science/article/pii/S0168169916303982>. Acessed: Feb. 14, 2018. doi: 10.1016/j.compag.2017.03.008.
CRUZ, S. C. S. et al. Soybean cropping under different plant densities and spatial arrangements. Revista de Agricultura Neotropical, v. 3, n. 1, p. 1–6, 2016. Available from: <https://periodicosonline.uems. br/index.php/agrineo/article/view/431>. Accessed: Nov. 11, 2017. doi: 10.32404/rean.v3i1.431.
EMBRAPA – Empresa Brasileira de Pesquisa Agropecuária. Sistema
brasileiro de classificação do solo.Rio de Janeiro: CNPSO, 2006. 412p.
EMBRAPA SOJA, 2016. Available from: <https://www.embrapa. br/soja/cultivos/soja1>. Accessed: Sept. 04, 2017.
EMBRAPA SOJA, 2018. Available from: <https://www.embrapa. br/soja/cultivos/soja1/dados-economicos>. Accessed: Jun. 12, 2018.
GAVIOLI, A. et al. Optimization of management zone delineation by using spatial principal components. Computers and Electronics in
Agriculture, n. 127, p. 302–310, 2016. Available from: <http://ppat.
md.utfpr.edu.br/resources/14683748483100.pdf>. Accessed: Jan. 15, 2018. doi: 10.1016/j.compag.2016.06.029.
GULLUOGLU, L. et al. Effect of plant density on the yield and agronomical traits of Soybean crops in main cropped soybean production. Journal of Experimental Biology and Agricultural
Sciences, v. 5, n. 1, p.31-17, 2017. Available from: <http://jebas.org/Jou.
Exp.Bio.Agr.Sci/Vol5_17_Issue_N1/10.18006_2017.5(1).031.037. pdf>. Accessed: Sept. 20, 2018. doi: 10.18006/2017.5(1).031.037.
LICHT, M. A. et al. Corn (Zea mays L.) seeding rate optimization in Iowa.
Precision Agriculture, v. 18, p. 452-469, 2017. Available from: <https://
link.springer.com/content/pdf/10.1007%2Fs11119-016-9464-7.pdf>. Accessed: Dec. 12, 2017. doi: 10.1007/s11119-016-9464-7.
LUDWIG, M. P. et al. Soybean plant stand in conventional cultivars and Roundup ReadyTM.Revista Ceres, v. 58, p. 305-313, 2011. Available from: <http://www.scielo.br/scielo.php?script=sci_arttext&pid=S0034-737X2011000300010>. Accessed: Sept. 20, 2018. doi: 10.1590/s0034-737x2011000300010.
MACHADO, B. Q. V. et al. Agronomic performance of soybean genotypes submitted to different population densities in the city of Uberlândia – MG. Científica, v. 46, n. 3, p. 264-273, 2018. Available
from: <http://cientifica.org.br/index.php/cientifica/article/view/1068>.
Accessed: Jul. 22, 2018. doi: 10.15361/1984-5529.2018v46n3p264-273.
MICHELAN, R. et al. Determination and removal of the time delay in corn crop maps. Acta Scientiarum Agronomy, v. 29, n. 2, p. 147-155, 2007. Available from: <http://periodicos.uem.br/ojs/index. php/ActaSciAgron/article/view/337>. Accessed: Nov. 24, 2016. doi: 10.4025/actasciagron.v29i2.337.
MILANI, L. et al. Management units based on productivity data.
Acta Scientiarum Agronomy, v. 28, n. 4, p. 591–598, 2006.
Available from: <http://eduem.uem.br/ojs/index.php/ActaSciAgron/ article/viewFile/937/465>. Accessed: Oct. 23, 2016.
PIRES, J. F. L. et al. Effect of population and spacing on soybean potential yield during ontogeny. Pesquisa Agropecuária Brasileira, v. 35, n. 8, p. 1541– 1547, 2000. Available from: <http://www.scielo.br/pdf/pab/v35n8/v35n8a06. pdf>. Accessed: Sept. 18, 2018. doi: 10.1590/S0100-204X2000000800006.
PETTER, F. A. et al. Does high seeding density increase soybean productivity? Photosynthetically active radiation responses. Bragantia, v. 75, n. 2, p. 173-183, 2016. Available from: <http://www.scielo.br/ scielo.php?script=sci_arttext&pid=S0006-87052016000200173>. Accessed: May 13, 2016. doi: 10.1590/1678-4499.447.
PROCÓPIO, S. O. et al. Sowing in twin or narrow rows in soybean crop.
Revista Agroambiente On-line, v. 8, n. 2, p. 212-221, 2014. Available
from: <https://revista.ufrr.br/agroambiente/article/view/1469>. Accessed: Nov. 13, 2017. doi: 10.18227/1982-8470ragro.v8i2.1469.
RAMBO, L. et al. Soybean yield response to plant arrangement.
Ciência Rural,v. 33, n. 3, p. 405-411, 2003. Available from: <http://
www.scielo.br/pdf/cr/v33n3/a03v33n3.pdf>. Accessed: Sept. 18, 2018.
R DEVELOPMENT CORE TEAM. R: a language and environment for statistical computing. Vienna: R Foundation for Statistical Computing, 2013. Available from: <http://www.R-project.org>. Accessed: Jun. 3, 2016.
RIBEIRO, A. B. M. et al. Productive performance of soybean cultivars grown in different plant densities. Ciência Rural, v. 47, n. 7, p. 1-8, 2017. Available from: <http://www.scielo.br/scielo.php?script=sci_ar ttext&pid=S0103-84782017000700202>. Accessed: May 15, 2018. doi: 10.1590/0103-8478cr20160928.
SANGOI, L. et al. Response of Brazilian maize hybrids from diferente eras to change in plant population. Field Crops Res., v. 79, n. 1, p. 39-51, 2002. Available from: <http://www.scielo.br/scielo.php?script=sci_ arttext&pid=S0103-4782006000500004>. Accessed: May 21, 2017. doi: 10.1016/S0378-4290(02)00124-7.
SANTI, A. L. et al. Definition of yield zones in areas managed with
precision agriculture. Revista Brasileira de Ciências Agrárias, v.8, n.3, p.510-515, 2013. Available from: <http://www.agraria.pro.br/ sistema/index.p?journal=agraria&page=article&op=viewArticle& path%5B%5D=agraria_v8i3a2489>. Accessed: Jun. 16, 2017. doi: 10.5039/agraria.v8i3a2489.
SCHENATTO, K. et al. Data Interpolation in the definition of management
zones. Acta Scientiarum Technology, v. 38, n. 1, p. 31-40, 2016. Available from: <http://periodicos.uem.br/ojs/index.php/ActaSciTechnol/ article/view/27745/pdf_128>. Accessed: Apr. 12, 2016. doi: 10.4025/ actascitechnol.v38i1.27745.
TOURINO, M. C. C. et al. Row spacing plant density and intrarow plant spacing uniformity effect on soybean yield and agronomic characteristics.
Pesquisa Agropecuária Brasileira, v. 37, n. 8, p. 1071-1077, 2002.
Available from: <http://www.scielo.br/pdf/pab/v37n8/11666>. Accessed: Feb. 11, 2018. doi: 10.1590/s0100-204x2002000800004.
WALKER, E.R. et al. Plant population and row-spacing effects on maturity group III soybean. Agronomy Journal, v. 102, n. 3, p. 821-826, 2010. Available from: <https://dl.sciencesocieties.org/publications/ aj/abstracts/102/3/821?access=0&view=article>. Accessed: Sept. 18, 2018. doi: 10.2134/agronj2009.0219.