Revista Brasileira de
Engenharia Agrícola e Ambiental
Campina Grande, PB, UAEA/UFCG – http://www.agriambi.com.br
v.21, n.11, p.763-768, 2017
Simulation of wheat biomass yield by thermal time, rainfall and nitrogen
Ana P. B. Trautmann
1, José A. G. da Silva
2, Manuel O. Binelo
1,
Osmar B. Scremin
1, Ângela T. W De Mamann
1& Luiz M. Bandeira
2DOI: http://dx.doi.org/10.1590/1807-1929/agriambi.v21n11p763-768
A B S T R A C T
Wheat biomass yield focused on the production of quality silage is dependent on rainfall, temperature and nitrogen (N). The objective of the study was to validate the use of rainfall, thermal time and N as potential variables for the composition of the multiple linear regression model and simulation of wheat biomass yield for silage production under N supply conditions during the cycle, in the systems of succession. The study was conducted in 2012, 2013 and 2014, in randomized blocks with four replicates in 4 x 3 factorial, for N-fertilizer doses (0, 30, 60, 120 kg ha-1) and forms of N supply [single application (100%) in
the stage V3 (third expanded leaf); split application (70%/30%) in the stages V3/V6 (third and sixth expanded leaves); split application (70%/30%) in the stages V3/E (third expanded leaf and beginning of grain filling)], respectively, in the systems soybean/wheat and maize/wheat. Rainfall and N are potential variables in the composition of the multiple linear regression model. Multiple linear regression models are efficient in the simulation of wheat biomass yield for silage under the N supply conditions during the cycle in the succession systems.
Simulação da produtividade de biomassa do trigo
pela soma térmica, precipitação e nitrogênio
R E S U M O
A produção de biomassa de trigo voltada para a elaboração de silagem de qualidade é dependente da precipitação, da temperatura e do nitrogênio. O objetivo no estudo foi validar o uso da precipitação, soma térmica e nitrogênio como variáveis potenciais para composição do modelo de regressão linear múltipla e a simulação da produtividade de biomassa do trigo na elaboração de silagem nas condições de fornecimento de nitrogênio durante o ciclo, nos sistemas de sucessão. O estudo foi conduzido em 2012, 2013 e 2014 em blocos ao acaso com quatro repetições em fatorial 4 x 3, para doses de N-fertilizante (0, 30, 60, 120 kg ha-1) e formas de fornecimento [único (100%) no estádio V
3 (terceira folha
expandida); fracionado (70%/30%) no estádio V3/V6 (terceira e sexta folha expandida) e fracionado (70%/30%) no estádio V3/E (terceira folha expandida e início do enchimento de grãos)] respectivamente, no sistema soja/trigo e milho/trigo. A precipitação e o nitrogênio são variáveis potenciais na composição do modelo de regressão linear múltipla. Os modelos de regressão linear múltipla são eficientes para simulação da produtividade de biomassa do trigo para silagem nas condições de fornecimento de nitrogênio durante o ciclo nos sistemas de sucessão.
Key words:
Triticum aestivum
N dose
split N application residual N silage
Palavras-chave:
Triticum aestivum
N-dose
N-fracionamento N-residual silagem
1 Universidade Regional do Noroeste do Estado do Rio Grande do Sul/Departamento de Ciências Exatas e Engenharias. Ijuí, RS. E-mail: [email protected]
(Corresponding author), [email protected], [email protected], [email protected]
2 Universidade Regional do Noroeste do Estado do Rio Grande do Sul/Departamento de Estudos Agrários. Ijuí, RS. E-mail: [email protected],
Introduction
Silage is a product of forage conservation through anaerobiosis, in which soluble carbohydrates are converted into organic acids by acid-lactic bacteria, preserving the nutritional value (Zamarchi et al., 2014). Ensilage of grasses is an alternative to supply quality silage in period of pasture scarcity (Paris et al., 2015). In southern Brazil, wheat silage has gained attention for the high nutritional value existing in the whole plant (Rosário et al., 2012).
The high biomass yield of wheat is associated with weather conditions, genetic performance of the cultivars and management techniques, including phytosanitary control and nitrogen supply (Silva et al., 2015).
Nitrogen (N) is the nutrient that most stimulates shoot and root growth, with expressive effects on yield (Wrobel et al., 2016); however, it is the most easily lost by environmental conditions, which can compromise efficiency, reduce yield and cause environmental pollution (Viola et al., 2013).
Higher N efficiency is dependent on adequate soil moisture, not always obtained at the moment of fertilization (Silva et al., 2016). Therefore, studies have suggested the use of single or split N dose according to the weather conditions of the cultivation (Ferrari et al., 2016).
In this context, the relationships between weather elements and N can favor the construction of models to simulate wheat yield for silage production and contribute to a more efficient management in nitrogen use.
This study aimed to validate the use of rainfall, thermal time and N as potential variables to compose the multiple linear regression model and simulate wheat biomass yield for silage production under N supply conditions during the cycle, in the systems of succession.
Material and Methods
The study was carried out in 2012, 2013 and 2014 in Augusto Pestana, RS, Brazil. The soil was classified as typic dystroferric Red Latosol and the climate, according to Köppen’s classification, as Cfa, with hot summer without dry season (Kuinchtner & Buriol, 2001). Ten days prior to sowing, soil analysis was performed (Tedesco et al.,1995) and, on the average of the years, the following characteristics were identified: i) soybean/wheat system (pH = 6.1, P = 49.1 mg dm-3, K = 424 mg dm-3, OM = 30 g kg-1, Al = 0 cmol
c dm -3,
Ca = 6.3 cmolc dm-3 and Mg = 2.5 cmol c dm
-3) and; ii) maize/
wheat system (pH = 6.5; P = 23.6 mg dm-3; K = 295 mg dm-3,
OM = 29 g kg-1, Al = 0 cmol c dm
-3, Ca = 6.8 cmol c dm
-3 and Mg
= 3.1 cmolc dm-3). Sowing was made using a seeder-fertilizer
machine to compose the plots with five 5-m-long rows spaced by 0.20 m, forming the experimental unit with 5 m2. Population
density was 400 viable seeds m-2. The fungicide Tebuconazole
was applied at dose of 0.75 L ha-1 and weeds were controlled
using the herbicide Metsulfuron-methyl at dose of 4 g ha-1. At
sowing, 45 and 30 kg ha-1 of P
2O5 and K2O, respectively, were
applied based on the contents of P and K present in the soil for an expected grain yield of 3 t ha-1.
In each crop system (soybean/wheat, maize/wheat), the experimental design was randomized blocks with
four replicates in a 4 x 3 factorial scheme, for N-fertilizer doses (0, 30, 60, 120 kg ha-1) and forms of supply [single
application (100%) in the stage V3 (third expanded leaf); split application (70%/30%) in the stages V3/V6 (third and sixth expanded leaves); split application (70%/30%) in the stages V3/E (third expanded leaf and beginning of grain filling)], respectively, using the wheat cultivar ‘BRS Guamirim’, totaling 96 experimental units. Biomass was manually harvested by cutting 1 m² of each plot every 30 days. Plants were dried in an oven at temperature of 65 °C, until constant weight, and then weighed to estimate biomass yield (BY, kg ha-1). The mean
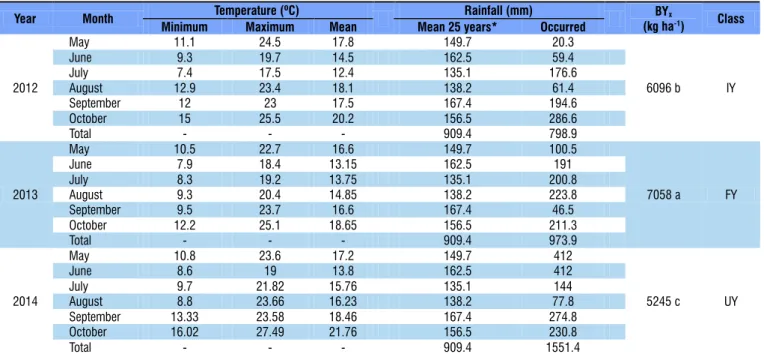
values of biomass yield, temperature and rainfall were used to classify the years as intermediate, unfavorable and favorable to wheat cultivation.
To meet the assumptions of homogeneity and normality through Bartlett’s tests, analysis of variance was made to detect main and interaction effects and then Scott-Knott test to compare the means. Potential variables for the multiple linear regression model were selected using the StepWise technique, which iteratively constructs a sequence of regression models through the addition and removal of variables, selecting those with highest correlation with the main variable (y) using the partial F statistics, according to Eq. 1:
F QS
QM x x
j
R j
E j
=
(
)
(
)
β β β| ,
,
1 0
1
where:
QSR - quadratic sum of the regression; and,
QME (xj, x1) - quadratic mean of the error in the model containing the variables x1 and xj.
The variables selected via StepWise were used to determine the multiple linear regression equation, for the simulation of wheat biomass yield to generate an equation of the following type:
y=b0±b x1 ±b x2 2±b x3 3±±b xn n
Described in the matrix form as:
y Y Y M Yn = 1 2 X
X X X
X X X
M M M M
X X X
p
p
n n pn
= 1 1 1
11 12 1
21 22 2
and
ε ε ε
ε =
1
2
M
n
These matrices were used to obtain the regression coefficients,
(
)
1ˆ X ' X − X ' Y
b =
and the variance of these coefficients was obtained by the co-variance matrix of the vector of the regression coefficients:
( )
ˆ(
)
1 2ˆ ˆ
Cov b = X ' X − σ
(
)(
)
2
ˆ ˆ
Y X Y X
ˆ
n p 1
− b − b σ =
− −
where:
n - number of equations; and, p - number of parameters.
The test of hypothesis verified H0 : bi = 0 vs Ha : bi≠ 0, expressed by:
( )
i i
i
ˆ t
ˆ ˆ V b − b =
b
These analyses were made using the computer program Genes (Cruz, 2013).
Results and Discussion
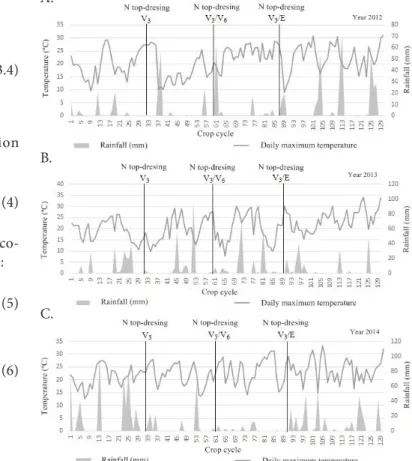
For N application in the V3 stage, in 2012, the mean maximum temperature showed the highest value compared with the other years (Figure 1A). High temperatures without occurrence of rainfall were observed before and after fertilization, favoring losses of the nutrient through volatilization. Soil moisture conditions for the fertilization in V3/V6 and V3/E were adequate, because of rainfalls during the previous days. Although the rainfall volume was the lowest one compared with the historical average (Table 1), meteorological data, along with the reasonable yield, characterize 2012 as an intermediate year (IY) of cultivation. In 2013, maximum temperature for the N-fertilizer application in V3 was approximately 15 ºC and with favorable conditions of soil moisture, because of rainfalls during the days prior to fertilization (Figure 1B). This condition was also observed in the fertilization in V3/V6 and V3/E. According to Table 1, the total volume of rainfall was similar to the historical average, indicating adequate rainfall distribution along the cycle (Figure 1B). These conditions were decisive for the highest mean yield, characterizing 2013 as a favorable year (FY) for cultivation. In 2014, maximum temperature around 23
Figure 1. Rainfall, maximum temperature and days of nitrogen application in the wheat cycle (A) 2012, (B) 2013 and (C) 2014
C. B. A.
°C (Figure 1C) occurred during N-fertilizer application in V3. N application was followed by a significant volume of rainfalls (± 30 mm), a condition also observed close to grain harvest. When N was applied in V3/E, soil moisture was not adequate for fertilization. These facts justify the lower yield (Table 1), either by N loss through leaching in V3, reduced soil moisture in V3/E or damages caused by rainfalls during maturation (Figure 1C), characterizing 2014 as unfavorable year (UY) for cultivation.
Agriculture is one of the most important segments and the most dependent on natural conditions (Silva et al., 2008). Temperature and rainfall are the meteorological elements that most influence crop yield (Cordeiro et al., 2015). In wheat, a favorable climate is that with mild temperatures, good radiation index to favor tillering and grain filling, with occurrence of rains in small amounts and adequate soil moisture (Pereira et al., 2015).
The proposal of wheat biomass yield simulation per agricultural year does not contemplate efficient models, due to the strong variation between the cultivation years, interfering with N use for yield (Table 1 and Figure 1). Therefore, the cumulative effect of variability between unfavorable, intermediate and favorable years was considered to obtain the values of thermal time, rainfall and biomass yield in the crop cycle and the multiple linear regression coefficients for yield simulation. Thus, Table 2 shows the sum of meteorological values in each moment of cut, along with the mean biomass yields in each N supply condition in the systems of succession. In the soybean/wheat system, biomass yield was altered by the single and split N application at 60, 90 and 120 days after emergence at doses of 30 and 60 kg ha-1. In the maize/wheat
(3.4)
(4)
(5)
(6)
Table 1. Temperature and rainfall in the months of wheat cultivation and mean biomass yield
Year Month Temperature (ºC) Rainfall (mm) BYx
(kg ha-1) Class
Minimum Maximum Mean Mean 25 years* Occurred
2012
May 11.1 24.5 17.8 149.7 20.3
6096 b IY
June 9.3 19.7 14.5 162.5 59.4
July 7.4 17.5 12.4 135.1 176.6
August 12.9 23.4 18.1 138.2 61.4
September 12 23 17.5 167.4 194.6
October 15 25.5 20.2 156.5 286.6
Total - - - 909.4 798.9
2013
May 10.5 22.7 16.6 149.7 100.5
7058 a FY
June 7.9 18.4 13.15 162.5 191
July 8.3 19.2 13.75 135.1 200.8
August 9.3 20.4 14.85 138.2 223.8
September 9.5 23.7 16.6 167.4 46.5
October 12.2 25.1 18.65 156.5 211.3
Total - - - 909.4 973.9
2014
May 10.8 23.6 17.2 149.7 412
5245 c UY
June 8.6 19 13.8 162.5 412
July 9.7 21.82 15.76 135.1 144
August 8.8 23.66 16.23 138.2 77.8
September 13.33 23.58 18.46 167.4 274.8
October 16.02 27.49 21.76 156.5 230.8
Total - - - 909.4 1551.4
*Mean rainfall obtained from May to October from 1989 to 2014; Means followed by the same letter in the column do not differ at 0.05 probability level by Scott-Knott test; IY - Intermediate year; FY - Favorable year; UY - Unfavorable year; BYx - Biomass yield
Table 2. Meteorological variables and biomass yields at different moments of cut under the nitrogen supply conditions
Selected variables
N dose (kg ha-1)
Phenological stage
Moment of cut (DAE)
30 60 90 120
(2012+2013+2014)
Thermal time (degree d-1) - - 322 692 1075 1593
Rainfall (mm m-2) - - 280 426 613 867
Soybean/wheat system (2012+2013+2014)
Biomass yield (kg ha-1)
0
V3 433 a 2152 a 5043 a 6874 a
V3/V6 411 a 1972 a 5467 a 7187 a
V3/E 411 a 1940 a 5144 a 6734 a
30
V3 455 a 2765 a 6812 a 7215 a
V3/V6 464 a 2349 a 6496 a 7496 a
V3/E 438 a 1735 b 5876 b 6717 b
60
V3 440 a 2833 a 6623 a 7393 a
V3/V6 437 a 2868 a 6639 a 7841 a
V3/E 395 a 2351 b 5869 b 7033 b
120
V3 446 a 3564 a 7080 a 7961 a
V3/V6 458 a 3362 a 7212 a 8185 a
V3/E 416 a 3271 a 6825 a 7998 a
Maize/wheat system (2012+2013+2014)
Biomass yield (kg ha-1)
0
V3 274 a 1281 a 3157 a 5521 a
V3/V6 201 a 1286 a 3430 a 5278 a
V3/E 214 a 1053 a 3596 a 5140 a
30
V3 253 a 1761 a 5053 a 5848 a
V3/V6 250 a 1602 a 4871 a 5703 a
V3/E 212 a 1187 b 4212 b 5283 b
60
V3 279 a 2170 a 5283 a 6586 a
V3/V6 270 a 1989 a 5735 a 6117 a
V3/E 249 a 1432 b 4788 b 5311 b
120
V3 261 a 2245 a 6061 a 6600 a
V3/V6 257 a 2184 a 6111 a 6584 a
V3/E 237 a 1975 a 5957 a 6324 a
DAE - Days after emergence; N - Nitrogen (kg ha-1); V
3 - Full (100%) N dose on third expanded leaf; V3/V6 - Split (70%/30%) N dose on third and sixth expanded leaves; V3/E - Split (70%/30%) N dose on third expanded leaf and beginning of grain filling; Means followed by the same letter in the column do not differ statistically at 0.05 probability level by Scott-Knott test
system, biomass yield also showed a similar behavior to the previously mentioned. Regardless of cultivation system, split N application in V3/E was the least efficient, but the supply in a single dose (V3) and split in V3/V6 did not cause alteration. Highest biomass yields were obtained in the soybean/wheat system, strengthening the benefits of the vegetal cover with higher residual-N release on crop yield.
application under more-favorable conditions of soil moisture, to reduce the operating costs of the application.
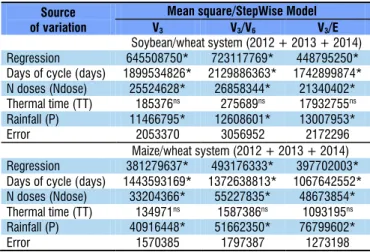
In the indication of potential variables for inclusion in the multiple linear regression models, the mean square significance of the variables analysed by the StepWise technique is presented (Table 3). In each N supply condition, the inclusion of days of cycle, N doses and rainfall were applied in the simulation of wheat biomass yield through the multiple model.
The identification of components that influence crop yield is decisive in the elaboration of efficient simulation models (Leal et al., 2015). The StepWise technique allows to select potential components for simulation through multiple linear regression (Balbinot Júnior et al., 2005; Mantai et al., 2016). Dalchiavon et al. (2012) selected through StepWise technique the number of panicles, panicle weight, number of spikelets per panicle and thousand-grain weight of rice to compose the multiple linear regression model in the simulation of grain yield. Mantai et al. (2016) simulated oat yield using the multiple model with the variables panicle harvest index, number of grains and spikelets per panicle and N.
Table 4 shows the multiple linear regression equations for the simulation of wheat biomass yield under the N supply conditions in the cultivation systems. This simulation used the values presented in Table 2 and the potential variables validated by the StepWise technique (Table 3). The observed values of biomass yield increased with the increment of N-fertilizer, regardless of system of succession. This trend of biomass growth was also obtained by the model of simulation through multiple regression. On the other hand, the results of biomass yield simulated by the proposed models in each N-fertilizer condition are very close to those observed in the actual cultivation conditions, thus validating an innovative proposal of simulation of wheat biomass yield for silage production.
Simulation through multiple linear regression can allow an efficient estimate of yield (Tsukahara et al., 2016). Mantai et al. (2016) estimated oat yield through multiple linear regression based on panicle harvest index, number of grains and spikelets per panicle and N use. Leilah & Al-Khateeb (2005) simulated through multiple regression wheat yield under drought
condition, using the variables grain weight per panicle, panicle harvest index and panicle length. Using this model, Godoy et al. (2015) analysed soil attributes to simulate rice grain yield in the use of copper, nitrogen, iron and acid phosphatase.
Conclusions
1. Rainfall and nitrogen are potential variables to compose the multiple linear regression model.
2. Multiple linear regression models are efficient to simulate wheat biomass yield for silage during the cycle in the systems of succession.
Acknowledgments
To the Coordination for the Improvement of Higher Education Personnel (CAPES), National Council for Scientific and Technological Development (CNPq), Rio Grande do Sul Research Support Foundation (FAPERGS) and the Regional University of the Northwest of Rio Grande do Sul (UNIJUÍ), for the financial support to the research and scholarships of Scientific Initiation, Technological Initiation and Research Productivity.
Literature Cited
Balbinot Júnior, A. A.; Backes, R. L.; Alves, A. C.; Ogliari, J. B.; Fonseca, J. A. da. Contribuição de componentes de rendimento na produtividade de grãos em variedades de polinização aberta de milho. Revista Brasileira Agrociência, v.11, p.161-166, 2005.
Days of cycle (Days) - Days of biomass cut (30, 60, 90 and 120 days); Thermal time (TT) degree d-1 ; Rainfall (P) mm m-2; Ndose - Nitrogen doses - 0, 30, 60, 120 kg N ha-1; V
3 - Full (100%) N dose on third expanded leaf; V3/V6 - Split (70%/30%) N dose on third and sixth expanded leaves; V3/E - Split (70%/30%) N dose on third expanded leaf and beginning of grain filling; *Significant by F test at 0.05 probability level; nsNot significant by F test at 0.05 probability level
Source of variation
Mean square/StepWise Model
V3 V3/V6 V3/E
Soybean/wheat system (2012 + 2013 + 2014)
Regression 645508750* 723117769* 448795250*
Days of cycle (days) 1899534826* 2129886363* 1742899874*
N doses (Ndose) 25524628* 26858344* 21340402*
Thermal time (TT) 185376ns 275689ns 17932755ns
Rainfall (P) 11466795* 12608601* 13007953*
Error 2053370 3056952 2172296
Maize/wheat system (2012 + 2013 + 2014)
Regression 381279637* 493176333* 397702003*
Days of cycle (days) 1443593169* 1372638813* 1067642552*
N doses (Ndose) 33204366* 55227835* 48673854*
Thermal time (TT) 134971ns 1587386ns 1093195ns
Rainfall (P) 40916448* 51662350* 76799602*
Error 1570385 1797387 1273198
Table 3. Identification of potential variables via StepWise technique to compose the multiple linear regression model for wheat biomass yield simulation
Table 4. Multiple linear regression for the estimate of total biomass yield based on nitrogen doses, rainfall and days in each cultivation system
Stage Dose (N)
Equation Y = f1(x1, x2, …)
BYO BYE
(kg ha-1) Soybean/wheat system (2012+2013+3014)
V3
0
BY = – 682.46 + 79.28days+ 8.02Ndose– 2.29P
6874 6846
30 7215 7086
60 7693 7327
120 7961 7808
V3/V6
0
BY = – 758.39 + 83.88days+ 8.23Ndose– 2.40P
7187 7226
30 7496 7473
60 7841 7720
120 8185 8214
V3/E
0
BY = – 2146.75 + 83.49days+ 12.26Ndose– 1.44P
6734 6624
30 6717 6991
60 7033 7359
120 7998 8095
Maize/wheat system (2012+2013+3014)
V3
0
BY = – 756.28 + 86.15days+ 8.79Ndose– 4.56P
5421 5628
30 5848 5892
60 6586 6156
120 6600 6683
V3/V6
0
BY = – 838.08 + 87.99days+ 11.34Ndose– 5.17P
5278 5238
30 5703 5579
60 6117 5919
120 6584 6599
V3/E
0
BY = – 201.04 + 88.77days+ 10.65Ndose– 6.21P
5140 5073
30 5283 5387
60 5311 5706
120 6324 6345
V3 - Full (100%) N dose on third expanded leaf; V3/V6 - Split (70%/30%) N dose on third and sixth expanded leaves; V3/E - Split (70%/30%) N dose on third expanded leaf and beginning of grain filling; Ndose - Nitrogen dose (0, 30, 60, 120 kg ha-1); P - Rainfall (mm); BY - Biomass yield (kg ha-1); BY
O - Observed biomass yield (kg ha -1); BY
Cordeiro, M. B.; Dallacort, R.; Freitas, P. S. L. de; Seabra Junior, S.; Santi, A.; Fenner, W. Aptidão agroclimática do trigo para as regiões de Rondonópolis, São José do Rio Claro, São Vicente e Tangará da Serra, Mato Grosso, Brasil. Revista Brasileira de Agroambiente, v.9, p.96-101, 2015. https://doi.org/10.5327/Z1982-84702015000121779 Cruz, C. D. Genes - A software package for analysis in experimental
statistics and quantitative genetics. Acta Scientiarum. Agronomy, v.35, p.271-276, 2013. https://doi.org/10.4025/actasciagron.v35i3.21251 Dalchiavon, F. C.; Carvalho, M. de P. e; Coletti, A. J.; Caione, G.; Silva,
A. F. da; Andreotti, M. Correlação linear entre componentes da produção e produtividade do arroz de terras altas em sistema plantio direto. Ciências Agrárias, v.33, p.1629-1642, 2012. https:// doi.org/10.5433/1679-0359.2012v33n5p1629
Espindula, M. C.; Rocha, V. S.; Souza, M. A. de; Grossi, J. A. S.; Souza L. T. de. Doses e formas de aplicação de nitrogênio no desenvolvimento e produção da cultura do trigo. Ciência e Agrotecnologia, v.34, p.1404-1411, 2010. https://doi.org/10.1590/ S1413-70542010000600007
Ferrari, M.; Nardino, M.; Carvalho, I. R.; Szareski, V. J.; Pelegrin, A. J. de; Souza, V. Q. de. Manejos e fontes de nitrogênio nos componentes de afilhamento de trigo. Revista Brasileira de Ciências Agrárias, v.11, p.178-185, 2016. https://doi.org/10.5039/agraria.v11i3a5379 Godoy, S. G. de; Stone, L. F.; Ferreira, E. P. de B.; Cobucci, T.; Lacerda, M.
C. Correlação entre produtividade do arroz no sistema semeadura direta e atributos do solo. Revista Brasileira de Engenharia Agrícola e Ambiental, v.19, p.119-125, 2015. https://doi.org/10.1590/1807-1929/agriambi.v19n2p119-125
Kuinchtne, A.; Buriol, G. A. Clima do estado do Rio Grade do Sul segundo a classificação climática de Köppen e Thornthwaite. Disciplinarum Scientia, v.2, p.171-182, 2001.
Leal, A. J. F.; Miguel, E. P.; Baio, F. H. R.; Neves, D. de C.; Leal, U. A. S. Redes neurais artificiais na predição da produtividade de milho e definição de sítios de manejo diferenciado por meio de atributos do solo. Bragantia, v.74, p.436-444, 2015. https://doi.org/10.1590/1678-4499.0140 Leilah, A. A.; Al-Khateeb, S. A. Statistical analysis of wheat yield under
drought conditions. Journal of Arid Environments, v.61, p.483-496, 2005. https://doi.org/10.1016/j.jaridenv.2004.10.011
Mantai, R. D.; Silva, J. A. G.; Arenhardt, E. G.; Scremin, O. B.; Mamann, Â. T. W. de; Frantz, R. Z.; Valdiero, A. C.; Pretto, R.; Krysczun, D. K. Simulation of oat grain (Avena sativa) using its panicle components and nitrogen fertilizer. African Journal of Agricultural Research, v.11, p.3975-3983, 2016. https://doi.org/10.5897/AJAR2016.10943 Paris, W.; Zamarchi, G.; Pavinato, P. S.; Martin, T. N. Qualidade da
silagem de aveia preta sob efeito de estádios fenológicos, tamanhos de partícula e pré-murchamento. Revista Brasileira Saúde e Produção Animal, v.16, p.486-498, 2015. https://doi.org/10.1590/ S1519-99402015000300002
Pereira, M. W. G.; Arêdes, A. F. de; Teixeira, E. C. Avaliação econômica do cultivo de trigo dos Estados do Rio Grande do Sul e Paraná. Revista de Economia e Agronegócio, v.5, p.591-610, 2015. Rosário, J. G. do; Neumann, M.; Ueno, R. K.; Marcondes, M. M.;
Mendes, M. C. Produção e utilização de silagem de trigo. Revista Brasileira de Tecnologia Aplicada nas Ciências Agrárias, v.5, p.207-218, 2012.
Silva, J. A. G. da; Arenhardt, E. G.; Krüger, C. A. M. B.; Lucchese, O. A.; Metz, M.; Marolli, A. A expressão dos componentes de produtividade do trigo pela classe tecnológica e aproveitamento do nitrogênio. Revista Brasileira de Engenharia Agrícola e Ambiental, v.19, p.27-33, 2015. http://dx.doi.org/10.1590/1807-1929/agriambi. v19n1p27-33
Silva, J. A. G. da; Goi Neto, C. J.; Fernandes, S. B. V.; Mantai, R. D.; Scremin, O. B.; Pretto, R. Nitrogen efficiency in oats on grain yield with stability. Revista Brasileira de Engenharia Agrícola e Ambiental, v.20, p.1095-1100, 2016. https://doi.org/10.1590/1807-1929/agriambi.v19n1p27-33
Silva, S. A. da; Arf, O.; Buzetti, S.; Silva, M. G. da. Fontes e épocas de aplicação de nitrogênio em trigo em sistema plantio direto. Revista Brasileira de Ciência do Solo, v.32, p.2717-2722, 2008. https://doi. org/10.1590/S0100-06832008000700015
Siqueira Neto, M.; Piccolo, M. de C.; Venzke Filho, S. de P.; Feigl, B. J.; Cerri, C. C. Mineralização e desnitrificação do nitrogênio no solo sob sistema plantio direto. Bragantia, v.69, p.923-936, 2010. https://doi.org/10.1590/S0006-87052010000400019
Tedesco, M. J.; Gianello. C.; Bissani, C. A.; Bohnen, H.; Volkweiss, S. J. Análise de solo, plantas e outros materiais. 2.ed. Porto Alegre: UFRGS, 1995. Boletim Técnico
Tsukahara, R. Y.; Fonseca, I. C. de B.; Silva, M. A. de A. e; Kochinski, E. G.; Prestes Neto, J.; Suyama, J. T. Produtividade de soja em consequência do atraso da colheita e de condições ambientais. Pesquisa Agropecuária Brasileira, v.51, p.905-915, 2016. https:// doi.org/10.1590/S0100-204X2016000800002
Viola, R.; Benin, G.; Cassol, L. C.; Pinnow, C.; Flores, M. F. Bornhofen, E. Adubação verde e nitrogenada na cultura do trigo em plantio direto. Bragantia, v.72, p.90-100, 2013. https://doi.org/10.1590/ S0006-87052013005000013
Wrobel, F. L.; Neumann, M.; Leão, G. F. M.; Horst, E. H.; Ueno, R. K. Doses de nitrogênio sobre produtividade e aspectos nutricionais de grãos e palha de trigo duplo propósito. Revista Acadêmica: Ciência Animal, v.14, p.27-35, 2016. https://doi.org/10.7213/ academica.14.2016.03