Revista Brasileira de
Engenharia Agrícola e Ambiental
Campina Grande, PB, UAEA/UFCG – http://www.agriambi.com.br
v.20, n.7, p.643-648, 2016
Potassium fertilizer applied by different methods in the zucchini crop
Carlos N. V. Fernandes
1, Benito M. de Azevedo
2, Débora C. Camargo
3,
Chrislene N.Dias
2, Mario de O. Rebouças Neto
4& Fellype R. B. Costa
2 DOI: http://dx.doi.org/10.1590/1807-1929/agriambi.v20n7p643-648A B S T R A C T
Aiming to evaluate the effect of potassium (K) doses applied by the conventional method and fertigation in zucchini (Cucurbita pepo L.), a field experiment was conducted in Fortaleza, CE, Brazil. The statistical design was a randomized block, with four replicates, in a 4 x 2 factorial scheme, which corresponded to four doses of K (0, 75, 150 and 300 kg K2O ha-1) and two fertilization methods (conventional and fertigation). The analyzed
variables were: fruit mass (FM), number of fruits (NF), fruit length (FL), fruit diameter (FD), pulp thickness (PT), soluble solids (SS), yield (Y), water use efficiency (WUE) and potassium use efficiency (KUE), besides an economic analysis using the net present value (NPV), internal rate of return (IRR) and payback period (PP). K doses influenced FM, FD, PT and Y, which increased linearly, with the highest value estimated at 36,828 kg ha-1 for
the highest K dose (300 kg K2O ha-1). This dose was also responsible for the largest WUE,
92 kg ha-1 mm-1. KUE showed quadratic behavior and the dose of 174 kg K 2O ha
-1 led to its
maximum value (87.41 kg ha-1 (kg K 2O ha
-1)-1). All treatments were economically viable,
and the most profitable months were May, April, December and November.
Adubação potássica aplicada
por diferentes métodos na cultura da abobrinha
R E S U M O
Objetivando-se, com este trabalho, avaliar o efeito de doses de potássio aplicadas pelo método convencional e por fertirrigação na abobrinha (Cucurbita pepo L.) em um experimento em Fortaleza, Ceará. O delineamento estatístico foi o de blocos ao acaso, com quatro repetições, em esquema fatorial 4 x 2, sendo quatro doses de K (0, 75, 150 e 300 kg K2O ha-1) e dois métodos de adubação (convencional e fertirrigado).
Avaliaram-se massa do fruto (MF) número de frutos (NF), comprimento do fruto (CF) diâmetro do fruto (DF), espessura da polpa (EP), sólidos solúveis (SS), produtividade (PROD), eficiência de uso da água (EUA) e do potássio (EUK) e análise econômica, por meio do valor presente líquido (VPL), taxa interna de retorno (TIR) e período “payback”. As doses de K influenciaram a MF, o DF, a EP e a PROD, que cresceram linearmente, com o maior valor estimado em 36.828 kg ha-1, relativo à maior dose de K (300 kg ha-1);
esta dose também foi responsável pela maior EUA de 92 kg ha-1 mm-1. A EUK apresentou
comportamento quadrático com a dose de 174 kg ha-1 de K
2O proporcionando um valor
máximo de (87,41 kg ha-1 (kg K 2O ha
-1)-1). Todos os tratamentos foram economicamente
viáveis sobressaindo os meses de maio, abril, dezembro e novembro como os mais rentáveis.
Key words: Cucurbita pepo L. KCl
fertigation
Palavras-chave: Cucurbita pepo L. KCl
fertirrigação
1 Instituto Federal de Educação, Ciência e Tecnologia do Ceará. Iguatu, CE. E-mail: [email protected] (Corresponding author)
2 Universidade Federal do Ceará/Centro de Ciências Agrárias/Departamento de Engenharia Agrícola. Fortaleza, CE. E-mail: [email protected];
[email protected]; [email protected]
3 Instituto INOVAGRI. Fortaleza, CE. E-mail: [email protected]
4 Instituto Federal de Educação, Ciência e Tecnologia do Piauí. Campo Maior, PI. E-mail: [email protected]
Introduction
Zucchini (Cucurbita pepo L.), known in Brazil as ‘abóbora de moita’, ‘abobrinha italiana’ and ‘abobrinha de tronco’ (Filgueira, 2012), is a plant from the Cucurbitaceae family, cultivated in all regions of Brazil and one of the ten vegetables with highest economic value and internal production (Couto et al., 2009). Its exploitation occurs in small farms with family labor, which contributes to maintaining farmers in rural areas and stimulates the generation of job and income (Costa et al., 2015).
In the state of Ceará, the conjunctural analysis of the Central Supply Company (CEASA) indicates that the commercialization of zucchini has increased, with mean volume of 383.7 t year-1 in the last two years, moving a mean value of R$ 438,250.02 year-1 (CEASA/CE, 2015).
In the cultivation of vegetables, special attention should be paid to potassium (K), since it is the macronutrient most extracted by the majority of these crops (Araújo et al., 2012). Silva et al. (2013) observed that K was the nutrient absorbed in largest amount by pumpkin. The same occurred with other cucurbits, such as melon (Silva Júnior et al., 2006) and watermelon (Almeida et al., 2012; Nogueira et al., 2014).
K can be applied through the conventional method, which consists in applying the fertilizer in the planting row directly in the soil, or through the fertigation technique, which has substituted the traditional form of fertilizer application in irrigated crops (Sousa et al., 2013). Fertigation has allowed the optimization in the use of fertilizers in different irrigated crops, with improvements in both yield and quality of the obtained products, and its adoption is more notable in crops irrigated by localized irrigation systems (Oliveira & Villas Bôas, 2008). Therefore, this study aimed to evaluate the effect of K doses applied via drip fertigation and the conventional way on the zucchini crop.
Material and Methods
The experiment was conducted from September to November 2013, in the experimental area of the Weather Station of the Federal University of Ceará (UFC), located in the municipality of Fortaleza, CE, Brazil (3º 44’ S; 38º 33’ W; 19.5 m)
According to Köppen’s classification, the climate in the region is Aw’, rainy tropical, with predominant rains in the summer-autumn. The monthly mean data of climatic variables during the experimental period are shown in Table 1.
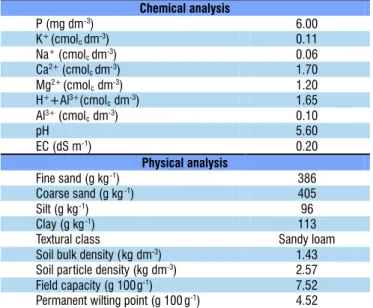
The soil in the experimental area is Red Yellow Argisol, according to the classification proposed by EMBRAPA (2006), and its chemical and physical characteristics are shown in Table 2.
The statistical design used in the experiment was a randomized block, with four blocks, in a 4 x 2 factorial scheme, which corresponded to four K doses (0 - control; 75, 150 and 300 kg K2O ha-1, corresponding to half the recommended dose, recommended dose and twice the recommended dose, respectively) and two fertilization methods (conventional and fertigation). In conventional fertilization, the three K2O doses
were divided into two applications, one third as basal and two thirds as top-dressing, 15 days after sowing (DAS), according to Filgueira (2012). For fertigation, which was intended to last for the entire crop cycle, K2O doses were divided into nine equal portions, weekly applied, with the first one at 7 DAS.
The experimental plot had an area of 3.6 m2 (3.6 x 1.0 m) and was composed of 6 plants at spacing of 1.0 x 0.6 m, totaling a population of 16,666 plants ha-1. The zucchini crop, hybrid ‘Corona F1’, was installed through direct sowing in the soil.
The quantification of the fertilizers was performed according to the analysis of the soil of the experimental area (Table 2), based on the recommendations proposed by Filgueira (2012). The doses of nutrients and commercial sources used were: 140 kg ha-1 of nitrogen (N) (urea - 45% of N); 300 kg ha-1 of phosphorus (P) (single superphosphate - 18% of P
2O5) and 2 kg ha-1 of boron (B) (boric acid - 17% of B). The applied amount of K varied according to each treatment and its source was potassium chloride (60% of K2O).
A drip irrigation system was used, with one lateral line per plant row. Each 3.6 m long lateral line was spaced by 1.0 m and composed of polyethylene tube with drippers spaced at 0.6 m, with flow rate of 4 L h-1. Irrigations, estimated according to Penman-Monteith FAO, were daily performed and the total evapotranspiration along the experiment was equal to 399 mm and the applied irrigation depth to 388 mm.
The following variables were analyzed after harvests: fruit mass (FM), number of fruits (NF), fruit length (FL), fruit diameter (FD), pulp thickness (PT), soluble solids (SS) and yield (Y).
Table 1. Monthly mean data of climatic variables along the experiment, Fortaleza-CE, Brazil, 2013
Month Air temperature (ºC)
Relative air humidity (%)
Wind speed (m s-1)
Rainfall EToPM (mm)
September 27.1 64 4.4 16.7 5.96
October 27.5 75 4.5 10.1 6.08
November 27.5 68 4.3 5.7 5.76
Mean 27.4 69 4.4 10.83 5.93
Source: Weather Station of the Federal University of Ceará
Table 2. Soil chemical and physical attributes in the experimental area, in the layer of 0-0.20 m
Chemical analysis
P (mg dm-3) 6.00
K+(cmolcdm-3) 0.11
Na+(cmolcdm-3) 0.06
Ca2+(cmolcdm-3) 1.70
Mg2+(cmolcdm-3) 1.20
H++Al3+(cmolcdm-3) 1.65
Al3+(cmolcdm-3) 0.10
pH 5.60
EC (dS m-1) 0.20
Physical analysis
Fine sand (g kg-1) 386
Coarse sand (g kg-1) 405
Silt (g kg-1) 96
Clay (g kg-1) 113
Textural class Sandy loam
These variables were subjected to analysis of variance by F test (p < 0.01 and p < 0.05) and, when significant effect was observed, subjected to regression analysis using the programs Microsoft Office Excel 2010 and Assistat 7.7.
Water use efficiency (WUE) was calculated using Eq. 1.
Results and Discussion
According to the results in Table 3, K doses significantly influenced fruit mass and yield (p < 0.01), as well as fruit diameter and pulp thickness (p < 0.05). However, there was no significant effect of fertilization methods or the interaction between methods and K doses on any of the studied variables.
Similar to the result of the present study, Genuncio et al. (2010), in an experiment with the tomato crop, also observed that the supply of K2O did not influence the content of soluble solids of the fruits. These authors claim that the effects of K supply on sensorial and fruit quality parameters may vary in response to the different environmental conditions, as well as to the amplitude of the evaluated K2O doses, which corroborates the results of Araújo et al. (2012), who also did not observe significant effect of K dose on fruit length or number of fruits of squash (hybrid ‘Mirian’).
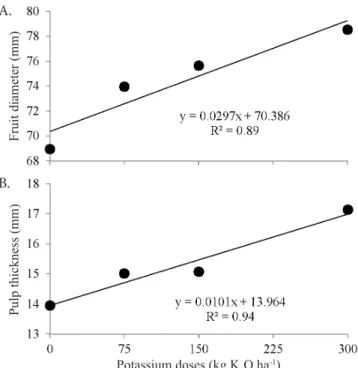
Figures 1A and 1B show the responses of zucchini fruit diameter and pulp thickness as a function of K doses, respectively; for both variables, an increasing linear model was the most adequate, with coefficients of determination (R2) of 0.89 and 0.94, respectively. The highest values obtained in the field for the variables were 78.55 mm for FD and 17.14 mm for PT, both referring to the highest K dose applied, 300 kg ha-1. Y
WUE W =
where:
WUE - water use efficiency, kg ha-1 mm-1; Y - crop yield, kg ha-1; and,
W - total water depth applied along the cycle, mm.
Potassium use efficiency (KUE) was calculated using Eq. 2:
t 0
t
Y Y KUE
K − =
where:
KUE - potassium use efficiency, kg ha-1 (kg K 2O ha
-1)-1;
Yt - zucchini yield, kg ha-1, in the treatment ‘t’; Y0 - zucchini yield, kg ha-1, in the control treatment; and, Kt - amount of K2O, kg ha-1, in the treatment ‘t’.
The economic analysis was performed based on the following indicators: net present value (NPV), internal rate of return (IRR) and payback period (PP). For this, an estimated cash flow was built for the period of five years in order to analyze the economic variability of the exploitation of the crop under irrigation regime in the studied region, taking into account the costs with crop production, the costs of property and equipment, and the obtained revenues, which were calculated using the yields estimated as a function of the treatments imposed on the crop, for one hectare cultivated with two annual cycles.
The prices of inputs and equipment were obtained in agricultural stores of Fortaleza, CE, in September 2013. The price of 1 kg of zucchini used in the calculations was equal to 60% of that practiced in the purchase by the CEASA traders of Fortaleza-CE, in November 2013.
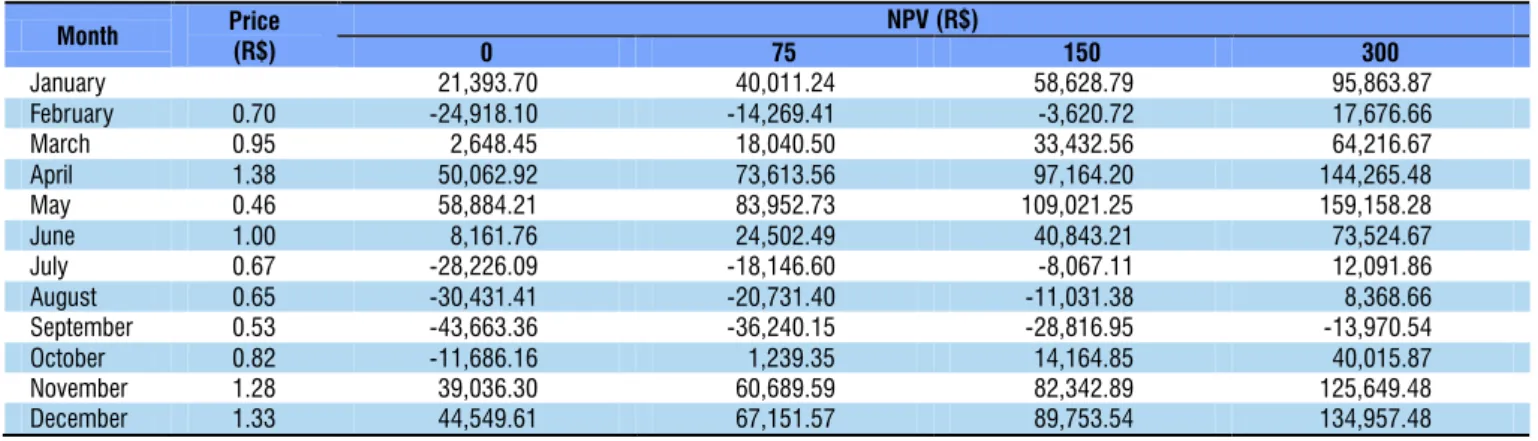
Because of the monthly variation in fruit sale prices, the net present value (NPV) was also calculated for all months of the year, in order to determine the months in which farmers can achieve greater profitability.
**Significant at 0.01 by F test; *Significant at 0.05 by F test; nsNot significant by F test;
SV - Source of variation; DF - Degree of freedom
SV DF Mean square
FM NF FL FD PT SS Y
Methods (M) 1 27,632ns 0.32ns 7.58ns 80.31ns 1.61ns 0.04ns 3,952,315ns Doses (D) 3 120,472** 0.31ns 7.36ns 129.42* 14.26* 0.08ns 345,773,901** M x D 3 5,684ns 0.05ns 1.09ns 19.46ns 0.86ns 0.007ns 7,781,600ns Blocks 3 43,258** 0.42ns 8.83ns 120.11* 14.14* 0.05ns 253,096,491**
Residual 21 8,618 0.14 3.21 28.45 2.94 0.08 26,167,827
Total 31 - - -
-CV% - 12.49 16.94 7.54 7.02 12.27 8.62 18.02
Table 3. Summary of the analysis of variance for fruit mass (FM), number of fruits (NF), fruit length (FL), fruit diameter (FD), pulp thickness (PT), soluble solids (SS) and yield (Y) of zucchini
Figure 1. Fruit diameter (FD) (A) and pulp thickness (PT) (B) of zucchini as a function of potassium doses
Potassium doses (kg K2O ha-1)
Pulp thickness (mm)
B.
Fruit diameter (mm)
A. (1)
Regarding fruit diameter, the mathematical model predicts that, for the considered interval (0 to 300 kg of K ha-1), each unit increment in K dose leads to a percent increase of 0.042% in the variable, while for pulp thickness the percent increase is 0.072%.
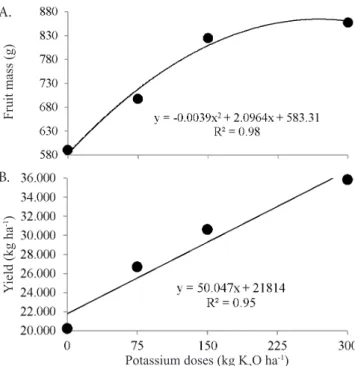
For fruit mass, the quadratic polynomial model was the most adequate to represent its behavior (R2 = 0.98) and the maximum estimated value (865.03 g) was obtained at the K2O dose of 268.77 kg ha-1 (Figure 2A). For yield, an increasing linear model fitted to the data, with R2 = 0.95, and the maximum value (35,870.61 kg ha-1) was obtained in the field for the highest K2O dose (300 kg ha-1) (Figure 2B).
Araújo et al. (2012), working with squash, obtained results higher than those of the present study (9.681 g per plant) applying a K2O dose estimated at 199 kg ha-1. On the other hand, Genuncio et al. (2010) reported significant effect (linear model) on fruit mass, in the cultivation of tomato in protected environment, for the application of K through fertigation.
The linear model obtained for yield in the present study may be associated with the large demand of vegetable crops for K, which is the macronutrient most extracted by the majority of these plants (Araújo et al., 2012), as confirmed by the studies of Silva et al. (2013), with pumpkin, Silva Júnior et al. (2006), with melon, and Nogueira et al. (2014), with watermelon.
Different from the present study, Grangeiro & Cecílio Filho (2006) observed that the yield of seedless watermelon showed a quadratic behavior in response to K doses. The maximum yield was estimated at 20,400 kg ha-1, for the K
2O dose of 183 kg ha -1. The low yields for the lowest doses of K can be explained by its importance in the plants, being vital for photosynthesis, while situations of deficiency cause reduction in the photosynthetic rate and increase in respiration, leading to decrease in the accumulation of carbohydrates (Novais et al., 2007). Another important effect of K in the plant is related to the permeability of plant cell membranes and stomatal opening/closure, so that, when there is a lack of this nutrient in the plant, the stomata do not open regularly, which causes smaller entry of carbon dioxide and, therefore, lower photosynthetic intensity, resulting in yield reduction (Malavolta, 1980; Taiz & Zeiger, 2009).
Based on the linear model of water use efficiency (WUE) and as a function of K doses (Figure 3A), the highest WUE value (92 kg ha-1 mm-1) was estimated for the highest K dose (300 kg ha-1). According to the quadratic model for K use efficiency (KUE) (Figure 3B), the estimated K2O dose of 174.29 kg ha-1 was responsible for the maximum KUE (87.81 kg ha-1 (kg ha-1)-1).
The linear response observed for WUE is explained by the linear increase in yield, since an increment in yield, maintaining the applied water depth constant leads to increase in WUE, which is proportional to the increase in yield. Therefore, both variables showed increment of 0.229% for every unit increase in K2O dose.
Analyzing WUE in the watermelon crop as a function of K doses, Oliveira et al. (2012) obtained quadratic polynomial response. Also using watermelon, Morais et al. (2008) obtained quadratic response for WUE as a function of N doses, with the highest value of 221 for 249 kg ha-1 mm-1 of N. For melon, Barros et al. (2002) estimated an optimal economic WUE of 137.7 kg ha-1 mm-1, corresponding to N fertilization dose of 195.24 kg ha-1.
With respect to KUE, a similar result was reported by Oliveira et al. (2012) for watermelon. These authors obtained quadratic responses for KUE, with maximum value of 180.6 kg ha-1 of watermelon for every kg ha-1 of K
2O applied, and claim that, from the maximum point of the curve on, there is a region denoted as non-rational for the application of the input. According to the results of the profitability indicators (Table 4), all treatments showed economic viability.
Figure 2. Fruit mass (FM) (A) and yield (Y) (B) of zucchini as a function of potassium doses
Potassium doses (kg K2O ha-1)
Y
ield (kg ha
-1)
Fruit mass (g)
B. A.
Figure 3. Water use efficiency (WUE) (A) and potassium use efficiency (KUE) (B) of zucchini as a function of potassium
doses
Potassium doses (kg K2O ha-1)
WUE (kg ha
-1 mm -1)
KUE (kg ha
-1 (kg ha -1) -1)
B. A.
Table 4. Net present value (NPV), internal rate of return (IRR) and payback period (PP) as a function of potassium doses in zucchini cultivation
Treatment Dose of K2O
(kg ha-1)
Yield (kg ha-1)
Indicators
The best economic indicators were obtained at the highest dose applied (300 kg ha-1 of K
2O), while the lowest values were observed in the control treatment, which received no K application. Therefore, it is attractive for the farmer to invest in the acquisition and application of the fertilizer, because the yield increment promoted by K application is sufficient to cover the costs with the input.
As to the monthly evaluation of NPV (Table 5), the highest economic returns were predicted for the months of May, April, December and November, in all treatments. Thus, the farmer, searching for the highest return, must schedule the planting so that the harvest is preferentially performed in the previously mentioned months, considering the phytosanitary viability of the cultivation.
Conclusions
1. The methods of potassium fertilization (fertigation and conventional) do not influence the production variables of zucchini in Red Yellow Argisol.
2. The dose of 300 kg ha-1 of K
2O promotes the highest yield (36,828 kg ha-1) of zucchini.
3. The highest value of water use efficiency (92.35 kg ha-1 mm-1) was obtained by the highest dose tested (300 kg ha-1 of K2O), while the potassium use efficiency showed maximum value of 87.41 (kg ha-1 (kg K
2O ha
-1)-1) at the optimal dose of 174.29 kg ha-1 of K
2O.
4. All treatments are economically viable for the agricultural exploitation of zucchini and the best indicators were observed for the treatment with application of 300 kg ha-1 of K
2O. 5. The farmer must schedule the sowing so that the harvests are preferentially performed in the months of May, April, December and November, considering the phytosanitary viability of the cultivation.
Literature Cited
Almeida, E. I. B.; Corrêa, M. C. de M.; Nóbrega, G. N.; Pinheiro, E. A. R.; Lima, F. F. Crescimento e marcha de absorção de macronutrientes para a cultivar de melancia Crimson Sweet. Revista Agro@mbiente, v.6, p.205-214, 2012.
Araújo, H. S.; Quadros, B. R. de; Cardoso, A. I. I.; Corrêa, C. V. Doses de potássio em cobertura na cultura da abóbora. Pesquisa Agropecuária Tropical, v.42, p.469-475, 2012. http://dx.doi. org/10.1590/S1983-40632012000400004
Barros, V. da S.; Costa, R. N. T.; Aguiar, J. V. de. Função de produção da cultura do melão para níveis de água e adubação nitrogenada no vale do Curu-CE. Irriga, v.7, p.98-105, 2002. http://dx.doi. org/10.15809/irriga.2002v7n2p98
CEASA/CE - Centrais de Abastecimento do Ceará S.A. Análise conjuntural. 2015. <http://www.ceasa-ce.com.br/index.php/ analise-conjuntural>. 20 Abr. 2015.
Costa, A. R. da; Rezende, R.; Freitas, P. S. L. de; Gonçalves, A. C. A.; Frizzone, J. A. A cultura da abobrinha italiana (Cucurbita pepo
L.) em ambiente protegido utilizando fertirrigação nitrogenada e potássica. Irriga, v.20, p.105-127, 2015. http://dx.doi.org/10.15809/ irriga.2015v20n1p105
Couto, M. R. M.; Lúcio, A. D.; Lopes, S. J.; Carpes, R. H. Transformações de dados em experimentos com abobrinha italiana em ambiente protegido. Ciência Rural, v.39, p.1701-1707, 2009. http://dx.doi. org/10.1590/S0103-84782009005000110
EMBRAPA - Empresa Brasileira de Pesquisa Agropecuária. Sistema brasileiro de classificação de solos. 2.ed. Rio de Janeiro: Embrapa Solos, 2006. 306p.
Filgueira, F. A. R. Novo manual de olericultura. 3. ed. Viçosa: UFV, 2012. 421p.
Genuncio, G. C.; Silva, R. A. C.; Sá, N. M; Zonta, E.; Araújo. A. P. Produção de cultivares de tomateiro em hidroponia e fertirrigação sob razões de nitrogênio e potássio. Horticultura Brasileira, v.28, p.446-452, 2010. http://dx.doi.org/10.1590/S0102-05362010000400012
Grangeiro, L. C.; Cecílio Filho, A. B. Características de produção de frutos de melancia sem sementes em função de fontes e doses de potássio. Horticultura Brasileira, v.24, p.451-454, 2006. http:// dx.doi.org/10.1590/S0102-05362006000400011
Malavolta, E. Elementos de nutrição mineral de plantas. 23.ed. São Paulo: Agronômica Ceres. 1980. 253p.
Morais, N. B. de; Bezerra, F. M. L.; Medeiros, J. F. de; Chaves, S. W. P. Resposta de plantas de melancia cultivadas sob diferentes níveis de água e de nitrogênio. Revista Ciência Agronômica, v.39, p.369-377, 2008.
Nogueira, F. P.; Silva, M. V. T. da; Oliveira, F. L. de; Chaves, S. W. P.; Medeiros, J. F. de. Crescimento e marcha de absorção de nutrientes da melancieira fertirrigada com diferentes doses de N e K. Revista Verde de Agroecologia e Desenvolvimento Sustentável, v.9, p.35-42, 2014.
Novais, R. F.; Venegas, V. H. A.; Barros, N. F. de; Fontes, R. L.; Cantarutti, R. B.; Neves, J. C. L. Fertilidade do solo. Viçosa: Sociedade Brasileira de Ciência do Solo, 2007. 1017p.
Month Price
(R$)
NPV (R$)
0 75 150 300
January 21,393.70 40,011.24 58,628.79 95,863.87
February 0.70 -24,918.10 -14,269.41 -3,620.72 17,676.66
March 0.95 2,648.45 18,040.50 33,432.56 64,216.67
April 1.38 50,062.92 73,613.56 97,164.20 144,265.48
May 0.46 58,884.21 83,952.73 109,021.25 159,158.28
June 1.00 8,161.76 24,502.49 40,843.21 73,524.67
July 0.67 -28,226.09 -18,146.60 -8,067.11 12,091.86
August 0.65 -30,431.41 -20,731.40 -11,031.38 8,368.66
September 0.53 -43,663.36 -36,240.15 -28,816.95 -13,970.54
October 0.82 -11,686.16 1,239.35 14,164.85 40,015.87
November 1.28 39,036.30 60,689.59 82,342.89 125,649.48
December 1.33 44,549.61 67,151.57 89,753.54 134,957.48
Oliveira, M. V. A. M.; Villas Bôas, R. L. Uniformidade de distribuição do potássio e do nitrogênio em sistema de irrigação por gotejamento. Engenharia Agrícola, v.28, p.95-103, 2008. http:// dx.doi.org/10.1590/S0100-69162008000100010
Oliveira, P. G. F. de; Moreira, O. da C.; Branco, L. M. C.; Costa, R. N. T.; Dias, C. N. Eficiência de uso dos fatores de produção água e potássio na cultura da melancia irrigada com água de reuso. Revista Brasileira de Engenharia Agrícola e Ambiental, v.16, p.153-158, 2012. http://dx.doi.org/10.1590/S1415-43662012000200004 Silva, M. V. T. da; Lima, R. M. de S.; Chaves, S. W. P.; Medeiros, A. M. A. de; Silva, N. K. C.; Oliveira, F. L. de. Diagnose foliar da abóbora submetida a diferentes níveis de salinidade e doses crescentes de nitrogênio. Agropecuária Científica no Semiárido, v.9, p.118-125, 2013.
Silva Júnior, M. J.; Medeiros, J. F. de; Oliveira, F. H. T. de; Dutra, I. Acúmulo de matéria seca e absorção de nutrientes de meloeiro “pele de sapo”. Revista Brasileira de Engenharia Agrícola e Ambiental, v.10, p.364-368, 2006. http://dx.doi.org/10.1590/ S1415-43662006000200017
Sousa, G. G. de; Azevedo, B. M. de; Oliveira, J. R. R. de; Mesquita, T. de O.; Viana, T. V. de A.; Gomes do Ó, L. M. Adubação potássica aplicada por fertirrigação e pelo método convencional na cultura do amendoim. Revista Brasileira de Engenharia Agrícola e Ambiental, v.17, p.1055-1060, 2013. http://dx.doi.org/10.1590/ S1415-43662013001000005