© FECAP
DOI: 10.7819/rbgn.v16i52.1686 Subject Area: Marketing
RBGN
The predictors of sales performance: a study with wholesale sellers
Os Fatores Preditores do Desempenho de Vendas: um estudo com vendedores
atacadistas
Factores predictores del desempeño en ventas: un estudio con los vendedores al
por mayor
Paulo Henrique Donassolo1
Celso Augusto de Matos2
Received on June 27, 2013 / Approved on October 8, 2014 Responsible editor: João Maurício Gama Boaventura, PhD. Evaluation process: Double Blind Review
1. Master in Management from University of Vale do Rio dos Sinos (Unisinos). [[email protected]] 2. Doctor in Management from Federal University of Rio Grande do Sul (UFRS). [[email protected]]
Authors’ address: School of Advertising and Marketing – South Unit (ESPM-Sul). Unit: School of Management Department: Management
Rua Guilherme Schell, 350, CEP: 90640-040 – Porto Alegre – RS – Brazil ABSTRACT
Understanding which factors influence sales performance and how these factors vary in different contexts is essential both for managers and for researchers in the field of sales and marketing. Several studies have sought to identify the factors that exert most influence over the performance of salespeople. The importance of these factors may vary according to product type and the context in which sales are made. This paper seeks to test a model that consolidates a number of factors that influence sales performance of salespeople. In order to achieve these objectives, this paper addresses various models validated in other sales contexts and selects one of these to later test it by means of a descriptive study based on a survey conducted with 301 outside salespeople linked to wholesale companies located in different states of Brazil. The results obtained from the survey supported the adequacy of the model, which presented good fit
indexes. The relationship between Self-efficacy, Effort and Performance has been confirmed and proved to be the main way that influences the performance of the salespeople. Both the academic and the managerial implications of these tests are presented and discussed in this paper.
Keywords: Sales. Salespeople. Wholesale. Performance. Survey.
RESUMO
que as vendas são realizadas. Este trabalho tem por objetivo testar um modelo que consolida diversos fatores influenciadores do desempenho do vendedor. Para atingir seus objetivos, este estudo revisa diversos modelos validados em outros contextos de vendas e realiza a escolha de um deles para, posteriormente, testá-lo por meio de uma pesquisa descritiva, baseada em uma survey realizada com 301 vendedores externos vinculados a empresas atacadistas localizadas em diversos estados do Brasil. Os resultados obtidos na pesquisa indicam a adequação do modelo testado, com bons índices de ajustamento. A relação entre Autoeficácia, Esforço e Desempenho foi confirmada, e demonstrou ser o principal caminho que influencia o Desempenho. As implicações dessas análises, tanto acadêmicas quanto gerenciais, são discutidas e apresentadas no presente trabalho.
Palavras-chave: Vendas. Vendedores. Atacado.
Desempenho. Survey.
RESUMEN
La comprensión de los factores que influyen en el desempeño del vendedor y cómo estos factores varían en los diferentes ámbitos es crucial tanto para los administradores como para los investigadores en ventas y marketing. Diferentes estudios tratan de identificar cuáles son los factores que más influyen en el desempeño del vendedor. La importancia de estos factores puede variar de acuerdo con el tipo de producto y el contexto en el que se realizan las ventas. Este estudio trata de probar un modelo que consolida varios factores que influyen en el desempeño del vendedor. Para lograr sus objetivos, este estudio examina varios modelos validados en otros ámbitos de ventas y realiza la elección de uno de ellos para luego probarlo través de un estudio descriptivo basado en una encuesta realizada a 301 proveedores externos vinculados a empresas mayoristas ubicadas en varios estados de Brasil. Los resultados obtenidos en esta investigación indican la idoneidad del modelo probado con buenos niveles de ajuste. Se confirmó y demostró que la relación entre la autoeficacia, el estrés y el desempeño es la principal forma de influencia en el desempeño. Las implicaciones de estos análisis,
académicos y administrativos se presentan y analizan en este documento.
Palabras clave: Ventas. Vendedores. Mayoristas. Desempeño. Encuesta.
1 INTRODUCTION
The context related to personal sales
environment is being consistently changed over
time. Many of such changes might be motivated
by a higher level of customers’ demand, because
they do not only want products, but rather wish
solutions for their problems (
Ingram et al., 2008).
Verbeke, Dietz and Verwaal (2011) state that
in the current knowledge economy customers
are increasingly informed, which poses higher
challenges to the salespeople, who should transfer
knowledge to their customers.
The major challenge thus posed to the companies’ business areas is to build up and keep relationships with customers, especially with those with better sales and profits generating potential (Ingram et al., 2008), and where such relationship might be transformed into competitive edge (CANON, PERREAULT JR., 1999). The buildup of relationships is fundamental to compete in the current world, and to that end, the company relies on salespeople (JARAMILLO, MULKI, 2008).
amongst authors studying the topic about how to define or measure such performance, especially about which main factors influence salespeople’s performance.
Therefore, this study aims to test a model of the main factors influencing sales’ performance, based on the study by Krishnan, Netemeyer, and Boles (2002). This study goes forward in relation to the previous one in testing self-efficacy and effort variables as constructs of second order, measured from latent factors already identified in literature, but in an isolated manner. Only the most recent study by Verbeke, Dietz, and Verwaal (2011) summarizes such factors, but the authors have based on a systematic review of literature. This study is based on primary data collected from salespeople of the Brazilian wholesale companies’ business area. The wholesale segment is an important link between the retailer and the manufacturer, and therefore it is important to understand how wholesale salespeople vary in terms of sales performance, and which factors might be associated to such variation.
2 BACKGROUND OF SALES’ PERFORMANCE
What are the main influencers or background of performance, and how the salespeople’s performance should be measured are topics with little consensus amongst the authors researching such topics. In the beginning of this field theoretical development, the discussion was oriented towards the measurement of constructs, and in this regard the study by Churchill Jr., Ford, and Walker Jr. (1974) have contributed to develop and propose a scale to measure the satisfaction with industrial salespeople’s work, which became known as INDSALES scale. Such authors though recognize that the relation between satisfaction with the work and the salespeople’s performance is not direct, and intervening variables might help to better understand the sales’ performance.
Subsequently, authors such as Walker Jr., Churchill Jr., and Ford (1977) suggest that the salespeople’s performance is influenced by factors
they can control: (1) the perception of their role, and on which activities they should be performed in order to obtain the desired performance; (2) the motivation influencing the amount of efforts used in performing the sales activities; and (3) the skill, which is the quality of such effort. Churchill Jr. et al. (1985), in their meta-analysis, classify the background of performance in increasing order of importance: personal factors, organizational and environmental factors; motivation; aptitude; levels of skills, and the perception of their role within the organization and within the sales process. Subsequently, the meta-analysis conducted by Verbeke, Dietz, and Verwaal (2011) shows the ambiguity of roles (r = -0.25, p < 0.05), the cognitive aptitude (r = 0.23, p < 0.05), the involvement in the work (r = 0.23, p < 0.05), the degree of adaptability (r = 0.27, p < 0.05), and the sales-related knowledge (r = 0.28, p < 0.05) as the main influencers of salespeople’s performance.
We can also see in those studies the
authors’ preference in using factors such as the
effort (BAGOZZI, 1980; JARAMILLO, MULKI,
2008) and sales skills (BEHRMAN, PERREAULT
JR., 1984; SUJAN, WEITZ, KUMAR, 1994;
KOHLI, SHERVANI, SHALLAGALLA, 1998;
MATSUO, KUSUMI, 2002; WACHNER,
PLOUFFE, GRÉGOIRE, 2009) and self-efficacy
(JAWORSKI, KOHLI,
1991; KRISHNAN, NETEMEYER, BOLES, 2002) in the pursuit to
understand which are the factors influencing the
salespeople’s performance.
data are not much divergent when used as source of salespeople’s performance appraisal.
In the path of the salespeople’s self-efficacy, as a way of analyzing their own performance, Krishnan, Netemeyer, and Boles (2002) defend that the evaluation is related to the performance perception as for their sales in terms of value, of the quality of their relationship with customers, and the knowledge the salespeople have about products, market, competitors, and customers’ needs.
Sujan, Weitz, and Kumar (1994), and
Wachner, Plouffe, and Grégoire (2009) use
self-efficacy of salespeople in relation to the
performance of their colleagues in regard to the
fulfillment of quantitative and qualitative goals.
Behrman and Perreault Jr. (1984) state that
the sales performance can only be defined by
considering a long term horizon, and using a high
level of abstraction. Brown and Peterson (1994)
add the evaluation of managers of skills and results
obtained by the salespeople.
Chart 1 shows the summary of the works of main authors used in this work.
CHART 1 – Summary of main studies on sales performance
Sujan, Weitz, and Kumar (1994)
Krisnhan, Netemeyer, and Boles (2002)
Jaramillo & Mulki (2008)
Wachner, Plouffe, and Grégoire (2009) Influencers Skills; the orientation
towards performance or towards learning: Feedback Working Hard; Working Smart.
Self-efficacy Competitiveness Effort
The Effort is influenced by the Leadership style, the Customers’ demands, and the intrinsic motivation.
Sales skills:
Sales Orientation × Client Orientation
Measurement Self-efficacy of quantitative and qualitative goals
Self-efficacy on the sales result, the quality of the relationship with customers, and the quality of performance
Self-efficacy on their performance on performing sales activities
Self-efficacy when comparing their performance with their peers’ performance in items such as how to make more profitable sales, exceed the sales goals, etc.
Moderators Self-efficacy Not used. Not used. Sales skills
Technical knowledge
Control Not used. Not used. Experience
Extrinsic motivation
Age Gender Sales experience Source: The authors
According to Krishnan, Netemeyer, and Boles (2002), previous studies on factors influencing salespeople’s performance generally use a single analysis factor, such as the influence of leadership on the salespeople’s guidance, or the knowledge and technical capacities of the salespeople. This study format, according to them, is not ideal – it leaves a gap, since it considers a factor alone, disregarding the others. The authors have then proposed in their study a model that consolidates several factors under three constructs: Self-efficacy, Competitiveness and Effort, as
FIGURE 1 – The model of Krishnan, Netemeyer, and Boles (2002)
Source: Krishnan, Netemeyer, and Boles (2002, p.287)
Note: the relation between self-efficacy and competitiveness is of correlation.
2.1 Competitiveness
Competitiveness is one of the main features
of successful salespeople, being defined as the set of
individual differences regarding the performance
of interpersonal relations. The competition and
the desire to win or to be better than the others
(
SPENCER;, HELMEREICH, 1983 apud KRISHNAN, NETEMEYER, BOLES, 2002)
or the need for interpersonal competition, the
desire to win and to be better than the others
(BREWER, 1994) are the pleasure obtained by
competing with other salespeople, and the desire
to exceed then in performance (
KRISHNAN, NETEMEYER, BOLES, 2002), which affects the
effort of the salespeople (LOCKE, 1968), and is
a feature of the individual which pushes him/her
in the path of victory (BROWN, PETERSON,
1994).
In their work, Krishnan, Netemeyer, and
Boles (2002) highlight that some authors such
as Schwepker Jr. and Ingram (1994), and Brown
and Peterson (1994), have found positive and
significant influence of the competitiveness on
performance, while others, such as Locke (1968),
have noticed that the effect of the competitiveness
on performance does not takes place directly, but
rather through the effort. This indirect influence
takes place within the understanding that the
higher the competitiveness the higher the effort,
and consequently the better the performance
(LOCKE, 1968). Krishnan, Netemeyer, and
Boles (2002) in their model have decided to use
the conclusions of Locke (1968), considering the
direct influence of the competitiveness on the
salespeople’s effort. Based on that, in this work
the following hypotheses are proposed:
H1a – The salespeople’s competitiveness is
positively correlated to their auto-efficacy.
H1b
– The salespeople’s competitiveness
positively influences their effort.
2.2 Self-efficacy
results in a better performance (
KRISHNAN, NETEMEYER, BOLES,2002).
The self-efficacy can manifest with different
faces: skills, knowledge, orientation towards the
customer, and orientation towards learning.
Sales skills are a valuable resource to companies,
since salespeople have a key role in building
up relationships with customers
(BEHRMAN, PERRAULT, 1984). Sales skills, as other forms of tacit knowledge, tend to improve with time with salespeople acquiring experience, i.e., the “learning by doing”(
HITT et al.,2001). Three
components can be considered within sales skills:
interpersonal relationship skill, specific sales
skills, and technical skills (RENTZ et al., 2002).
Menguc and Barker (2005) though have not
found the relation between sales skills and superior
performance of the sales team, and they consider
that this is due to the socially complex nature of
the construct skills.
On the other hand, knowledge refers to
expertise in sales, and can even be regarded as
one of the sales skills components (MENGUC,
BARKER, 2005). In this study though knowledge
and skills are regarded as independent constructs,
for the fact of “skills” being a broader factor that
encompasses also interpersonal relationship skills.
Weitz, Sujan, and Sujan (1986) state that good and bad salespeople have different knowledge bases.
The
type of orientation of
the salespeople
directly influences their working manner,
according to
Sujan, Weitz, and Kumar (1994). An orientation towards learning motivates salespeople to develop their skills.This makes them search for
challenging work situations, in the belief that this
will help them developing their understanding
about several sales environments, and to improve
their knowledge on the most appropriate strategies
for each sales situation. On the other hand,
salespeople oriented towards performance have a
shorter term vision and, if the learning does not
provide them with immediate results, they lose
interest on it.
Furthermore, salespeople more oriented towards the customer show a genuine desire to help customers and prospects, helping them in evaluating customers’ needs, offering them
proper products and solutions, supporting them in making satisfactory sales decisions, possibly even sacrificing immediate gains in benefit of establishing or maintaining a long term relationship (SAXE, WEITZ, 1982).
Considering the construct self-efficacy, in general, review studies of the meta-analysis type, such as the study by Stajkovic and Luthans (1998), demonstrate that self-efficacy is a critical driver of the employee’s actions.
Therefore, based on previous considerations,
we propose the following hypotheses:
H2b
– The salespeople’s self-efficacy
positively influences their effort.
H2b
– The salespeople’s self-efficacy
positively influences their performance.
2.3 Effort
Effort can be defined as being the amount of time and energy the salespeople invests in sales activities (RANGAJARAN, JONES; CHIN, 2005) when compared to other salespeople of his/her team or of other company, and this effort directly affects his/her performance (KRISHNAN, NETEMEYER, BOLE,, 2002). Ingram, Lee, and Skinner (1989) state that the effort is under the control of the salespeople, but the result of such effort is not.
Coherently, Sujan,
Weitz, and Kumar (1994) identify that salespeople
oriented towards result work with higher effort.
The effort can manifest in the Working
Hard dimension, when related to the persistency
and intensity of the energy used (SUJAN, 1986), being the measurement of time dedicated to the sales work
(SUJAN, WEITZ; KUMAR, 1994).
In turn, the
Working Smart dimension refers to the efficiency in allocating their energy, i.e., to know to identify which activities are aligned with the goals (SUJAN, 1986;SUJAN, WEITZ,
KUMAR, 1994).
recognition (BEHRMAN; PERREAULT JR., 1984; JAWORSKI; KOHLI, 1991). Salespeople also seek for a positive evaluation about their skills on the part of colleagues and chiefs (SUJAN; WEITZ; KUMAR, 1994), and this evaluation is performed through the feedback.
Therefore, the effort can manifest in the intense work of the salesperson, in the efficiency and efficacy of using his/her time and resources, in the clear results expected from the salesperson, and in the salesperson capacity of accepting the feedback. As discussed by Krishnan, Netemeyer, and Boles (2002), although it seems obvious to suggest that the higher the salesperson effort, the better his/her performance will be, few empiric researches have tested this assumption. Among
these studies, Brown and Peterson (1994) have found a positive and significant effect of the effort on performance. Therefore, based on such discussions, we propose the following:
H3
– Effort positively influences the
salesperson’s performance.
3 CONCEPTUAL MODEL
Using the model by Krishnan, Netemeyer, and Boles (2002), as base, the conceptual model developed was presented in this work, and is represented by Figure 2.
FIGURE 2 – Conceptual model
Source: Adapted from Krishnan, Netemeyer, and Boles (2002)
Self-efficacy is defined as the confidence the individual has on him/herself and on his/ her skills to perform given sales tasks. In this
knowledge and orientation towards the customer and/or market, the scales adapted from Wachner, Plouffe, and Grégoire (2009) were used; and for orientation towards result or orientation towards learning, the scales adapted from Kohli, Shervani, and Challagalla (1998) were used.
Performance is defined as the salesperson perception of his/her sales results, of the profits generated by his/her sales, of the overcoming of goals, and of his/her satisfaction in regard to the results obtained and the work performed. In order to obtain the salespeople self-efficacy in regard to their performance, in this work we have used the scales adapted from Wachner, Plouffe, and Grégoire (2009), Sujan, Weitz, and Kumar (1994), and Kohli, Shervani, and Challagalla (1998). In turn, Competitiveness is defined as the need of interpersonal competition, the wish to win and to be better than the others. The scales adapted from Sujan, Weitz, and Kumar (1994) were used in this work.
Effort is defined as the time and energy invested in sales activities. The following comprise this construct: the ambiguity of roles, the feedback, self-esteem, motivation, satisfaction in work, and attitude, among others. The scales adapted from Kohli, Shervani, and Challagalla (1998) were used for the salesperson orientation towards the result. For the clarity about the importance of the results and the behavior, the scale adapted from Jaworski and Kohli (1991) was used. In order to identify the degree and orientation of the salesperson effort, the scale adapted from Sujan, Weitz, and Kumar (1994) was used.
4 METHODOLOGICAL PROCEDURES
A survey type quantitative research was carried out, applied to
301 external sellers
connected to Brazilian wholesale companies. For
convenience, a non-probabilistic sampling was
used. The criteria to select surveyed companies
were the geographic location and the easy access
to sales teams. As the sample was for convenience,
sellers with different levels of experience took part
in the survey. At the end, however, 80% of the
interviewees had more than 5 years of experience
with sales (20% up to 5 years, 38% between 5 to
10 years, and 42% above 10 years).
20 wholesale companies were contacted, of
which 12 agreed on taking part of the research. Data
collection was done (1) in presence, during sales
teams meetings, by sales managers of each team,
or by people of the researcher’s confidence, and
(2) via Internet, sending the questionnaire through
e-mail to the sellers, with a link to the Google
Docs webpage, to answer such questionnaire. In
presence, 450 questionnaires were given, of which
236 or 52.4% of questionnaires were returned.
Through the internet, 870 e-mails were
sent, of which 65 were answered (7.5%), a rate
considered as low, although a study performed
with marketing professionals has had a similar rate
(5%) in Ranchhod (2001). Despite this, since the
survey already had 236 questionnaires collected in
presence, the online collection was just an extra
effort to obtain the higher number of participants
as possible, according to suggestion by Dillman
et al, (2009), the researchers have considered
sufficient, for the proposed model test, the final
sample of 301 cases (236 + 65).
were those remaining after being validated by experts, and not having problems in the pre-test phase. It is noteworthy that the reversed items maintained were re-coded in the phase of data analysis. The scales used in this work, and their respective authors, are listed in the Appendix to this work.
Data were analyzed by using the structural
equations modeling technique, which allows
the researcher to simultaneously test a set of
relationships between variables (BYRNE, 2010),
considering both the relations between latent
variables and their indicators (measurement
model), and the latent variables among each other
(structural model).
As data were collected in the presence of a
group, and electronically from another group, tests
were performed before grouping these two
sub-samples. The main test was the metrical invariance
test, as recommended in literature (GARSON,
2012). This test evaluates whether the constructs
measurement models are equivalent in both
groups. Following the steps suggested by Garson
(2012), results indicated small differences between
main adjustment indexes when comparing
the models with and without restriction (i.e.,
measurement weights
vs.
unconstrained
): CFI
u=0.79
vs. CFI
c=0.78; GFI
u=0.77 vs. GFI
c=0.76. Such
findings support the metric invariance, and
indicate that both sub-samples are equivalent and
might be grouped for the structural model testing.
The sample of 301 cases was regarded as satisfactory. Firstly, because it is above the minimum amount of 150 cases suggested by Garson (2012). For instance, according to this author, a survey with 72 studies applying SEM has found a median of 198 for the sample size. Furthermore, the study also fulfills the relation between the number of cases and the variables of the model. According to Hair et al (2009), an index equal or above 10 should be obtained. In this study, the index also met this requirement: 301/27 = 11.1.
5 DATA ANALYSIS
5.1 Profile of respondents
The age range of respondents is
concentrated between 26 and 45 years (73.4%),
with the older (0.7%) and those below 25 years
(11.6%) being the less represented. There is a
predominance of male respondents (69.8%);
regarding education background, those who
have full High School degree (35.9%) and partial
College degree (26.6%) prevail.
5.2 Appropriateness of measures
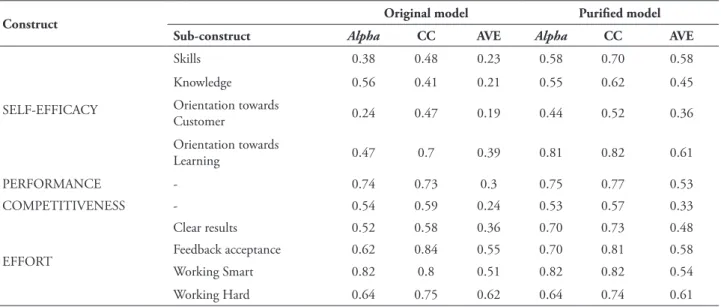
The reliability analysis was conducted in two stages: first, the original scale with all the items; subsequently, the scale purified by the confirmatory factorial analysis. The purification of scales was performed by leaving in them only the items with standardized loads above 0.60 (BAGOZZI, YI, 1988). Another procedure was to analyze the association between each item and the total scale score, with the alpha if item deleted in Statistical Package for the Social Sciences (SPSS®), excluding those items harming the scale’s alpha. In general, both procedures have converged in the identification of items to be excluded. Results are shown in Table 1.
TABLE 1 – Alpha of cronbach, composed reliability and extracted variance
Construct Original model Purified model
Sub-construct Alpha CC AVE Alpha CC AVE
SELF-EFFICACY
Skills 0.38 0.48 0.23 0.58 0.70 0.58
Knowledge 0.56 0.41 0.21 0.55 0.62 0.45
Orientation towards
Customer 0.24 0.47 0.19 0.44 0.52 0.36
Orientation towards
Learning 0.47 0.7 0.39 0.81 0.82 0.61
PERFORMANCE - 0.74 0.73 0.3 0.75 0.77 0.53
COMPETITIVENESS - 0.54 0.59 0.24 0.53 0.57 0.33
EFFORT
Clear results 0.52 0.58 0.36 0.70 0.73 0.48
Feedback acceptance 0.62 0.84 0.55 0.70 0.81 0.58
Working Smart 0.82 0.8 0.51 0.82 0.82 0.54
Working Hard 0.64 0.75 0.62 0.64 0.74 0.61
Source: The authors
In addition, it was observed that the alpha of
Cronbach and Composed Reliability values
of the construct Competitiveness have slightly
worsened in relation to the original model. Even
though, we have decided to keep the construct in
the model, since it is part of the original model
by Krishnan, Netemeyer, and Boles (2002), and
was validated in that study. As for the construct
Performance, both the alpha of Cronbach, and
the Composed Reliability and Extracted Variance
have improved after the purification of the
model, and all of them have showed satisfactory
indexes, the same occurring to the sub-constructs
of the construct Effort.
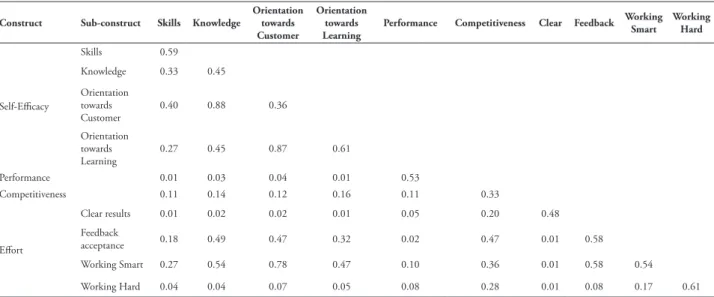
It is noteworthy that all the purified sub-constructs were kept in the final model due to the relevance of such constructs, verified in previous studies. The low indexes obtained in the alpha of Cronbach, in the Composed Reliability and in the Extracted Variance, might have been originated in the procedures adopted in the scale validation for the study context, and in the data collection process, which shall be addressed again in the discussion of the results.According to Hair et al. (2009), the discriminatory validity is the degree in which a construct is different from the others. One of the ways of analyzing the discriminatory validity is to perform a comparison between extracted
variance indexes for two any constructs and the square of the correlation (shared variance, SV) between these two constructs. The estimations of the extracted variance (EV) should be higher than the squared estimation of the correlation (SV). Table 2 shows the EV values (diagonal, in bold figures), and of the SV of the constructs.
orientation of the seller’s effort. Sujan, Weitz, and Kumar (1994) define Customer Orientation as being the orientation guiding sellers to obtain results and a positive evaluation in regard to their
capacities. Therefore, this correlation might be indicating an orientation of the seller’s efforts toward obtaining such results.
TABLE 2 – Extracted variance and shared variance between constructs
Construct Sub-construct Skills Knowledge
Orientation towards Customer
Orientation towards Learning
Performance Competitiveness Clear Feedback Working Smart
Working Hard
Self-Efficacy
Skills 0.59
Knowledge 0.33 0.45
Orientation towards Customer
0.40 0.88 0.36
Orientation towards
Learning 0.27 0.45 0.87 0.61 Performance 0.01 0.03 0.04 0.01 0.53 Competitiveness 0.11 0.14 0.12 0.16 0.11 0.33
Effort
Clear results 0.01 0.02 0.02 0.01 0.05 0.20 0.48 Feedback
acceptance 0.18 0.49 0.47 0.32 0.02 0.47 0.01 0.58 Working Smart 0.27 0.54 0.78 0.47 0.10 0.36 0.01 0.58 0.54 Working Hard 0.04 0.04 0.07 0.05 0.08 0.28 0.01 0.08 0.17 0.61
Source: The authors
5.3 Model and hypotheses testing
The model tested in this research explains 17.7% of total variance of the construct Performance. According to Churchill Jr. et al. (1985) most of the studies that evaluate the salespeople’s performance finds an index between 10% and 20% of explained variance. The model adjustment indexes can be mostly regarded as good. It is noteworthy that the AGFI, TLI, NFI, and GFI indexes have values that might be regarded only as acceptable (0.769; 0.796, 0.742, and 0.808, respectively), according to Hair et al. (2009). Still comparing the indexes regarded as acceptable, according to this author, the values obtained in the model for 2/gl = 2.813 (< 5), CFI = 0.818 (> 0.80) and RMSEA = 0.078 (< 0.08) are regarded as satisfactory.
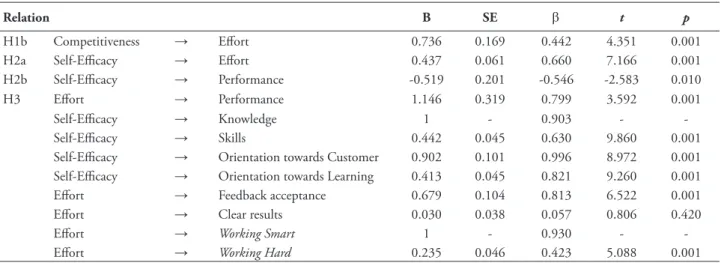
Regarding the hypotheses testing, Table 3 shows the value of standardized loads, of non-standardized loads, and of the test t and of the significance (p value) for each of the proposed relations. Of the sub-constructs that compose Self-efficacy, Knowledge is observed as the
one with higher weight in this measurement (β = 0.903), except that the sub-construct Customer Orientation is not being analyzed, because its variance had to be fixed. The Learning Orientation, with a β = 0.821, is the one with the second bigger weight on the construct Self-efficacy. As for the sub-constructs composing the Effort, it is observed that Working Smart has the bigger weight in the measurement, with
β = 0.93, followed by Feedback Acceptance with
β = 0.813; Clear Results appear with the smallest weight, β = 0.057.
and significant (sig = 0.01) influence, not supporting the H2b hypothesis, which proposes
the positive influence of SELF-EFFICACY on Performance.
TABLE 3 – Proposed paths testing
Relation B SE β t p
H1b Competitiveness → Effort 0.736 0.169 0.442 4.351 0.001
H2a Self-Efficacy → Effort 0.437 0.061 0.660 7.166 0.001
H2b Self-Efficacy → Performance -0.519 0.201 -0.546 -2.583 0.010
H3 Effort → Performance 1.146 0.319 0.799 3.592 0.001
Self-Efficacy → Knowledge 1 - 0.903 -
-Self-Efficacy → Skills 0.442 0.045 0.630 9.860 0.001
Self-Efficacy → Orientation towards Customer 0.902 0.101 0.996 8.972 0.001 Self-Efficacy → Orientation towards Learning 0.413 0.045 0.821 9.260 0.001
Effort → Feedback acceptance 0.679 0.104 0.813 6.522 0.001
Effort → Clear results 0.030 0.038 0.057 0.806 0.420
Effort → Working Smart 1 - 0.930 -
-Effort → Working Hard 0.235 0.046 0.423 5.088 0.001
Source: The authors
NOTES: B = non-standardized coefficients; β = standardized coefficients; SE = standard error; t = test t; p = test of significance.
If the direct influence of Self-efficacy on Performance, H2b hypothesis, could not be evidenced in the tests conducted, it is important to highlight that the path SELF-EFFICACY à EFFORT à PERFORMANCE (with β = 0.66 and β = 0.799, respectively) demonstrate the importance of the Self-efficacy influence on the Effort, and from the later on Performance.
The correlation between Competitiveness and Self-efficacy (0.475) is observed, evidencing the H1a hypothesis, according to the conceptual model proposed and the model by Krishnan, Netemeyer, and Boles (2002), which have found 0.30 of correlation between such constructs. In order to calculate the significance of such correlation, the re-sampling procedure (bootstraping) of the software AMOS was used. At a significance level of 0.01, the H1a hypothesis is evidenced, and the average correlation is 0.4750, with a confidence interval between 0.303 and 0.608.
6 D I S C U S S I O N O F R E S U LT S A N D CONCLUSIONS
According to Krishnan, Netemeyer, and Boles (2002), many studies on salespeople’s
performance focus on specific capacities of salespeople. Based on this research gap, this study had the objective of testing a model of the main factors influencing sales’ performance. The model was tested with a sample of salespeople from Brazilian wholesale companies.
measurement was performed in the attitudinal (perceptual) mode, this subjectivity might have been responsible for the research finding a negative relation between self-efficacy and performance. That is, it is possible that individuals evaluating themselves as more capable are more demanding in their self-evaluation, and are not so satisfied with their own performance. This measurement based on self-answer is one of the limitations of this study, and will be further discussed.
On the other hand, the positive influence of Self-efficacy on Effort - H2a hypothesis – was supported by data, in agreement with the studies by Sujan, Weitz, and Kumar (1994), Brown and Peterson (1994), and Stajkovic and Luthans (1998), that indicate that salespeople with higher self-efficacy tend to make more effort, and consequently to get a better performance. Self-efficacy is thus indirectly related to the salesperson’s performance.
The influence of effort on performance – H3 hypothesis – was evidenced by data, reinforcing the studies by Brown and Peterson (1994), and Stajkovic and Luthans (1998). The correlation between competitiveness and self-efficacy - H1a hypothesis – and the positive and direct influence between the competitiveness and effort constructs - H1b hypothesis – proposed and validated in the original model by Krishnan, Netemeyer, and Boles (2002) were equally supported by this research data.
As theoretical implications, the subject of salespeople’s performance has been broadly studied in the academic world. The meta-analysis conducted by Verbeke, Dietz, and Verwaal (2011), and Churchill Jr. et al. (1985) offer a view on the articles published between 1918 and 2008. These authors are categorical when declaring the lack of agreement among authors about which is the main factor influencing the salesperson’s performance. While, for instance, Weitz, Sujan, and Sujan (1986) state that it is knowledge, Jaworski and Kohli (1991) state it is self-efficacy. Bagozzi (1980), and Jaramillo and Mulki (2008) talk about effort, and Sujan, Weitz, and Kumar (1994), and Wachner, Plouffe, and Grégoire (2009) talk about skills. Therefore, this work
has pursued to simplify the understanding about salespeople’s performance, within the studied context, by using a model consolidating several of these influencing factors under three constructs: self-efficacy, competitiveness, and effort.
This study also highlights the importance of Knowledge, Orientation for Learning, and Working Smart, reinforcing the statement by Verbeke, Dietz, and Verwaal (2011) that we are moving in direction of an intensive knowledge economy. Therefore, managers need to recruit, select, develop, and retain more qualified salespeople to deal with the ambiguity of the role, which is incorporated to the sales work, and who have the capacity and resilience to assume the responsibility of developing, sharing and using knowledge and skills. In addition, the conclusion that the path self-efficacy à effortà performance contain the main influencers of performance, with self-efficacy having a great influence on the salesperson’s effort, might provide the manager with the best way to identify and understand the individual needs of salespeople. Thus, the sales manager might provide his/her salespeople with the necessary capacity building and development so that they can have a better performance.
Still in regard to the path self-efficacy à effortà performance, companies and sales training teams should take into considerations that salespeople feeling more confident with their skills and knowledge will more likely make more efforts in their sales activities, and such effort might generate a better performance of such salespeople. Therefore, salespeople under training should not only work on their skills, knowledge and orientation towards the customer, but also their confidence in their capacity of well executing the sales activity.
an evaluation model that can be used before the occurrence of the action. By identifying the degree of self-efficacy, competitiveness and effort of the salesperson, the manager might, for instance, adapt his/her way of working the characteristics of his/her subordinates, making they have a better performance, based on his/her influence on the salespeople.
With limitations, we can mention the use of a convenience sample of salespeople of a single sector, wholesale, which does not allow generalizing the results. Furthermore, the adaptation of the scales of original studies to the context of this research, using the back-translation technique and the validation by specialists, was done in the pursuit of keeping their integrity. The little reliability of some scales, verified when the statistical analyzes were carried out, indicates that some quality losses might have occurred, with the resulting impact on the obtained data quality, and with implications in the statistical analyzes done. The construct performance, for instance, has undergone a modification during the purification process, because the performance quality was no longer measured, and instead the salesperson’s satisfaction with his/her performance was measured, which has generated a measurement based on the respondent’s perception. The subjectivity of measurement might be another factor resulting in the little reliability of some constructs. Despite Churchill Jr. et al. (1985) stating that self-efficacy and numerical data are not very divergent when used as source of evaluation of salespeople’s performance, in this work the ascending bias of self-valuation might have occurred, and be mainly related to the construct performance.
As indications for new researches, we suggest the testing of the model considering more than one performance measurement manner, i.e., also considering the objective data of salespeople’s performance, preferably those obtained in a longitudinal study, in addition to evaluations provided by sales managers about the salesperson’s performance. By crisscrossing objective and perceptual information, more precise results about the salesperson’s performance can be obtained,
thus meeting the increasing demand of using objective data in marketing (HUANG, WANG, 2013; SABNIS, 2013).
At last, from the viewpoint that the salesperson might be responsible for the relationship between the selling company and the buying company, we suggest the conduction of studies investigating the relationship quality, and also an evaluation of the impact of the virtual market in such context. In this bias of relationship, some measures could be considered, such as the degrees of confidence and commitment of the customer with the company and the salesperson, the efficacy and expertise of the salesperson in perceiving the customer, the repurchase intention by the customer, and the intention to indicate the company and/or the salesperson to other customers.
REFERENCES
BAGOZZI, R. P. The nature and causes of self-esteem, performance, and satisfaction in the sales force: a structural equation approach. Journal of Business, Chicago, v. 53, n. 3, p. 315-331, July 1980.
______; Yi, Y. On the evaluation of structural equation models. Journal of the Academy of Marketing Science, [S. l.], v. 16, n. 1, p. 74-94, 1988.
BEHRMAN, D. N.; PERREAULT JR, W. D. A role stress model of the performance and satisfaction of industrial salespersons. Journal of Marketing, Chicago, v. 48, n. 4, p. 9-21, Autumm 1984.
BREWER, G. Mind reading: what drives top salespeople to greatness. Sales and Marketing Management, New York, v. 146, n. 5, p. 82-88, May 1994.
BROWN, S. P.; PETERSON, R. A. The effect of effort on sales performance and job satisfaction.
BYRNE, B. M. Structural equation modeling with AMOS: basic concepts, applications, and programming. 2nd ed. New York: Routledge, 2010.
CANNON, J. P.; PERREAULT JR, W. D. Buyer-seller relationships in business markets. JMR Journal of marketing research, Chicago, v. 36,
n. 4, p. 439-460, Nov. 1999.
CHURCHILL JR, G. A.; et al. The determinants of salesperson performance: a meta-analysis. JMR Journal of Marketing research, Chicago, v. 22,
n. 2, p. 103-118, Aug. 1985.
______; FORD, N. M.; WALKER JR, O. C. Measuring the job satisfaction of industrial salesmen. JMRJournal of Marketing Research,
Chicago, v. 11, n. 3, p. 254-260, Aug. 1974.
DILLMAN, D. A. et al. Response rate and measurement differences in mixed-mode surveys using mail, telephone, interactive voice response (IVR) and the Internet. Social Science Research,
San Diego, v. 38, n. 1, p. 1-18, Mar. 2009.
GARSON, G. D. Structural equation modeling.
Asheboro, NC: Statistical Associates, 2012.
HAIR, J. F. et al. Análise multivariada de dados.
6. ed. Porto Alegre: Bookman, 2009.
HITT, M. A. et al. Direct and moderating effects of human capital on strategy and performance in professional service firms: a resource-based perspective. Academy of Management Journal, Briarcliff Manor, v. 44, n. 1, p. 13-28, Apr. 2001.
HUANG, M.; WANG, E. T. G. Marketing is from Mars, it is from Venus: aligning the worldviews for firm performance. Decision Sciences, Atlanta, v. 44, n. 1, p. 87-125, Feb. 2013.
INGRAM, T. N. et al. Gerenciamento de vendas: análise e tomada de decisão. São Paulo:
Cengage Learning, 2008.
______; LEE, K. S.; SKINNER, S. J. An empirical assessment of salesperson motivation,
commitment, and job outcomes. Journal of Personal Selling & Sales Management, New York, v. 9, n. 3, p. 25-33, Fall 1989.
JARAMILLO, F.; MULKI, J. P. Sales effort: the intertwined roles of the leader, customers, and the salesperson. Journal of Personal Selling and Sales Management, New York, v. 28, n. 1, p.
37-51, Winter 2008.
JAWORSKI, B. J.; KOHLI, A. K. Supervisory feedback: alternative types and their impact on salespeople’s performance and satisfaction. JMR Journal of Marketing Research, Chicago, v. 28, n. 2, p. 190-201, May 1991.
KO H L I , A . K . ; S H E RVA N I , T. A . ; CHALL AGALL A, G. N. Learning and performance orientation of salespeople: the role of supervisors. JMRJournal of Marketing Research, Chicago, v. 35, n. 2, p. 263-274, May 1998.
KRISHNAN, B. C.; NETEMEYER, R. G.; BOLES, J. S. Self-efficacy, competitiveness, and effort as antecedents of salesperson performance. The Journal of Personal Selling & Sales Management, New York, v. 22, n. 4, p. 285-295, Fall 2002.
LOCKE, E. A. Toward a theory of task motivation and incentives. Organizational Behavior and Human Performance, [S. l.], v. 3, n. 2, p.
157-189, May 1968.
MALHOTRA, N. K. Pesquisa de marketing: uma orientação aplicada. 3. ed. Porto Alegre: Bookman, 2001.
MATSUO, M.; KUSUMI, T. Salesperson’s procedural knowledge, experience and performance: an empirical study in Japan. European Journal of Marketing, Bradford, v. 36, n. 7-8, p. 840-854, 2002.
perspective. European Journal of Marketing, Bradford, v. 39, n. 7-8, p. 885-909, 2005.
RANCHHOD, A.; ZHOU, F. Comparing respondents of e-mail and mail surveys: understanding the implications of technology.
Marketing Intelligence & Planning, Bradford, v. 19, n. 4, p. 254-262, 2001.
RANGARAJAN, D.; JONES, E.; CHIN, W. Impact of sales force automation on technology-related stress, effort, and technology usage among salespeople. Industrial Marketing Management,
New York, v. 34, n. 4, p. 345-354, May 2005.
RENTZ, J. O. et al. A measure of selling skill: scale development and validation. Journal of Personal Selling & Sales Management, New
York, v. 22, n. 1, p. 12-21, Winter 2002.
SABNIS, G. et al. The sales lead black hole: on sales Reps’ Follow-Up of marketing leads. Journal of Marketing, Chicago, v. 77, n. 1, p. 52-67, Jan. 2013.
SAXE, R.; WEITZ, B. A. The SOCO scale: a measure of the customer orientation of salespeople.
JMR Journal of Marketing Research, Chicago, v. 19, n. 3, p. 343-351, Aug. 1982.
SCHWEPKER JR., C. H.; INGRAM, T. N. An exploratory study of the relationship between the perceived competitive environment and salesperson job performance. Journal of Marketing Theory and Practice, Armonk, v. 2, n. 3, p. 15-28, Summer 1994.
STAJKOVIC, A. D.; LUTHANS, Fred. Self-efficacy and work-related performance: a
meta-analysis. Ps yc h o l o g i c a l Bu l l e t i n, Washington, D.C, v. 124, n. 2, p. 240-261, 1998.
SUJAN, H. Smar ter versus harder: an exploratory attributional analysis of salespeople’s motivation. JMRJournal of Marketing Research, Chicago, v. 23, n. 1, p. 41-49, Feb. 1986.
______; WEITZ, B. A.; KUMAR, N. Learning orientation, working smart, and effective selling.
Journal of Marketing, Chicago, v. 58, n. 3, p. 39-52, July 1994.
VERBEKE, W.; DIETZ, B.; VERWAAL, E. Drivers of sales performance: a contemporary meta-analysis: have salespeople become knowledge brokers? Journal of the Academy of Marketing Science, [S. l.], v. 39, n. 3, p. 407-428, 2011. WACHNER, T.; PLOUFFE, C. R.; GRÉGOIRE, Y. SOCO’s impact on individual sales performance: the integration of selling skills as a missing link. Industrial Marketing Management, New York, v. 38, n. 1, p. 32-44, Jan. 2009.
WALKER JR., O. C.; CHURCHILL JR., G. A.; FORD, N. M. Motivation and performance in industrial selling: present knowledge and needed research. JMRJournal of Marketing Research,
Chicago, v. 14, n. 2, p. 156-168, May 1977.
APPENDIX A – CONSTRUCTS AND ITEMS Self-efficacy
C SC Description of the question Author(s)
SELF-EFFICA
CY
SKILLS
*1. I am a good salesperson.
Sujan, Weitz, and Kumar (1994)
2. I know what to do during a sale.
*3. I have a hard time convincing a customer whose opinion is different from mine. *4. I can easily express my opinion to customers.
5. I clarify doubts and try to satisfy the customers’ objectives
Menguc and Barker (2005)
KNO
WLEDGE
6. I know products, services and sales policies of the competitors Wachner, Plouffe, and
Grégoire (2009) 7. I know the products line, and the features and benefits of each product I sell
*8. Basically, I use the same approach with most customers.
Sujan, Weitz, and Kumar (1994)
*9. I modify my selling style in every situation.
*10. When I notice my selling approach is not being successful, I manage to adopt another approach easily.
*11. I treat all the customers almost in the same way.
ORIENT
A
TION
T
O
W
ARDS
CUST
OMER
12. I try to find out what are the customer’s needs.
Wachner, Plouffe, and Grégoire (2009) *13. A good employee should act based on what is better for the customer.
*14. I offer the product/service that better fits the customer’s problem.
*15. I try to sell to the customer everything I can convince him/her to buy, even being in an amount beyond reasonable.
16. I create an extremely favorable image of the product so that it looks the best as possible.
ORIENT
A
TION
T
O
W
ARDS
LEARNING
*17. I believe there is almost nothing new to learn about sales.
Kohli, Shervani, and Challagalla (1998) 18. It is worthy to invest time in learning new techniques to deal with customers.
19. I make lots of effort to learn new things about sales.
*20. Making mistakes when selling is just a part of the learning process. 21. I am also learning something new about my customers.
Note: C: Construct. SC: Sub-construct.
(*) Items excluded in the scales purification process.
Competitiveness
Description of the question Author(s)
C
OMP
ETITIVENESS
*h) It is very important that my supervisor sees me as a good salesperson.
Sujan, Weitz, and Kumar (1994)
i) I am very happy when my performance exceeds those of other salespeople in the company.
j) I always try to talk to my manager about my results.
*k) I spent lots of time comparing my performance with that of other salespeople.
Effort
C SC Description of the question Author(s)
EF
FOR
T
FEEDBA
CK A
C
CEPT
ANCE
*a) My manager informs me about the expectation of reaching sales volume or market
share goals. Kohli, Shervani, and
Challagalla (1998) *b) My manager informs me about sales activities I should perform.
c) I try to correct the shortcomings pointed out by my manager in my sales results.
Jaworski and Kholi (1991)
d) I believe that the feedback from my manager about how to improve sales is very useful.
e) I use my manager’ suggestion on how to improve sales.
CLEAR RESUL
T
S f) My performance goals are clear.
Jaworski and Kholi (1991)
g) I know exactly which results they expect from me. h) I know which results I should attain in this work. *i) I need more information to perform my work.
*j) I know exactly how I should perform my work.
W
ORKING SMAR
T
k) I make a checklist to close the sale, “at list with the main customers”.
Sujan, Weitz, and Kumar (1994) l) I think about strategies I can use when there are problems in a sales interaction.
m) I define personal goals for each visit. n) I plan what I need to do on a weekly basis.
W
ORKING HARD
o) I work many hours to attain my sales goals.
Sujan, Weitz, and Kumar (1994) p) I work restlessly until managing to get the client closing the purchase.
Note: C: Construct. SC: Sub-construct.
Performance
Description of the question Author(s)
P
ERFORMANCE
*a) I generate profitable sales.
Sujan, Weitz, and Kumar (1994) *b) I quickly sell new products of the company.
*c) I identify and sell to the main customers of my region. Wachner, Plouffe, and Grégoire (2009)
*d) I exceed sales goals.
Kohli, Shervani, and Challagalla (1998)