of Chemical
Engineering
www.scielo.br/bjcePrinted in BrazilVol. 35, No. 01, pp. 181 – 187, January – March, 2018
* Corresponding author: Cyro Ketzer Saul. E-mail: cyro@zenithnetwork.com dx.doi.org/10.1590/0104-6632.20180351s20160369
ZNO nanoparticle fabrication starting from ultra-high (1:2)
PVOH/ZnAc proportion electrospun nanowire mats
Diogo Anderson Neves
1, Tatiana Milani Ratuznei
2, Bruno Morais Serafim
1,
Ney Mattoso
2and Cyro Ketzer Saul
1,*1 Laboratório de Inovação em Tecnologia de Sensores - LITS, Department of Physics, Universidade Federal do Paraná - UFPR, Centro Politécnico, P.O Box 19044, Curitiba, Brasil.
2 Department of Physics, Universidade Federal do Paraná - UFPR, Centro Politécnico, P.O Box 19044, Curitiba, Brasil.
(Submitted: July 4, 2016; Revised: November 10, 2016; Accepted: December 4, 2016)
Abstract – The high versatility of nanostructured ZnO has drawn considerable attention from the scientific community
since the second half of the two thousand decade. Within this timeframe, electrospinning became one of the simplest ways to produce nanostructured ZnO. In this work, we present the production and characterization of ZnO nanoparticles obtained from electrospun fiber mats using the highest (1:2) PVOH/ZnAc proportion reported so far. The thermally annealed samples were characterized using , X-Ray Diffraction (XRD), High Resolution Scanning Electron Microscopy (HRSEM), Energy Dispersive X-Ray analysis (EDS) and Cathodoluminescence (CL). The results obtained show that all annealed samples present excess zinc as oxygen vacancies (VO, VO+) or oxygen antisites (O
Zn) which contribute to a
considerable change in the CL spectra. This change evidences the presence of defect levels within the ZnO gap, which might be an indication that our nanoparticles present higher catalytic activity within the visible spectrum.
Keywords: ZnO nanoparticles, electrospinning, Cathodoluminescence
INTRODUCTION
Developed by Anton Formhals in 1934, the electrospinning process allows the manufacture of non-woven fabric (Formhals, 1934). The process consists of the ejection of an ultrathin polymeric solution thread from a high voltage polarized metal capillary toward a grounded
collector. The solvent evaporates during flight, leading to
a dry micro/nano wire deposition on the collector. The literature has many references regarding ZnO nanowire production starting from PVOH/ZnAc solutions (Anitha, 2013; Wu and Pan, 2005; Wang et al., 2008; Ding et al., 2009; Kim, 2008) but none of them achieved solid weight proportions higher than (4:5) PVOH/ZnAc. The reason of such low ratios relies on the fact that the addition of ZnAc to the PVOH aqueous solution changes its
rheological properties leading to deposition instability and
consequently non-uniform fiber formation.
Considered a highly versatile semiconductor material, ZnO presents a band gap of 3.37 eV and a high exciton energy of 0.06 eV which makes it attractive for
optoelectronic (Djurišić et al. 2010; Liu et al. 2010;
Weintraub et al., 2010; Wu and Xue, 2011) and sensor (Wu andXue2011; Chen et al. 2016) applications. Another important issue is the photocatalytic property,which
is known since the late nineteen fifties (Garn, 1952).
The increasing photocatalysis activity associated with nanostructuring started to draw attention toward biological (Baek et al., 2011; Tayel et al., 2011; Premanathan et al.,
2011) and chemical (Guo et al., 2011; Ullah and Dutta,
According to Premanathan et al. (2011), supported by other studies, the ZnO cytotoxicity mechanism might proceed by reactive oxygen species (ROS) formation, which therefore leads to cell apoptosis. Considering that, among the ROS species, H2O2 production is significantly enhanced when a nanoparticle-containing solution is exposed to UV light (300 – 350 nm) (Premanathan et al., 2011; Domènech et al., 2001), it is reasonable to assume that biological activity should increase likewise. Since UV light with short wavelengths can be harmful even to healthy cells, it would be highly interesting if the ZnO absorption range could be shifted towards lower energies, therefore generating ROS from photons within the visible spectrum.
In this work, we present a very simple route to obtain
extremely uniform electrospun PVOH/ZnAc nanofiber
mats using the highest PVOH/ZnAc(1:2) proportion
reported so far. The obtained fiber mats were used as a high
concentration (ZnAc) source to produce ZnO nanoparticles after thermal annealing.The nanoparticles,obtained
after thermal annealing at different temperatures,were
characterized using High Resolution Scanning Electron
Microscopy (HRSEM), X-Ray diffraction, Energy
Dispersive X-Ray analysis (EDS) and cathodoluminescence (CL), which allow the correlation between stoichiometry, defect content and optical properties.
EXPERIMENTAL
The electrospinning precursor aqueous solution was prepared using (Polyvinyl Alcohol (PVOH)Mw = 85000 g/ mol) from Sigma-Aldrich, Zinc Acetate dihydrate (ZnAc-2H2O) from VETEC Quimica, the anionic surfactant Lauryl Sodium Sulfate (LSS) from Sigma-Aldrich, and Bi-distilled water. The higher practical proportion of PVOH/ ZnAc(1:2) was achieved using 7 wt% of PVOH, 15 wt% of ZnAc and 0.2 wt% of LSS, after extensive tests with
different concentration precursor aqueous solutions in
the survey phase of this work. Those results will not be presented for the sake of brevity.
The electrospinning process was performed using voltages within 17.4 + 0.5 kV and flow rates within 25 + 4 ml/min at a constant distance of 20 cm from tip to collector. The criterion to adjust the deposition parameters was to
set the flow rate and then adjust the voltage until a stable
Taylor cone was achieved. This is necessary to overcome
environmental condition fluctuations like temperature
and humidity. The Taylor cone monitoring was visually performed using a magnifying lens.
The electrospun fiber mat was divided into five samples; the first one was used as a reference for as electrospun
characterizations, the next four were respectively annealed at 400, 600, 800 and 1000 oC during 4 hours. All thermal
treatments were performed in a high temperature oven from
GP Científica (Brasil) using a 20 oC/min initial heating rate
and atmospheric pressure.
Morphology and particle size measurements were
performed using a FEI Quanta 450 FEG High Resolution
SEM (HRSEM) at 20 kV. To better identify the ZnO grains the samples were not metalized prior to observation. This fact reduced the overall image quality due to sample
charging effects.
X-Ray Diffraction (XRD) measurements were
performed on a Shimadzu Maxima X (XRD 7000) using
Bragg-Brentano (θ/2θ) configuration at 40 kV/ 20 mA
using a Cu Kα radiation (λ= 0.1542 nm). The obtained
annealed sample spectra were studied by fitting a pseudo-voight function to each of its three main diffraction peaks,
associated with the (100), (002) and (101) planes. Peak
fittings were performed using the free version 0.9.8 of
Fityk (Wojdyr, 2010).
Energy Dispersive X-Ray analyses (EDS) were performed using an Oxford X-Max80 Detector and the AZtec software at a TESCAN Vega 3 LMU SEM. We used a 5 keV beam energy to excite the Zn-Lα (1.01 keV), O-Kα (0.54 keV) and C-Kα (0.27 keV) to determine those element proportions with the best spatial resolution.
Room temperature cathodoluminescence (CL) spectra
and images were performed with a GATAN
MonoCL4-Plus on a JEOL JSM 6360-LV SEM at 15 kV and 12 mm working distance. Spectra were obtained using a 2 nm step size and a 2 s dwell time. The CL spectrometer has a + 1 nm resolution.
The CL spectrum analysis was performed by fitting multiple Gaussian curves with well-defined energies based on the literature, as shown in Table 1. All fittings were
performed including the listed defects contributions, as well as the gap contribution. Contributions from PVOH were also included, but since they are extremely small after the 400 oC annealing and disappear at higher temperatures
they were omitted from the table. The only peak that has
a variable energy position during the fitting procedures
corresponds to the ZnO energy gap transition. Fittings were also performed using Fityk (Wojdyr, 2010).
RESULTS AND DISCUSSION
The results obtained with each characterization techniques will be separated into as electrospun and after annealing to simplify comprehension.
As electrospun samples
The images in Figure 1 show two different magnifications of the same region of as electrospun (1:2) PVOH/ZnAcnanofiber mats. Image analysis indicates an average fiber diameter of (253+ 47) nm.
fraction of Zn (Zn-Lα and Zn-Lη) from the zinc acetate as well as the oxygen (O-kα) and carbon (C-kα) peaks that
have contributions from both acetate and PVOH. Those results were not shown for the sake of brevity.
Annealed Samples
After thermal annealing, there is a noticeable morphological change as the temperature is increased. After 400oC/4h the nanofiber structure is clearly visible,
similar to the as electrospun structure. The fibers maintain
an almost straight appearance with nanoparticles attached
throughout their length, as shown at two magnifications
in the HRSEM images of Figure 2a. The average particle size is 195 nm. After 600 oC / 4 h the nanofibers lose their
straightness, the nanoparticles that constitute them are more evident and their average size was reduced to 109 nm, as shown in the SEM images of Figure 2b. After 800 oC / 4 h
the nanofiber structure is no longer perceptible, as shown
in the SEM images of Figure 2c. The almost continuous membrane is composed by nanoparticles with an average size of 220 nm. After 1000 oC / 4 h the nanofiber structure
is no longer perceptible and the nanoparticle average size increased to 696 nm, as shown in Figure 2d. All the structures obtained after thermal annealing were extremely fragile, breaking down to powder with any disturbance.
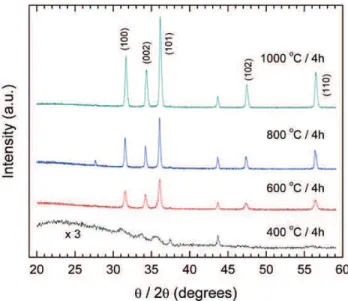
XRD measurements indicate the presence of Wurtzite
structure nanoparticles, still imbedded in the nanofibers,
even after the lowest temperature thermal annealing. In this case this is evidence of the presence of small broad
diffraction peaks, associated with the Wurtzite planes
(100), (002) and (101), as shown in Figure 3. Further thermal annealing improves crystal quality and crystallite size. The unindexed peak shown is associated with the aluminum sample holder.
Further analysis of the three strongest diffraction peaks
shows that the interplanar distance associated with each crystalline plane approaches the JCPDS card (International
Centre for Diffraction Data - ICDD 36-1451) bulk standard
as the annealing temperature increases, as shown in the lower graph of Figure 4. The crystallite size, which is directly associated with the crystalline coherence length, shown in the upper graph of Figure 4, presents an almost
linear growth until the annealing at 800oC / 4h. This linear
behavior can also be observed in the work of Polarz et al. (2005) up to 900oC using a chemical vapor synthesis (CVS)
process. After the annealing at 1000oC / 4h a reduction
in the crystallite size is observed, although there is an evident increase in the average particle size. This apparent contradiction will be discussed further ahead.
EDS measurements presented in the graphs of Figure 5 evidence the sample compositional evolution throughout the annealing process. The graph of Figure 5a indicates that the relative concentrations of zinc, oxygen and carbon remain practically unchanged until the thermal annealing at 1000 oC, when a sudden drop in the oxygen and a
proportional increase in the zinc concentration is clearly visible. This graph is complemented by the stoichiometry graph in Figure 5b which indicates a slight increase in the Zn/O ratio (between 1.25 and 1.5) until the annealing at 800
oC. After the 1000 oC annealing the Zn/O ratio changes to
almost 3.5, due to ZnO decomposition at high temperature. The carbon content, also shown in Figure 5b, presents a linear decay during annealing until the treatment at 1000 oC
when the decay rate increases. This carbonaceous residue
is probably buried in the ZnO nanoparticles and is difficult
to be oxidized due to the zinc competition for oxygen. After thermal annealing, the CL spectra consist of two broad peaks, one associated with the gap transition and the other associated with miscellaneous defects,
Table 1. List of peak contributions used to fit CL spectra
Peak Energy (eV) Source of Contribution Symbol Reference
1.62 Oxygen vacancy VO a,b
2.00 Positively charged Oxygen vacancy VO+ a, c
2.38 Oxigen antisite defect OZn a, b
2.53 Oxygen vacancy VO a
3.06 Zinc vacancy VZn a
3.16 - 3.21 ZnO gap Gap b
References: (a - Tam et al., 2006; b - Lin et al., 2001; c- Lima et al., 2001)
Figure 1. SEM images of as electrospun (1:2) PVOH/ZnAc nanofiber
which will be further analyzed ahead. The spectra shown in Figure 6 clearly indicate that the increase in the annealing temperature increases drastically the defect peak contribution and reduces the gap transition contribution in a less remarkable manner. Notice that some spectra in
this figure are multiplied by constants in order to allow
comparison.
The gap transition contributions to the CL spectra were analyzed using only one peak instead of two located at 3.15 eV and 3.27 eV, as suggested by Silva et al. (2014).
The peak was left to shift its energy during fitting. The
graph of Figure 7 presents the peak behavior and its contribution to the whole CL spectra. The error bars around the energy value represent the full width at half
maximum (FWHM) of each fitted peak. The gap energy
shifts slightly around an average value of about 3.18 eV (UV), which is in accordance with that observed by Lin et
al. (2001) in thin films. This graph also evidences that the
gap peak contribution to the CL spectra is small (< 25%) for all annealing temperatures and reduces rapidly, almost vanishing, after the annealing at 1000 oC.
The contributions from each of the analyzed defects to the CL spectra are shown in the graph of Figure 8. There is a small contribution from oxygen vacancies (VO) at 1.62 eV (IR) and 2.53 eV (blue-green) (Tam et al., 2006;
Lin et al., 2001). This contribution increases a little bit after the annealing at 600 oC and then almost vanishes for
higher annealing temperatures. The single charged oxygen
Figure 2. HRSEM images at 5kX for samples treated at a) 400 oC, b) 600 oC, c) 800 oC, and d) 1000 oC with their respective inserts obtained at 50 kX
vacancy (VO+) at 2.0 eV (orange) (Tam et al., 2006) has a
strong contribution to the CL spectra, which increases up to the annealing temperature of 800 oC, and then is abruptly
reduced by a half of its initial value after the samples were annealed at 1000 oC. This drop after the annealing at 1000 oC
is in agreement with the strong increase in the contribution from oxygen antisite defects (OZn) at 2.38 eV (green)(Tam et al., 2006; Lin et al., 2001). The increase in oxygen antisites is also in accordance with the strong increase in the atomic proportion of zinc and respective oxygen reduction observed in EDS measurements after the 1000 oC annealing.
The contribution of zinc vacancies (VZn), at 3.06 eV (violet) (Tam et al., 2006), is very small after the 400 oC annealing
and reduces until it vanishes after the annealing at 1000
oC. The elevated contribution of oxygen vacancies is also
consistent with the stoichiometry measured using EDS, which indicates an excess of zinc (between 25% and 50%) up to the annealing at 800 oC. Then, this excess rises about
150% (~ 3.4 Zn/O ratio) after the annealing at 1000oC,
coinciding with the rise of oxygen antisites (OZn), which also indicates an excess of zinc in the samples.
We have also found a good linear correlation between the particle size and the oxygen antisite (OZn) percentile in the CL peak area for samples annealed above 600 oC, as
shown in Figure 9, which also indicates the excess Zinc in the nanoparticles as they grow bigger.
Our hypothesis for the apparent contradiction between the crystallite size reduction after the 1000 oC / 4h thermal
annealing, presented in the upper graph of Figure 4, and grain size increase in the same conditions measured during the morphological analysis, is that, although the crystals grew in size, their crystalline coherence length reduced due to the overwhelming defect content increase. The correlation between crystal size and the oxygen antisite (OZn) CL peak area percentile, shown in Figure 9, as well as the remarkable change in the crystal stoichiometry, shown in the graph of Figure 5b, are evidences that support our hypothesis.
Since the increase in oxygen antisite defects (OZn) means the increase of defect levels inside the band gap, it is reasonable to suppose that these defect-packed nanoparticles would produce much more electrons in the conduction band when illuminated by visible light than defect-free ones. The results presented by Ullah and Dutta (2008), when characterizing ZnO and Mn-doped ZnO nanoparticles, help to sustain this supposition.
Therefore, it seems reasonable to assume that our nanoparticles should present higher catalytic activity within the visible spectrum with both potential chemical and biological applications.
Figure 5. (a) Relative concentration of the different elements in the annealed samples as a function of temperature. (b) Zn/O ratio and Carbon
concentration as a function of annealing temperature.
CONCLUSION
In this work, we present the production and characterization of ZnO nanoparticles obtained from
electrospun fiber mats using the highest (2:1) ZnAc/PVOH proportion reported so far. The obtained fiber mats were
thermally annealed at temperatures from 400 to 1000 oC
/ 4h. After thermal annealing, some of the samples still
presented the fiber structure, composed of agglomerated
nanoparticles, but their fragility was so substantial that the
samples became dust with the slightest mechanical effort.
XRD measurements indicate that the obtained nanoparticles assume a Wurtzite crystalline structure, even at the lowest thermal annealing temperature. EDS measurements indicate
that, even after the lowest annealing temperatures, the ZnO stoichiometry is above the bulk reference with a zinc excess.
This excess is also confirmed by the high contribution of
oxygen vacancies (VO, VO+) and from the CL spectra. We
also observed a drastic change after the thermal annealing at 1000 oC, when the oxygen content reduces drastically with
the concomitant increase in the zinc content. This change,
confirmed by EDS and CL measurements, is accompanied
by a considerable increase in the nanoparticle dimensions and a crystallite size reduction. This apparent contradiction can be understood in terms of both oxygen antisite (OZn) defect increase and the stoichiometry deviation toward the zinc content, which imply a reduction in crystalline coherent length. The amount of intra-band gap defects, evidenced by
Figure 6. CL spectra of annealed samples at different temperatures.
Some of the spectra multiplied by a scaling factor to allow comparison.
Figure 7. CL gap peak energy and area fraction evolution as a function of annealing temperature. Error bars represent the gap peak FWHMs. The area fraction is relative to the total spectrum area. The curves connecting data points are just a guide to the eye.
Figure 8. CL peak area fraction evolution for defects as a function of annealing temperature. The curves connecting data points are just a guide to the eye.
CL measurements, is an evidence that these nanoparticles might present increased photocatalytic activity, broadening their applicability in both biological and chemical applications.
ACKNOWLEDGEMENTS
We would like to acknowledge the INCT for Diagnostics in Public Health, which is supported by Conselho Nacional
de Ciência e Tecnologia (CNPq), for financial support and
the CME (Electronic Microscopy Center) of Universidade Federal do Paraná.
REFERENCES
Anitha, S., Systematic investigation on electrospun nanofibrous composite membrane of Zno/polymer for UV sensor super-hydrophobic and antibacterial application, Doctorate Thesis, Chennai: SRM UNIVERSITY (2013).
Baek, M., Kim, M.K. Cho, H.J. Lee, J.A. Yu, J. Chung, H.E. and Choi, S.J., Factors influencing the cytotoxicity of zinc oxide nanoparticles: particle size and surface charge, Journal of Physics: Conference Series, 304, n-012044 (2011)
Chen, H., Liu, H., Zhang, Z., Hu, K., and Fang, X., Nanostructured Photodetectors: From Ultravioletto Terahertz. Advanced Materials, 28, p-403 (2016)
Ding, B. Wang, M., Yu, J., and Sun, G., Gas Sensors Based on Electrospun Nanofibers, Sensors, 9, p-1609 (2009)
Djurišić, A.B. Ng, A.M.C., and Chen, X.Y., ZnO nanostructures for optoelectronics: Material properties and device applications, Progress in Quantum Electronics, 34, p-191 (2010)
Domènech, X. Ayllón, J.A., and Peral, J., H2O2 Formation from photocatalytic processes at the ZnO/water interface. Environmental Science and Pollution Research, 8, 285, (2001) Formhals, A., Process and apparatus for preparing artificial
threads, US Patent 1.975.504, 2 Oct. (1934).
Garn, P.D., The catalytic activity of zinc oxide in the photochemical formation of hydrogen peroxide, PhD Thesis, Ohio State University (1952)
Guo, M.Y., Fung, M.K. Fang, F. Chen, X.Y., Ng, A.M.C., Djurisic, A.B., and Chan, W.K., ZnO and TiO2 1D nanostructures for photocatalytic applications, Journal of Alloys and Compounds, 509, p-1328, (2011)
Hariharan, C., Photocatalytic degradation of organic contaminants in water by ZnO nanoparticles: revisited, Applied Catalysis A: General, 304, p-55, (2006)
International Centre for Diffraction Data - ICDD 36-1451 Kim,Y., Lee, D.Y., Lee, M.-H., Cho, N.-I., Song, Y.-S., and
Lee, S.-J., Characterization of Electrospun ZnO Nanofibers, Journal of the Korean Physical Society, 53, p-421 (2008)
Lima, S.A.M., Sigoli, F.A., Jafelicci Jr, M., and Davolos, M.R., Luminescent properties and lattice defects correlation on zinc oxide, International Journal of Inorganic Materials, 3, p-749
(2001)
Lin, B., Fu, Z. and Jia, Y., Green luminescent center in undoped zinc oxide films deposited on silicon substrates, Applied Physics Letters,79, p-943 (2001)
Liu, K., Sakurai, M., and Aono, M., ZnO-Based Ultraviolet Photodetectors, Sensors, 10, p-8604 (2010)
Polarz, S., Roy, A., Merz, M., Halm, S., Schröder, D., Schneider, L., Bacher, G., Kruis, F.E. and Driess, M. Chemical Vapor Synthesis of Size-Selected Zinc OxideNanoparticles. Small, 1, p-540 (2005)
Premanathan, M., Karthikeyan, K., Jeyasubramanian, K., and Manivannan, G., Selective toxicity of ZnO nanoparticles toward Gram-positive bacteria and cancer cells by apoptosis through lipid peroxidation. Nanomedicine: Nanotechnology, Biology and Medicine, 7, p-184 (2011)
Silva, T.G., Silveira, E., Ribeiro, E., Machado, K.D., Mattoso, N., and Hümmelgen, I.A., Structural and optical properties of ZnO films produced by a modified ultrasonic spray pyrolysis technique, Thin Solid Films, 551, p-13 (2014)
Szabó, T., Németh, J., and Dékány, I., Zinc oxide nanoparticles incorporated in ultrathin layer silicate films and their photocatalytic properties. Colloids and Surfaces A: Physicochemical and Engineering Aspects, 230, p-23 (2003) Tam, K.H., Cheung, C.K., Leung, Y.H., Djurišić, A.B., Ling, C.C.,
Beling, C.D., Fung, S., Kwok,W.M., Chan, W.K., Phillips, D.L., Ding, L. and Ge, W.K., Defects in ZnO nanorods prepared by a hydrothermal method, The Journal of Physical Chemistry B, 110, p-20865 (2006)
Tayel, A.A., El-Tras, W.F., Moussa, S., El-Baz, A.F., Maharous, H., Salem, M.F. and Brimer, L., Antibacterial action of zinc oxide nanoparticles against foodborne pathogens, Journal of Food Safety, 31, p-211 (2011)
Ullah, R., and Dutta, J. Photocatalytic degradation of organic dyes with manganese-doped ZnO nanoparticles, Journal of Hazardous Materials, 156, p-194, (2008)
Venturini da Silva, L.J., Foletto, E.L., Dorneles, L.S., Paz, D.S., Frantz, T.S., and Gündel, A., ZnO electrodeposition onto gold from recordable compact discs and its use as photocatalyst under solar irradiation. Brazilian Journal of Chemical Engineering, 30, p-155 (2013)
Wang, W., Huang, H., Li, Z., Zhang, H., Wang, Y., Zheng, W., and Wang, C., Zinc Oxide Nanofiber Gas Sensors Via Electrospinning, Journal of the American Ceramic Society, 91, p-3817 (2008)
Weintraub, B.O., Zhou, Z., Li, Y., and Deng, Y., Solution synthesis of one-dimensional ZnO nanomaterials and their applications, Nanoscale, 2, p-1573 (2010)
Wojdyr, M., Fityk: a general-purpose peak fitting program. Journal of Applied Crystallography, 43, p-1126 (2010) Wu, H. and Pan, W., Preparation of zinc oxide nanofibers by
electrospinning. Journal of the American Ceramic Society, 89, p-699 (2005)