______________________________________________________________________________________________________ 1,2,3,4 Instituto de Ciências Atmosféricas, Universidade Federal de Alagoas, Maceió, Alagoas, Brasils.
242 | Rev. Geama, Recife – 3 (4): 242-251. Out-Dez 2017. | Online version ISSN: 2447-0740 | http://www.geama.ufrpe.
Article
________________________________________________________________________________________________
Ciências Ambientais Environmental Sciences
Estimation of maize yield losses in Alagoas for future
climate change scenarios
Hugo C. de Almeidar1, João P. G. Nobre2, Eli M. dos S. Silva3 & Fabrício D. dos S. Silva4
* Corresponding Author: [email protected] Received: July 1, 2017 Todos autores contribuíram de forma igualitária Accepted: July 281, 2017
Published: October, 2017
ABSTRACT
The performance of four global models, together with two scenarios of climate change, was evaluated in five municipalities of the State of Alagoas, for precipitation, minimum and maximum temperature. The input data of the model were obtained through the conventional meteorological stations of the National Institute of Meteorology (INMET), arranged between 1961 and 2016. Estimation of corn yield was obtained through the theoretical model which relates losses in productivity and water deficiency during the phenological phases of the crop. A post-processing technique of global climate model outputs (statistical downscaling) was used, thus, a better visualization in time and space. The precipitation and temperature series were used for the period 2021-2080 estimating the yield losses of maize, comparing to the historical average values of the period 1961-2016, evaluating the impacts of possible climatic changes on crop yield. The scenarios have valuesof losses very close to and indicate a prediction of increased productivity loss in the period 2021-2080 for Água Branca, Pão de Açúcar and Palmeira dos Índios, and decrease of losses, that is, increase of productivity, for Maceió and Mainly Porto de Pedras. This result is directly associated to the predictions of rainfall reduction in the interior of the State, encompassing the cities of Água Branca, Pão de Açúcar and Palmeira dos Índios, a slight increase in precipitation for Maceió and a more significant increase in precipitation in Porto de Pedras.
Keywords: Climatology, Statistical Downscaling, Agrometeorological Model
Introduction
Subsistence agriculture is still practiced on a large scale in all states of the Northeast, especially in the small cities of the semi-arid interior. Low or no technology makes this activity extremely susceptible to climatic adversities such as drought (ALVES; REPELLI, 1993). The most recent surveys involving observed climate change (HAYLOCH et al., 2006; SOLMAN et al., 2008; SKANSI et al., 2013) and projected under various scenarios of future emissions from Global Climate Models (GCMs) (CHOU et al., 2014; FRANCHITO et al., 2014), shows growing concern about the consequences of climate change in relation to the loss in yield of subsistence crops grown in the Northeast region. These studies show that there is a predominantly positive trend in the increasing temperatures, directly causing an increase in Potential Evapotranspiration (PET). In the Northeast, which has most of its area inserted in the semi-arid climate, the
increase in PET associated with the already known high spatial-temporal variability of the precipitation, can further damage the agricultural activities, especially those of in unirrigated areas.
This research will focus on five municipalities in the State of Alagoas: Água Branca, Pão de Açúcar, Palmeira dos Índios, Maceió and Porto de Pedras. The first specific objective will be the application of an agrometeorological model duly calibrated to the soil and climatic conditions of the region, proposed by Doorenbos and Kassam (1979), to quantify the average yield loss for maize in the period 1961-2016.
The second specific objective will be to analyze precipitation and temperature forecasts for municipalities from two future climate change scenarios, using statistical downscaling techniques for predictions of four GCMs, for the period 2021-2080.
According to the specific objectives, the main objective of this work will be to investigate the variability of losses in maize production from
243 | Rev. Geama, Recife – 3 (4): 242-251. Out-Dez 2017. | Online version ISSN: 2447-0740 | http://www.geama.ufrpe. precipitation forecasts and PET for future climate
change scenarios, from the average of the models (ensemble), verifying which cities and mesoregions of the state will experience, according to the climatic conditions, favorability or not to the loss of productivity.
Material and Methods
Meteorological data
The daily meteorological data used in the survey were provided by the INMET, period between 1961 and 2016. The stations of Água Branca and Pão de Açúcar are located in the hinterland of Alagoas, Palmeira dos Índios, in the harsh Alagoas, Maceió and Porto de Pedras, in the east of Alagoas. The metadata of the stations are in Table 1.
Table 1. Code, name, latitude, longitude and altitude of the five INMET meteorological stations in the State of Alagoas.
Station
Code Station name Latitude (°) Longitude (°) Altitude (m) 82989 Água Branca -9,28 -37,90 605,3 82990 Pão de Açúcar -9,75 -37,43 19,1 82992 Palmeira dos Índios -9,45 -36,70 274,9 82994 Maceió -9,70 -35,70 64,5 82996 Porto de Pedras -9,18 -35,43 50,02
Agrometeorological Model
The agrometeorological model uses the water balance of the crop, relating the productivity depletion to the sensitivity of the crops to water stress, in the various stages of development of the plants according to Equation 1 (DOOREMBOS; KASSAM, 1979). These models suggest that water consumption is expressed by the ratio between Real Evapotranspiration of Crops (RETc) and the Crop Potential Evapotranspiration (PETc), thus quantifying the effect of available water in the soil over the decrease of final yield. The PET was calculated by the Penman-Monteith method estimated according to the procedures proposed by Allen et al., (1998), in Bulletin 56 of the FAO (Equation 2). A RETc was calculated through the sequential ten day (decendial) water balance of the crop.
The relative penalization (%) was estimated by the model for an average cycle of 120 days of maize crop, being compared with the derived production data from the production data series and municipal planted area of the Aggregated Database (kg/ha), IBGE Automatic Recovery System – SIDRA (IBGE,2010). The penalization
methodology is tested and compared with the observed productivities in order to verify its accuracy and precision before being applied to future climate change scenarios.
As future scenarios are generated only for precipitation and maximum and minimum temperatures, the calculated PET for 2021-2080 used the methodology proposed by Hargreaves and Samani (1985), which only requires temperature data and solar radiation (Equation 3). In this case, the incident solar radiation is given by: Rs = R0*KT*(Tmax-Tmin)0.5, where R0 is the extraterrestrial atmospheric solar radiation tabulated for bands of latitudes of the northern and southern hemispheres (ALLEN et al., 1998), KT is an empirical coefficient calculated from atmospheric pressure data with values given by Samani (2000) of 0.162 for regions within the continents and 0.19 for coastal regions, Tmax and Tmin are the maximum and minimum daily temperatures. 𝑌𝑑 = (1 −𝑅𝐸𝑇𝑐𝑃𝐸𝑇𝑐) ∗ 𝑘𝑦 ∗ 100 (1) 𝐸𝑇𝑃 = 0.408∆(𝑅𝑛−𝐺)+ 𝛾900𝑈2(𝑒𝑠−𝑒𝑎) 𝑇+273 ∆+𝛾(1+0.34𝑈2) (2) 𝑃𝐸𝑇 = 0.0023 ∗ (𝑇𝑎𝑣𝑔+ 17,78) ∗ 𝑅0∗ (𝑇𝑚𝑎𝑥− 𝑇𝑚𝑖𝑛)0.5 (3) Where,
Yd is the final penalization;
Rn and G are the net radiation and heat flow in the soil (MJ/m2/day);
Tavg is mean daily temperature (°C);
U2 is the average wind speed measured at 2m height (m/s);
λ is the latent heat of evaporation of water equal to 2.45 (MJ/kg);
Δ is the slope of the vapor pressure versus temperature curve (kPa/°C);
𝛾 is the psychrometric constant (kPa/°C);
(es - ea) is the air vapor pressure deficit for measured reference height and 900 is a coefficient for the reference crop (kJ-1KgK°d-1).
The CAD used for the municipalities of Água Branca, Pão de Açúcar and Palmeira dos Índios was related to an average soil texture between clayey and sandy, of 60mm. For the stations of Maceió and Porto de Pedras located in the coastal strip used a CAD of 43.2mm relative to a sandy soil texture. The productivity series were then composed of the weighting among the three planting dates proposed by the Federal Government for the State of Alagoas: 20/04, 20/05 and 20/06. It is estimated that between the three dates, 25% of producers will try to produce on the first date, 50% on the second date and 25% on the third date (http://www.mda.gov.br/sitemda/secretaria/saf-garantia/sobre-o-programa).
244 | Rev. Geama, Recife – 3 (4): 242-251. Out-Dez 2017. | Online version ISSN: 2447-0740 | http://www.geama.ufrpe.
Statistical Downscaling
Statistical Downscaling (SDS) is a post-processing technique of the outputs of MCGs, that allows to redesign the forecasts with low spatial resolution, on average of the order 250km, the local scale of meteorological stations (NGUYEN et al., 2006). This technique was developed out of necessity to have more detailed information in the time and space of the numerical forecast products of time and climate (WILBY; WIGLEY, 1997; HALL et al.,1999). This technique has the potential of detailing and assessing the climate risk for specific issues on a regional scale, in general, deterministic methods that assume a relationship between large scale climate variable such as precipitation and temperature (WILBY et al., 2004).
A Statistical Downscaling Model (SDSM) should be established that relates the predictions on local scale, such as precipitation and the maximum and minimum daily temperatures and large-scale predictors such as mean sea-level pressure and surface vorticity (WILBY; DAWSON, 2007). The established relations are then applied to simulated circulation by MCG, in order to generate local weather forecasts, motivated by the assumption that MCGs are more efficient in simulating atmospheric circulation on a large scale than in simulating surface climate variables (MURPHY; 2000, MARAUN et al., 2010). In this study, the selected SDSM was the analogous method, which compares the large-scale atmospheric circulation simulated by an MCG with each of the historical observations, and the most similar pattern with the observations is chosen as its equivalent (ZORITA et al., 1995, ZORITA; STORCH, 1999).
The climate change scenarios A1B and A2 were used to generate the precipitation series, maximum and minimum temperatures for the period 2021-2080, from the following MCGs: ECHAM5-OM, of Max Planck Institute for Meteorology, Germany; HadGEM2-ES, of Meteorological Office Hadley Centre, United Kingdom; BCM version 2, of Bjerknes Centre for Climate Research (BCCR), University of Bergen, Norway; and CNRM-CM3 of National Center for Meteorological Research of France. Reanalysis data of the precipitation and temperature variables of the project ERA40 (UPPALA et al., 2005) and of the NCEP/NCAR (KALNAY et al., 1996), are used to find the best relationship of these variables with those of large scale for different atmospheric levels provided by MCGs, due to the patial resolution of 2.5 ° of MCGs. Subsequently, this equation can be replicated to the surface stations. For precipitation, the predictive variables of MCGs were the meridional component of the mean wind velocity at the 850 hPa level, zonal component of the mean wind velocity at the 850 hPa level, specific humidity at the 850 hPa level, pressure at the mean sea level, geopotential at 500 hPa and temperature at the 850 hPa level, from the ERA40 project reanalysis. For the temperatures, the respective
predictor variables selected were: specific humidity at the level of 850 hPa, pressure reduced to mean sea level, geopotential at 500 hPa and temperature at the level of 850 hPa, of the reanalysis of the NCEP/NCAR.
The application of the method of analogues is divided into two stages: training (75% of the data, relating to the reference period 1961-1990) and tests (25% of the data, for the period 1991-2000). The training phase is calibrated using the training data, while the test phase is validated between the simulations made for this period and the corresponding observations. The test data are not used in the calibration phase, so the coefficients obtained for the analogue method in the calibration phase can be extrapolated to new data sets from the scenarios of the models for the horizon 2001-2080.
For the training period, we test the ability of the models to represent the observed climatology of the reference period 1961-1990. The validation phase obtains relevant statistical parameters, such as the probability density functions between observations and predictions, dispersion diagrams with the Pearson correlation coefficient, using the t-student test (MENEZES, 2010) to analyze their statistical significance, and qq-plot graphs to test the normality of predicted and observed data. The time scale used is daily and decendial (10 days), combining with the same time scale used by the agrometeorological model.
Relation of Yield to Future Scenarios
After the process of scale reduction of MCG projections by the technique of statistical downscaling, the series of precipitation and temperatures for the period 2021-2080 were used to derive estimates of yield losses of maize, for an average cycle of 120 days, which was compared to the historical average values of the period 1961-2016, in order to evaluate the impacts of possible climatic changes on the yield of this crop.
Results and Discussion
Agrometeorological Model Applied to the Period 1961-2016
Relative yields and consequent productivity losses were obtained for corn with a mean cycle of 120 days for the five municipalities of the state of Alagoas, whose penalization depends only on the relationship between RETc and PETc. These productivity estimates were validated with annual productivity data provided by IBGE between 2000 and 2010. According to the data from the IBGE in those 11 years, the average productivity in Água Branca was 368 kg/ha, in Pão de Açúcar of 448 kg/ha, Palmeira dos Índios 522 kg/ha and Porto de Pedras 629 kg/ha. No information for Maceió.
245 | Rev. Geama, Recife – 3 (4): 242-251. Out-Dez 2017. | Online version ISSN: 2447-0740 | http://www.geama.ufrpe. As the yield/loss is estimated in percentage
values and the one made available by IBGE in kg/ha, to associate these values, the coefficient of maximum technological efficiency (Δp) and the adjusted water deficit factor (ky*) for each municipality were calculated during the calibration process of the yield model. These parameters allow to simulate, with more precision, the yield for each year. First, a yield estimate is obtained for each municipality, without taking into consideration the maximum technological yield (Δp) and the adjusted water deficit factor (ky*). Then, by calculating the technological potential productivity, by correcting yield trends over time, the accuracy of both low and high yield estimates is improved and the percent yield loss values can be approximated to the values observed by the IBGE, calibrating the model and finding the values of Δp and ky*. In some cases, where the water stress factor does not become very relevant and the value of ky* remains equal to 1 (MONTEIRO et al., 2013, MONTEIRO et al., 2017).
To illustrate the importance of these parameters in the simulation of yield, the graphs in Figure 1 show the curves, between 2000 and 2010, yield estimate versus the yield observed in the municipalities of Água Branca and Pão de Açúcar, respectively.
Then, for each municipality, we obtained the average relative yield loss for the whole period 1961-2016, shown in Table 2, respecting the weight of 0.25; 0.50; 0.25 for the three dates in sequence. The results indicated in Figure 1 served to validate the agrometeorological model, giving the average estimates of losses in percentage terms for each municipality shown in Table 2.
Figure 1: Estimated yields (red lines) and observed (blue lines) of maize in the cities of Água Branca (on) and Pão de Açúcar (below), in kgha-1. The green line is the technological potential yield trend and the black line is the observed yield trend. Values of the absolute mean error (ME, in %), determination coefficient (r2) and correlation coefficient (r) between simulations and observations are shown in the right and left lower corners of the figures, respectively. The values of r are statistically significant at the 95% level by the t-student test.
Table 2. Yield losses estimated for the three dates recommended for planting and final weighted loss per municipality. The values are relative to the average for the period 1961-2016.
Station name Average loss on the 1st date (20/04) Average loss on the 2nd date (20/04) Average loss on the 3rd date
(20/04) Average Loss Weighted Água Branca 48% 49% 65% 53% Pão de Açúcar 75% 76% 85% 78% P. dos Índios 48% 76% 68% 50% Maceió 31% 76% 51% 30% Porto de Pedras 39% 46% 63% 49%
Calibration and Validation of Statistical
Downscaling for Present Climate
The statistical downscaling technique was applied to the precipitation series, maximum and minimum temperatures for the period 1961-2000 (1961-1990 for training and calibration and 1991-2000 for validation). The first way to verify if the SDSM was well adjusted is to identify its ability to simulate climatology for a reference period, which coincides with the 1961-1990 calibration period.
In Figure 2, it is shown for each municipality how the SDSM employed ensemble of models, represents well the annual rainfall cycle. For Água
Branca, Figure 2a shows that the models tend to overestimate precipitation in the driest months of the year between August and February and to underestimate precipitation in the rainy months from March to July. In Pão de Açúcar the models underestimate precipitation in the first two months tending to overestimate from July to December (Figure 2b). In Palmeira dos Índios, the tendency of the models to overestimate precipitation from August to April and to underestimate it in the
May-246 | Rev. Geama, Recife – 3 (4): 242-251. Out-Dez 2017. | Online version ISSN: 2447-0740 | http://www.geama.ufrpe. July quarter is the rainiest of the year (Figure 2c). In
Maceió the average climatology of the models only underestimates rainfall in the quarter from March to May (Figure 2d). Porto de Pedras is the municipality where the magnitude of the climatologically differences of the models is more significant in relation to the one observed, mainly in the underestimates from April to July that can surpass 100mm (Figure 2e).
For the maximum and minimum temperatures (Figures not shown) the average climatology of the models is even closer to that observed than precipitation. In the coastal cities of Maceió and Porto de Pedras, the models overestimate the observed climatology of maximum temperatures during the rainy season of the year, from April to August. For the minimum temperatures, the models tend to underestimate the observations in almost every month of the year for the cities of Água Branca, Pão de Açúcar, Palmeira dos Índios and Maceió, except for Porto de Pedras, with the climatology of the models overestimating the observed in practically every month except December.
Figure 2: Monthly precipitation climatology of observations and ensemble models for the period 1961-1990 for (a) Água Branca, (b) Pão de Açucar (c) Palmeira dos Índios, (d) Maceió and (e) Porto de Pedras.
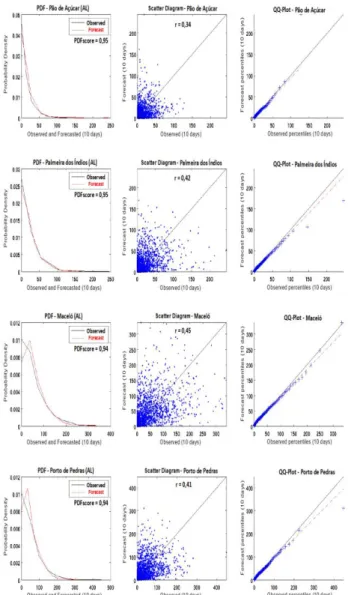
For the validation period 1991-2000, three graphs with different statistical parameters calculated for the aggregate precipitation of 10 days, for Água Branca, Pão de Açucar, Palmeira dos Índios, Maceió and Porto de Pedras are shown (Figure 3). The graph to the left shows the probability density function (PDF) of the observed and predicted data, in order to analyze the similarity of the distributions and infer the quality of the predictions. Within the graph there is the calculated PDFscore value, which serves to precisely measure the degree of overlap between observed and predicted empirical probability density functions, and the closer to 1 the better the functions are adjusted. In the center, there is a scatter diagram between predicted and
247 | Rev. Geama, Recife – 3 (4): 242-251. Out-Dez 2017. | Online version ISSN: 2447-0740 | http://www.geama.ufrpe. observed values, inside it can be seen the value of
r. On the right, a Q-Q plot plot of predicted and observed percentiles that suggests the degree of normality of the estimated percentiles. If the configuration of the points on the graph approaches a straight line the assumption of normality is sustainable and can be put under suspicion if most points deviate from linear behavior. In all the graphs of Figure 6, we can see the correlation between the predicted PDFs and observations, both for the behavior of the curves and for the calculated values of PDFscore, whose lowest value was 0.94 in Água Branca, Maceió and Porto de Pedras, and the highest 0.95 in Pão de Açúcar and Palmeira dos Índios. From the scatter diagrams, it can be seen that most accumulated values lie within a range of up to 100 mm. The ability to predict the extremes better or not significantly reflects the r values, even if the other graphs and measurements indicate confidence in using the predicted data. In this validation period (1991-2000), aggregates of 10 days correspond to 360 deciles. For this size n = 360, the correlations are statistically significant at the 99% confidence level if they are greater than 0.21. From the 5 stations, all values of r were higher than 0.30, in Água Branca (r = 0.32), Pão de Açúcar (r = 0.34), Palmeira dos Índios (r = 0.42), Maceió (r = 0.45) and Porto de Pedras (r = 0.41), and it can be stated that all the forecasts are statistically significant in relation to the observations.
The Q-Q plot graphs of all stations show that the empirical percentiles calculated for the observations and predictions generate straight lines very close to the diagonal line, indicating a perfect quantile distribution. In many cases, the extreme values are highlighted and due to the inefficiency of their predictions, they dictate the deviation of the empirical lines, but without placing under suspicion the hypothesis of normality of the distributions of the calculated percentiles.
Figure 3: In the sequence, probability density functions and PDFscore values on the left, scatter diagrams and r values in the center, and QQ-plot distributions on the right, for observed and predicted precipitation accumulated (mm) in 10 days for the period 1991-2000, for Água Branca, Pão de Açúcar, Palmeira dos Índios, Maceió and Porto de Pedras, respectively.
Similar to the results of Figure 3, for the maximum and minimum temperatures (figures not shown), the statistical analysis of the validation period of the SDMS showed a higher predictive potential for these variables, recalling that the predictors were the same as the precipitation, with the exception of the zonal and meridional components of the wind. The values of r for the maximum temperatures were higher than0.30, in Água Branca (r = 0.81), Pão de Açúcar (r = 0.92), Palmeira dos Índios (r = 0.84), Maceió (r = 0.81) and Porto de Pedras (r = 0.82), and the minimum temperatures were also higher than 0.30, in Água Branca (r = 0.75), Pão de Açúcar (r = 0.77), Palmeira dos Índios (r = 0.75), Maceió (r = 0.48) and Porto de Pedras (r = 0.60).
Estimates of Maize Productivity Losses under Future Climate Change Scenarios.
After the SDSM calibration and validation, the respective estimates of yield losses for the 2021 to 2080 harvests were calculated with the agrometeorological model in the five cities studied. The main input data of the model, precipitation and PET, came from scenarios A1B and A2 for productivity estimates, according to the same planting dates and their respective weighting for annual loss values.
248 | Rev. Geama, Recife – 3 (4): 242-251. Out-Dez 2017. | Online version ISSN: 2447-0740 | http://www.geama.ufrpe. The A1 scenario represents a future of very fast
economic growth, low population growth and rapid introduction of more efficient technologies. There is cultural and economic convergence with the substantial reduction in regional differences in per capita income. The A1 scenario unfolds in three alternative directions of technological change in the energy system: the intensive use of fossil fuels (A1FI), non-fossil sources (A1T) or a balance between sources (A1B). A2 scenario portrays a more heterogeneous world. The underlying theme is to strengthen regional cultural identities, with high population ratios and less interest in rapid economic growth (SRES, 2010).
The graphs in Figure 4 show, for each station, estimates of the annual losses of the ensemble of models in relation to scenario A1B. The increasing trend of annual losses for Água Branca, Pão de Açúcar, Palmeira dos Índios and Maceió (Figure 4a, 4b, 4c, 4d) is a growing trend. Porto de Pedras (Figures 4e) is the only city where the models points to a negative trend of decreasing annual corn yield losses, especially in the second half of the analyzed period, from 2051 to 2080. The graphs in Figure 5 are analogous to those in Figure 4, but for scenario A2, observing the same trends as scenario A1B
Figure 4: Percentage estimate of maize yield loss for A1B scenario for the period 2021-2080 of the ensemble of models with the respective trend line, for (a) Água Branca, (b) Pão de Açucar, (c) Palmeira dos Índios, (d) Maceió and (e) Porto de Pedras, respectively.
249 | Rev. Geama, Recife – 3 (4): 242-251. Out-Dez 2017. | Online version ISSN: 2447-0740 | http://www.geama.ufrpe. Figura 5: Percentage estimate of maize yield loss for
A2 scenario for the period 2021-2080 of the ensemble of models with the respective trend line, for (a) Água Branca, (b) Pão de Açucar, (c) Palmeira dos Índios, (d) Maceió and (e) Porto de Pedras, respectively.
The summary of the average annual losses of the period 2021-2080 is compared to the average values observed for the period 1961-2016 (Table 3). It can be noticed that in Água Branca, Pão de Açúcar and Palmeira dos Índios there is an in increase in the values of losses until near the end of the century. For Maceió, in spite of the positive increasing trend observed mostly in the second half of the series of losses in the two scenarios, the average values of the losses decrease by approximately one percentage point in relation to the observations. The decrease of the most significant productivity losses are observed for Porto de Pedras. In summary, the scenarios have values of losses very close to the two scenarios and indicate a prediction of increased productivity loss in the period 2021-2080 for Água Branca, Pão de Açúcar and Palmeira dos Índios, and decrease of losses, that is, productivity increase, for Maceió and mainly for Porto de Pedras.
This result is directly associated to the predictions of rainfall reduction in the interior of the State, including the cities of Água Branca, Pão de Açúcar and Palmeira dos Índios, a slight increase in rainfall for Maceió and a more significant increase in rainfall in Porto de Pedras (Figures Not shown).
250 | Rev. Geama, Recife – 3 (4): 242-251. Out-Dez 2017. | Online version ISSN: 2447-0740 | http://www.geama.ufrpe. Table 3. Average yield loss observed in the period 1961-2016, and estimated ensemble models for future climate change scenarios A1B and A2 for the period 2021-2080.
Station name Weighted Average Loss Observed 1961-2016
Average loss predicted by the models for scenario A1B, period
2021-2080 Average loss predicted by the models for scenario A2, period 2021-2080
Água Branca 53% 71,3% 70,3% Pão de Açúcar 78% 85,6% 84,5% P. dos Índios 50% 63,5% 63,8% Maceió 30% 29,9% 28,4% Porto de Pedras 49% 27,1% 26,3%
Conclusions
(1) The agrometeorological model used to estimate the yield losses of maize in five municipalities in the State of Alagoas was validated with data from IBGE production for 2000-2010, showing that it is efficient in estimating productivity in a region with low technological potential.
(2) The statistical downscaling method used to generate future precipitation and temperature scenarios for INMET meteorological stations in Alagoas demonstrated extreme ability in simulating the annual cycle of these variables. The climatologies obtained by the models agreed well with the observations of the period 1961-1990. For the validation of the model with 10 days of cumulative precipitation and average temperatures, statistically significant correlations were obtained at the 95% level, higher for maximum temperatures, minimum temperatures and precipitation, in that order.
(3) Future productivity scenarios for the period 2021-2080 were constructed for two climate change scenarios, A1B and A2, for four MCGs, with data from the statistical downscaling technique. The average loss estimates of maize productivity for this future period was compared to the average of the observations of the period 1961-2016, indicating trends of increase of relative losses in Água Branca, Pão de Açúcar and Palmeira dos Índios, and reduction of losses in Maceió and Porto de Pedras..
Acknowledgement
The authors thank INMET for granting the data used for this work.
References
ALLEN, R. G.; PEREIRA, L. S.; RAES, D.; SMITH, M. Crop Evapotranspiration: Guidelines for Computing Crop Water Requirements. FAO Irrigation and Drainage Paper 56, Rome. 1998.
ALVES, J. M. B.; REPELLI, C. A.; MELLO, N. G. A pré-estação chuvosa do setor norte do Nordeste
Brasileiro e sua relação com a temperatura dos oceanos adjacentes. Revista Brasileira de Meteorologia, v. 8, n. 1, 1993.
CHOU, S. C.; LYRA, A.; MOURAO, C.; DERECZYNSKI, C.; PILOTTO, I.; GOMES, J.; BUSTAMANTE, J.; TAVARES, P.; SILVA, A.; RODRIGUES, D.; CAMPOS, D.; CHAGAS, D.; SUEIRO, G.; SIQUEITA, G.; MARENGO, J. Assessment of Climate Change over South America under RCP 4.5 and 8.5 Downscaling Scenarios. American Journal of Climate Change, v. 3, n. 2, 2014.
COLLINS, W. J.; BELLOUIN, N.; DOUTRIAUX-BOUCHER, M.; GEDNEY, N.; HINTON, T. C.; JONES, D.; LIDDICOAT, S.; MARTIN, G.; OCONNOR, F.; RAE, J.; SENIOR, C.; TOTTERDELL, I.; WOODWARD, S. Evaluation of the HadGEM2 model. Meteorological Office Hadley Centre, Technical Note 74, 2008.
DOORENBOS, J; KASSAM, A. H. Yield response to water. Irrigation and Drainage Paper 33, FAO, Roma, 1979, 179 p.
FRANCHITO, S. H.; REYES FERNANDEZ, J. P.; PAREJA, D. Surrogate Climate Change Scenario and Projections with a Regional Climate Model: Impact on the Aridity in South America. American Journal of Climate Change, v. 3, n. 5, 2014.
HARGREAVES, G. H.; SAMANI, Z. A. Reference crop evapotranspiration from temperature. Applied Engineering in Agriculture, v. 1, n. 2, 1985.
HALL, T.; BROOKS, H.; DOSWELL, C. Precipitation forecasting using a neural network. Weather and Forecasting, v. 14, n. 3, 1999.
HAYLOCK, M. R.; PETERSON, T. C.; ALVES, L. M.; AMBRIZZI, T.; ANUNCIAÇÃO, Y. M. T.; BAEZ, J.; BARROS, V. R.; BERLATO, M. A.; BIDEGAIN, M.; CORONEL, G.; CORRADI, V.; GARCIA, V. J.; GRIMM, A. M.; KAROLY, D.; MARENGO, J. A.; MARINO, M. B.; MONCUNILL, D. F.; NECHET, D.; QUINTANA, J.; REBELLO, E.; RUSTICUCCI, M.; SANTOS, J. L.; TREBEJO, I.; VINCENT, L. A. Trends in Total and Extreme South American Rainfall in 1960–2000 and
251 | Rev. Geama, Recife – 3 (4): 242-251. Out-Dez 2017. | Online version ISSN: 2447-0740 | http://www.geama.ufrpe. Links with Sea Surface Temperature. Journal of
Climate, v. 19, n. 15, 2006.
KALNAY, E., and Coauthors. The NCEP/NCAR 40-Year Reanalysis Project. Bulletin of the American Meteorological Society, v. 77, n. 3, 1996.
KÜRBIS, K.; MUDELSEE, M.; TETZLAFF.; BRÁZDIL, R. Trends in extremes of temperature, dew point, and precipitation from long instrumental series from central Europe. Theoretical Applied of Climatology, v. 98, n. 1, 2009.
MARAUN, D.; WETTERHALL, F.; IRESON, A. M.; CHANDLER, R. E.; KENDON, E. J.; WIDMANN, M.; BRIENEN, S.; RUST, H. W.; SAUTER, T.; THEMEL, M.; VENEMA, V. K. C.; CHUN, K. P.; GOODESS, C. M., JONES, R. G.; ONOF, C.; VRAC, M.; THIELE-EICH, I. Precipitation downscaling under climate change: recent developments to bridge the gap between dynamical models and the end user. Reviews of Geophysics, v. 48, p. 1-38, 2010.
MENEZES, H. E. A. Influência da Zona de Convergência Secundária do Atlântico Sul sobre a ocorrência de precipitação no leste do Nordeste brasileiro. 2010. Tese (Doutorado em Meteorologia) - Universidade Federal de Campina Grande, Campina Grande, 2010.
MONTEIRO, J. E. B. A.; AZEVEDO, L. C.; ASSAD, E. D.; SENTELHAS, P. C. Rice yield estimation based on weather conditions and on technological level of production systems in Brazil. Pesquisa Agropecuária Brasileira, v. 48, n. 2, 2013.
MONTEIRO, J. E. B. A.; ASSAD, E. D.; SENTELHAS, P. C.; AZEVEDO, L. C. Modeling of corn yield in Brazil as a function of meteorological conditions and technological level. Pesquisa Agropecuária Brasileira, v. 52, n. 3, 2017.
MURPHY, J. Predictions of climate change over Europe using statistical and dynamical downscaling techniques. International Journal of Climatology, v. 20, n. 5, 2000.
NGUYEN, A. D.; SAVENIJE, H. H. Salt intrusion in multi-channel estuaries: a case study in the Mekong Delta, Vietnam, Hydrology and Earth System Sciences, v. 10, n. 5, 2006.
SAMANI, Z. Estimating Solar Radiation and Evapotranspiration Using Minimum Climatological Data. Journal of Irrigation and Drainage Engineering, v. 126, n. 4, 2000.
SILVA, N. D.; OLIVEIRA, A. S.; BORGES, T. K. S.; GOMES, F. L.; FONSECA, S. S.; GUEDES, F. A.; COUTO, J. P. C. Mapping reference crop evapotranspiration in Bahia, Brazil, using Hargreaves-Samani method. Revista Geama, v. 7, n. 1, 2016.
SILVA, K. E.; BARRETO, T. S. C. P.; SHINOHARA, N. K. S.; ANDRADE, J. S. C.O.; MACHADO, J.Precision Agriculture in the Promotion of Sustainable Development. Revista Geama, v. 9, n. 1, 2017. SKANSI, M.; BRUNET, M.; SIGRÓ, J.; AGUILAR, E.;
GROENING, J. A. A.; BENTANCUR, O. J.; GEIER, Y. R. C, AMAYA, R. L. C.; JÁCOME, H.; RAMOS, A. M.; ROJAS, C. O.; PASTEN, M. A.; MITRO, S. S.; JIMÉNEZ, C. V.; MARTÍNEZ, R.; ALEXANDER, L. V.; JONES, P. D. Warming and wetting signals emerging from analysis of changes in climate extreme indices over South America. Global and Planetary Change, v. 100, n. 1, 2013.
SOLMAN, S. A., NUÑEZ, M. N., CABRÉ, M. F. Regional climate change experiments over southern South America. I: present climate. Climate Dynamics, v. 30, n. 5, 2008.
UPPALA, S., et al. The era-40 re-analysis. Quarterly Journal of The Royal Meteorlogical Society, v. 131, n. 612 PartB, 2005.
WILBY, R. L.; WIGLEY, T. M. L. Downscaling general circulation model output: a review of methods and limitations. Progress in Physical Geography, v. 21, n. 4, 1997.
WILBY, R. L.; CHARLES, S. P.; ZORITA, E.; TIMBAL, B.; WHETTON, P.; MEARNS, L. O. 2014. Guidelines for use of climate scenarios developed from statistical downscaling methods. Access in: 08/03/2017.
Available at:
http://ipcc-ddc.cru.uea.ac.uk/guidelines /dgm_no2_v1_09_2004.pdf.
WILBY, R. L, DAWSON, C. W. User manual for SDSM 4.2, 2007.
ZORITA, E.; HUGHES, J. P.; LETTENMAIER, D. P.; VON STORCH, H. Stochastic characterization of regional circulation patterns for climate model diagnosis and estimation of local precipitation. Journal of Climate, v. 8, n. 5, 1995.
ZORITA, E.; VON STORCH, H. The analog method as a simple statistical downscaling technique: Comparison with more complicated methods. Journal of Climate, v. 12, n. 8 Part 2, 1999.