Repositório ISCTE-IUL
Deposited in Repositório ISCTE-IUL:
2020-07-24
Deposited version:
Post-print
Peer-review status of attached file:
Peer-reviewed
Citation for published item:
Lopes, I. T. (2019). Are intangibles really a source of future economic benefits? Evidence from the technology sector. Measuring Business Excellence. 23 (4), 442-457
Further information on publisher's website:
10.1108/MBE-08-2018-0057
Publisher's copyright statement:
This is the peer reviewed version of the following article: Lopes, I. T. (2019). Are intangibles really a source of future economic benefits? Evidence from the technology sector. Measuring Business
Excellence. 23 (4), 442-457, which has been published in final form at
https://dx.doi.org/10.1108/MBE-08-2018-0057. This article may be used for non-commercial purposes in accordance with the Publisher's Terms and Conditions for self-archiving.
Use policy
Creative Commons CC BY 4.0
The full-text may be used and/or reproduced, and given to third parties in any format or medium, without prior permission or charge, for personal research or study, educational, or not-for-profit purposes provided that:
• a full bibliographic reference is made to the original source • a link is made to the metadata record in the Repository • the full-text is not changed in any way
The full-text must not be sold in any format or medium without the formal permission of the copyright holders.
Serviços de Informação e Documentação, Instituto Universitário de Lisboa (ISCTE-IUL) Av. das Forças Armadas, Edifício II, 1649-026 Lisboa Portugal
Phone: +(351) 217 903 024 | e-mail: [email protected] https://repositorio.iscte-iul.pt
Are Intangibles Really a Source of Future Economic
Benefits? Evidence from the Technology Sector
Abstract
Purpose: Identify the impact of intangibles as drivers of economic future benefits, in the top technological companies in the world. It also aims to identify whether the distribution of those intellectual capital drivers depend on the region and on the accounting standards used in the preparation of firms’ financial reporting.
Design/methodology/approach: Using information from the major technological firms for a range of time of five years, a set of intellectual capital proxies were identified and regressed. Three linear models were used, and hypotheses were performed towards the identification of significant impacts on firms’ turnover prediction.
Findings: A set of intangibles were identified as significant drivers of firms’ turnover. Results suggest that the distribution of those proxies differ among regions and depend on the accounting standards. Firms from North-American evidence higher levels of intangibles, their boards composition is differentiated, additionally tending to increasingly invest in R&D activities.
Research limitations: In spite of the limitations, we underline the sample size. However, the current approach can be replicated over time, and based in other rankings, applicable to other activity sectors and using different metrics.
Practical implications: Based on the major technological firms worldwide, research adds value to the already known scope of intangibles, by providing additional and complimentary outcomes. A new direction, based on the scope of intangibles accounting standards used in the preparation of financial statements, was flagged towards theory and practice alignment.
Originality: This research adds value to the current literature by exploring the effects of intangibles in the major technological companies in the world. Focused in a sector
strongly marked by innovative strategies, it provides a new and complimentary overview.
Article classification: Research paper
1. Scope and research objective
The gap between theory and practice in the field of Intellectual Capital (IC) still remains one of the most unsolved paradigms. Firms tend to capitalize their intangible resources and include them in the statement of financial position, according the international accounting rules. Those resources, whenever capitalized, are associated with future economic benefits, such as operational revenues (turnover) and firms’ market valuation.
This research embodies an accounting approach about intangibles in the technology sector and aims to contribute to the literature by increasing the knowledge of intangibles and certify whether those intangibles are effectively associated with expected future benefits. Furthermore, it complements the research developed by Ferreira (2018), in the scope of the technological sector, which is represented by the major technological firms in the world, however following a strict accounting approach. Hence, it would be an original insight to assess whether the results for this sector corroborate or refute the literature regarding the key role of intangibles on expected future returns, as stated in the main international accounting standards, such as the researches carried out by Lev and Zarowin (1999), Dumay (2016) and Lopes et al. (2016).
This paper provides an accounting perspective about intangibles and their impact on turnover prediction, in particular in a sector strongly marked by technological research activities. Broadly, intangibles were selected as proxies of intellectual capital in order to conclude about its contribution to economic returns, in particular turnover, as the most direct indicator stated in the international accounting standards. The specific objectives consist on (i) investigating the effect of intangibles recognized in the statement of financial position (e.g. Goodwill, Trademarks, Patents, Software, etc.) on firms’ turnover; and (ii) evaluating on what extent some characteristics of the board of directors as a representation of human capital, contribute to predict future economic benefits. Furthermore, it will be determined whether the distribution of those intellectual capital drivers depend on the region and on the accounting standards (e.g. IFRS, SFAS, etc.) used in the preparation of the financial reporting.
2. Theoretical background
Intellectual Capital (IC) was traditionally split into several dimensions (Edvinsson, 2000; Marr et al., 2004; Zéghal and Maaloul, 2010; Kianto et al., 2013; Salchi et al., 2014; Tudor et al., 2014; Shakina and Molodchik, 2014) and introduced in the body of knowledge as the most intangible drivers, not always measured nor internally and externally reported to stakeholders (Cañibano, 2018; Dumay, 2016; Guthrie et al., 2012). Over the last decades, the existing models have been reviewed and improved (Cañibano, 2018; Bini et al., 2016; Yousre et al., 2016; Lentjusenkova and Lapina, 2016; Ferenhof et al., 2015; Giuliani, 2015; Guthrie et al., 2012; Marr et al., 2004;), exploring their structural pillars (classification, measuring, and reporting), based on the main objective of linking intellectual capital (IC) theory and practice. The IC Meta Model provided by Ferenhof et al. (2015) probably represents the newest holistic aggregation and consolidation of IC frameworks, capturing several dimensions of IC (Innovation capital; Processes capital; Technological capital; Organizational capital; Personal Motivations; Interpersonal relationships; Knowledge, skills and attitudes; Agility; Customer capital; Business capital; Social actions; Social interactions) through 83 new models over the period 2004-2014, however all of them typically aligned around the approaches traditionally consolidated and disseminated by Edvinsson and Malone (1997) and by Schiuma et al. (2008), such as Structural Capital, Human Capital, Relational Capital, and Social Capital.
According to accounting standards, intangibles are expected to generate future economic benefits for the organization, which can be expected to positively contribute to the turnover generation and subsequent financial inflows. The literature broadly supports their positive and significant effect on organizational performance, considering intangible assets as the main source of competitive advantage for the firms (Ferreira, 2018; Cañibano, 2018; Grimaldi et al., 2017; Erikson and Rothberg, 2016; Slack and Munz, 2016; Nadeem et al., 2016; Sharma and Dharni, 2016; Lopes et al., 2016; Lopes and Ferraz, 2016; Bubic and Susaz, 2015; Chahal and Bakshi, 2015; Shakina and Molodchik, 2014; Guo et al., 2012; Omil et al., 2011). These studies support the contribution of intangibles to profitability and performance, and their importance has been the main focus of the research in the field of accounting and finance in the last two decades, which emphasizes the relevance of this topic.
Intangibles are strongly linked with intellectual capital and corporate governance literature, in particular the importance of the board of directors as an expression of
competence, professionalism, skills, knowledge, experience, culture and management abilities, to conduct the business (Lopes and Ferraz, 2016; Nath et al., 2015; Wang et al., 2013; Sheikh et al., 2013; Mashayekhi and Bazaz, 2008). Board size is an important attribute of board structure and has been widely used as a proxy for human capital, complementary to other boards’ characteristics which represent the expertise and tacit knowledge of employees and management players. Uadiale (2010) conducted a study to examine the impact of board structure on corporate financial returns, investigating the composition of boards of directors in Nigerian listed firms. The findings evidence that there is a strong positive association between board size and financial returns, encouraging the companies to have a large board size (expertise consolidation) to improve corporate financial performance.
The research of Guo et al. (2012) was based on the influence of IC on the performance of biotech firms listed in the US market, discussing the relationship between intellectual human capital, technology innovation and financial performance. Research and development (R&D) expenditures and patents were also considered as part of technology innovation. The results evidence that human capital (measured by Chief Executive Officer’s (CEO) or Vice President’s compensation and their academic background) and R&D expenses significantly support the current earnings disclosed in financial reports, decreasing performance in terms of cash flow and return on assets. Nonetheless, results evidence that R&D expenses and human capital, increase future stock returns, leveraging performance in the long term. Li and Wang (2014) examined the effect of R&D expenses, sales training and employee benefits Information Technology firms’ return on assets. The results support the assumption that only R&D expenditure and sales training have a positive relation with return on assets, with employee expenses not being significantly correlated.
Ruiqi et al. (2017) examined the relationship between R&D expenditures and future performance in Chinese companies listed on the Main Board of Shanghai and Shenzhen stock exchanges and concluded that those expenditures are essential to improve firms’ returns through the reduction of production costs and through the creation of new products, which constitutes a competitive advantage in a volatile market.
Relating other structural disbursements, a research carried out by Hanssens and Joshi (2010) reinforces the importance of advertising, providing conceptual and empirical evidence of a positive relationship between advertising expenditures and the market value of firms. Advertising has, simultaneously, a direct and indirect impact on
firm value, which contributes to market capitalization. By allowing the firm to create its brand image, advertising helps guarantee firm’s reputation (Tanfous, 2013). The indirect impact of advertising is due to the consequent increase in the level of sales and services (turnover), which will ultimately be reflected in the company’s returns. It can be argued that in sectors in which intangible assets such as patents, software, trademarks, brands, in-progress R&D, among others, have an important influence in the total value of intangible assets, there is a higher degree of uncertainty and a strong vulnerability to market conditions. In comparison, sectors in which intangible assets are protected by formal mechanisms (such as customer contracts, licensing and franchising agreements, and legal rights protection) tend to suffer less from the market’s fluctuations.
Diversity has not always been observed in regard to the relation between intangible assets and performance of the firm across countries. Nevertheless, Sharma and Dharni’s (2016) observed that the majority of researches conducted in the USA, UK, and France establish a negative relationship between the intangible assets and performance of the firm. Other research found no relationship between performance and region (Lopes et al., 2016) and, in a research on whether the IC value was perceived differently across nations, Inkinen et al. (2017) proved the similarity of IC elements across the examined countries, establishing that firms are starting to uniform IC management and, therefore, verify less variation at this level.
In a recent research regarding the effects of IC components on performance, Nadeem et al. (2016) defend that the relationship between IC and organizational performance is bidirectional and therefore should be considered dynamic, stating that lagged firm performance affects current or future IC efficiency. To conclude on this assumption, the authors measured the relationship between IC efficiency and the performance of 774 firms from the London Stock Exchange. The results suggest that VAIC (Value Added Intellectual Coefficient) is positively and significantly related to firm performance, mainly with return on assets and return on equity. When analyzing the IC’s components separately, Nadeem et al. (2016) observed that structural capital and physical capital are critical for firm performance, and human capital was only found significant when using the static approach of Ordinary Least Squares (OLS) regression instead of the dynamic one. These results are congruent with most of the existent studies in the literature regarding the relevance of IC but highlight the importance that is still attributed to physical assets on financial performance. A similar study from Sardo et al.
(2018) analyzed the effect of intellectual capital on small and medium-sized enterprises’ (SMEs) hotel financial performance, using a sample of 934 Portuguese companies. This research adopted the Generalized Method of Moments (GMM) system estimator to analyze a dynamic panel data. The findings suggested that intellectual capital components, i.e., human capital, structural capital and relational capital provide a positive impact on financial performance, with human and structural capitals presenting the higher impact on return on assets. The results support that investments in IC take time to generate profitability and return, stressing that size has a negative impact on financial performance, suggesting that larger companies are less profitable in the hotel industry.
Lopes et al. (2016) have contributed for literature with evidences that demonstrate that, for the top 30 airlines worldwide, intellectual capital drivers, such as intangible assets, are significant in the prediction of ‘the most direct indicator of return’, turnover. The obtained results support the importance of human capital − namely employees’ expenses and benefits and the size of board of directors − and structural capital in the prediction of this indicator of profitability. However, the relationship between IC and other performance indicators, such as ROA, ROE and ROS, could not be validated. They also concluded that only variables associated with financial leverage and scale effects have a significant impact on profitability, with region not playing an important role on performance in this particular activity sector.
Not many studies find evidence on the negative or null impact of intangibles to performance and profitability. Amadieu and Viviani (2010) analyzed the financial statements of 207 SMEs of the wine industry and concluded on a negative impact of intangibility intensity on financial performance, measured by return on assets. The authors state that, in the winery industry, intangible assets are used in an ineffective way and, in order to guarantee financial success, intangible expenses should be accompanied by organizational and managerial changes. Pal and Soriya (2012) compared the IC performance between Indian pharmaceutical and textile industries using VAIC and association of IC with financial indicators such as turnover, ROA, ROE and market to book value. Results evidence that, although both sectors are efficiently using IC, there was no impact of IC on the firms’ productivity, which was measured by turnover. Regarding the other measures of performance, the authors found that profitability measured by ROA increases with IC efficiency. Conversely, ROE is only positively influenced by IC in the case of pharmaceutical industry, due to the fact of it being a
knowledge intensive sector (based on dynamic innovative activities). When analyzing the market valuation of the companies, the authors found no impact of IC, which reflects the lack of consideration of intangibles in the stakeholders’ decision-making process, prioritizing other factors relative to performance.
Lopes and Ferraz (2016) examined 125 non-financial business organizations listed on an Iberian stock exchange with the objective of identifying the impact of IC and the effect of boards’ expertise and knowledge on performance. In this respect, turnover was used as the main performance indicator and return on assets, return on equity and return on sales as complementary measures. The authors concluded on the positive and significant impact of intangibles on turnover of non-financial Iberian companies, not finding empirical evidence to support the impact on the complementary indicators. Regarding the characteristics of the board, the study proved that the size of the board and the participation of the members on other internal or external boards of the organization are significantly associated with turnover.
In their empirical review of the major topics concerning intangible assets, Sharma and Dharni (2016) validate the previous assertions regarding the effect of intangible assets on firm returns across sectors. Those authors observed differences in the contribution of intangibles depending on the sector they are inserted, which they believe may be due to the difference in appropriability of intangibles. This appropriability may differ on account of the protection regimes available across sectors, nature of intangibles and the tendency of firm to leverage intangibles for business efficiency (Sharma and Dharni, 2016).
The diversity of researches carried out on the scope of intangibles have been confirmed the contribution of the invisible side of firms to the generation of expected future benefits. Based on this preliminary assumption, this research looks for corroborative evidence on the scope of technological firms, and by exploring the importance of region and set of accounting standards used in those financial and strategic achievements.
3. Methodology and methods Aims and Objectives
The main purpose of this research is to identify the impact of intangibles on future economic benefits of the top 25 major technological firms worldwide, in line with the international accounting standards. This research paradigm is related to the positive
theory of accounting which allows to test cause-and-effect relationships (Sekaran and Bougie, 2013). Hence, it is based on the prediction power of intangibles recognized and disclosed in the financial reporting, as drivers of potential economic benefits, as stated in the international accounting standards about intangibles.
Data
The sample was selected considering Forbes’ ranking ‘World’s 25 Biggest Tech Companies in 2016’ (Forbes, 2017). The financial information used for this research was collected from companies’ annual financial statements (see Appendix) − specifically from their financial annual reports and corporate governance reports (websites validity confirmed on 02nd July 2019). The financial statements used relates to the period 2013 to 2017, lagged one economic period for the dependent variable (Turnover). Fourteen (56%) of the firms analysed have their headquarters located in North America, 3 (12%) in Europe and 8 (32%) in Asia. Relating accounting standards, 10 (40%) firms use IFRS in their financial reporting and 15 (60%) use other accounting standards (e.g. SFAS). The data was collected in U.S. dollars for all the companies. The ones that had their financial information expressed in different currency measure, all monetary values were converted at the exchange rate mentioned in the corresponding reports.
Variables and theoretical framework
Variables were selected and are summarized in Table 1. The time effect was also considered in the three models used in the current research.
Table 1 – Variables description and framework
VARIABLE DESCRIPTION
TURi(t+1) Logarithm of firm’s turnover in YN+1 IAit
Logarithm of total intangible assets recognized in non-current assets
GWii Logarithm of goodwill recognized in non-current assets LPit
Logarithm of licenses and patents valuation recognized in non-current assets
BTRADii
Logarithm of brands, trade names and trademarks recognized in non-current assets
SRDit
Logarithm of software and research and development disbursements
ADVit Logarithm of advertising expenses BDSIZEit
Size of the board of directors (executive and non-executive members)
BDACit Logarithm of board of directors’ annual compensation EMPit Total number of firm’s employees
LEVit Ratio of total book debts to total assets SIZEit Logarithm of total assets
ASTDit
1 if IFRS adopted in the preparation of financial statements, 0 otherwise
Notes: TUR = Turnover; IA = Intangible assets; GW = Goodwill; LP = Licenses and Patents; BTRAD = Brands, trade names and trademarks; SRD = Software and R&D expenses; ADV = Advertising expenses; BDSIZE = Board of directors; BDAC= Board of directors’ annual compensation; EMP = Employees; LEV = Leverage; SIZE = Firm’s size; ASTD = Accounting standards.
The selected dependent variable was Turnover (Operational Revenues)), in line with accounting standards on intangibles (e.g. IFRS). Thus, Turnover is the indicator which is expected to be the most susceptible to significant effects of intangibles, as this directly measure the economic benefits obtained by a company (Hussinki et al., 2017; Lopes et al., 2016; Bubic and Susak, 2015; Li and Wang, 2014; Tudor et al. 2014; Tanfous, 2013; Gan and Saleh, 2008). The assumption of accounting standards that intangibles are associated with future economic benefits will be supported if a positive and significant impact on these firms’ turnover is verified.
Broadly, intangible resources must be capitalized (included in the statement of financial position) if they are controlled by the owner, if they are identifiable, and if future returns are expected to flow to the entity. Otherwise, their expenditure must be
recognized as an expense (included in the profit and loss statement) when it is incurred, however impacting, as expected, on forthcoming revenues. The variable size of the board of directors was measured through the number of members on the board (Nath et al., 2015; Wang et al., 2013; Sheikh et al., 2013; Uadiale, 2010; Mashayekhi and Bazaz, 2008) and was used, along with the variables board of directors’ annual compensation and total number of organization’s employees, as a proxy to human capital. This study introduces the variable BDAC as a proxy to human capital which intends to represent the expenses incurred with the members of the board in the period under analysis. This variable intends to quantify the value attributed to the knowledge of a firm’s directors. EMP was used due to the assumption that a company is better at value creation if it is more experienced and has more intensity of labour (Shakina and Molodchik, 2014). Since the majority of the firms analyzed are from North America, and European and Asian companies represent 12% and 32% of the sample, respectively, region was split into two different blocks: 1. North-American; 2. Other Regions. The purpose is to identify whether the distribution of the IC drivers depends on the region.
As control variables, total assets was used to represent the firm’s size, in line with previous researches (Ferreira, 2018; Sardo et al., 2018; Lopes et al., 2016; Lopes and Ferraz, 2016; Li and Wang, 2014; Omil et al., 2011) and leverage as an indicator of the proportion of equity and debt the firms use to finance their assets, including intangibles and innovation efforts (Pal and Soriya, 2018; Sardo et al., 2018; Lopes et al., 2016; Tanfous, 2013; Wang et al., 2013).
Regression models
Model 1 aims to explain the effect of intangible assets under the assumption of accounting standards, reflecting the impact of the capitalized intangibles comprised in the firms’ statement of financial position. Model 2 includes characteristics of board of directors, in order to conclude on the contribution of the proxy human capital pillar (as part of intellectual capital) on turnover. Model 3 embodies capitalized and noncapitalized intangible resources (software and R&D expenses and advertising expenses), aiming to identify the disaggregated effects of intangibles on future economic benefits.
Model 1 (effect of intangibles disclosed in firms’ financial position)
Ŷi(t+1) = β0 + β1IAi,t + β2GWi,t + β3LPi,t + β4BTRADi,t + β5LEVi,t + β6SIZEi,t + β7ASTDi,t +
β8Time effectsi,t + εi,t (1)
(i =company = 1, …, 25; t = year = 1, …, 4) Ŷ = TUR
Model 2 (impact of human capital)
Ŷi(t+1) = β0 + β1IAi,t + β2GWi,t + β3LPi,t + β4BTRADi,t + β5BDSIZEi,t + β6BDACi,t + β7EMPi,t + β8LEVi,t + β9SIZEi,t + β10ASTDi,t + β11Time effectsi,t + εi,t (2) (i = 1, …, 25; t = 1, …, 4)
Ŷ = TUR
Model 3 (disaggregated effects of intangibles)
Ŷi(t+1) = β0 + β1GWi,t + β2LPi,t + β3SRDi,t + β4ADVi,t + β5BDSIZEi,t + β6BDACi,t + β7EMPi,t + β8LEVi,t + β9SIZEi,t + β10ASTDi,t + β11Time effectsi,t + εi,t (3) (i = 1, …, 25; t = 1, …, 4)
Ŷ = TUR Hypotheses
Hypothesis 1 (H1): Intangible assets have a positive and significant impact on the performance of the world’s major technological companies.
Hypothesis 2 (H2): Human capital contributes positively to the performance of the world’s major technological companies.
Hypothesis 3 (H3): The disaggregation of intangibles has a positive impact on the performance of the world’s major technological companies.
Hypothesis 4 (H4): SRD and ADV contribute positive and significantly to the performance of the world’s major technological companies.
Hypothesis 5 (H5): The distribution of the intellectual capital drivers of the North-American region is convergent with the distribution of the intellectual capital drivers of the remaining regions.
Hypothesis 6 (H6): The distribution of the intellectual capital drivers for the companies adopting IFRS is convergent with the distribution of the intellectual capital drivers for firms adopting other accounting standards.
4. Results and discussion Descriptive measures
The sample integrates the top 25 technological firms. Thus, 100 observations were expected, although only 97 were effectively verified due to the absence of annual reports for three companies in specific economic periods.
Table 2 – Descriptive measures
Variable N Minimum Maximum Mean Std. Deviation TUR 97 8.975 12.362 10.5667 0.8697 IA 97 0.000 9.477 7.3237 1.7119 GW 97 2.950 11.122 8.5267 1.7452 LP 76 0.000 9.295 5.6923 1.8986 BTRAD 57 243 97,040 22,614.53 25,848.71 SRD 97 3.440 10.027 8.2238 1.2075 ADV 86 2.079 9.319 6.1889 1.8916 BDSIZE 97 5 15 10.0800 2.2210 BDAC 92 9.307 18.198 14.7883 1.9562 EMP 96 7,333 830,174 128,011.09 145,404.944 LEV 97 0.064 1.134 0.4627 0.2061 SIZE 97 9,262 13.393 11.0866 0.8441
It is possible to verify (Table 2) that, when measuring the firms’ performance through turnover, each company registered a mean of 10.57 with 0.87 of standard deviation. Regarding the independent variables, the proxies of human capital reveal a BDAC of, in mean, 14.79 (standard deviation = 1.96) with the board size being constituted by, in mean, 10 people (standard deviation = 2) and firms having a mean of 128,011 employees (standard deviation = 145,405 people). Relating the remaining intangibles, GW is the one with the higher mean of 8.53 (standard deviation = 1.75) followed by SRD with a mean of 8.22 (standard deviation = 1.21). The variables with lower means are BTRAD and LP, with means of 4.87 (standard deviation = 2.19) and 5.62 (standard deviation = 2), respectively.
Bivariate correlations
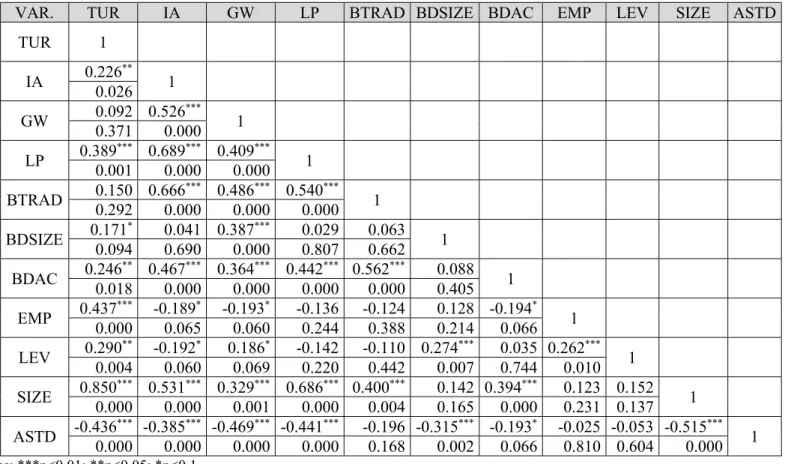
As stated in Table 3 relatively to the intangibles disclosed in firms’ financial position, IA and LP are positive and significantly associated with TUR (r = 0.226; p = 0.026 and r = 0.389; p = 0.001, respectively). Table 4 introduces the human capital proxies and translates the significant and positive relation between BDSIZE (r = 0.171; p = 0.094), BDAC (r = 0.246; p = 0.018) and EMP (r = 0.437; p < 0.001) and TUR. Interestingly, EMP evidences a significantly negative correlation with BDAC (r = -0.194; p = 0.066), which suggests that the firms with more employees, offer their board of directors a lower annual compensation.
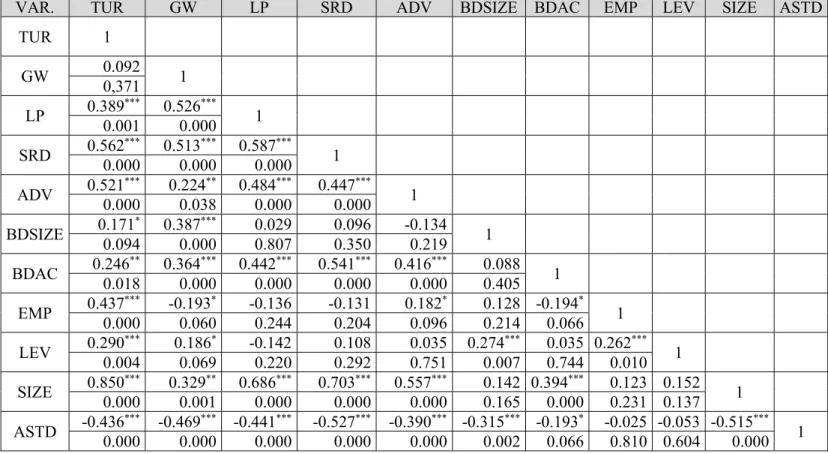
Table 5 illustrates that SRD and ADV are significant and positively correlated with TUR (r = 0.562; p < 0.001 and r = 0.521; p < 0.001, respectively). Corroborating the studies conducted by Sridhar et al. (2014) and Mizik and Jacobson (2003), a positive relationship was found between SRD and ADV (r = 0.447; p < 0.001). SRD and ADV have a positive and strong correlation with the firms’ size (r = 0.703; p < 0.001 and r = 0.557; p < 0.001, respectively), suggesting that larger firms expend more in R&D and advertising. BDAC is, likewise, positively correlated with the size of the firm (r = 0.394; p < 0.001), indicating that larger companies offer a higher annual compensation to their directors. Moreover, and as expected, the size of the firm is positively related to turnover (r = 0.850; p < 0.001), reflecting the scale effects.
Table 3 – Pearson correlation coefficients (Model 1)
VAR. TUR IA GW LP BTRAD LEV SIZE ASTD
TUR 1 IA 0.226** 1 0.026 GW 0.092 0.526*** 1 0,371 0.000 LP 0.389*** 0.689*** 0.409*** 1 0.001 0.000 0.000 BTRAD 0.150 0.6660.292 0.000 *** 0.486 0.5400.000 0.000 *** 1 LEV 0.290*** -0.192 0.186* -0.142 -0.110 1 0.004 0.060* 0.069 0.220 0.442 SIZE 0.8500.000 *** 0.5310.000 *** 0.3290.001 *** 0.6860.000 *** 0.4000.004 0.137 *** 0.152 1 ASTD -0.436*** -0.385*** -0.469*** -0.441*** -0.196 -0.053 -0.515*** 1 0.000 0.000 0.000 0.000 0.168 0.604 0.000 Notes: ***p<0.01; **p<0.05; *p<0.1
Table 4 - Pearson correlation coefficients (Model 2)
VAR. TUR IA GW LP BTRAD BDSIZE BDAC EMP LEV SIZE ASTD
TUR 1 IA 0.226** 1 0.026 GW 0.092 0.526*** 1 0.371 0.000 LP 0.389*** 0.689*** 0.409*** 1 0.001 0.000 0.000 BTRAD 0.150 0.6660.292 0.000 *** 0.4860.000 *** 0.5400.000 *** 1 BDSIZE 0.171* 0.041 0.387*** 0.029 0.063 1 0.094 0.690 0.000 0.807 0.662 BDAC 0.2460.018 ** 0.4670.000 *** 0.3640.000 *** 0.4420.000 *** 0.5620.000 *** 0.088 0.405 1 EMP 0.437*** -0.189* -0.193* -0.136 -0.124 0.128 -0.194* 1 0.000 0.065 0.060 0.244 0.388 0.214 0.066 LEV 0.290** -0.192* 0.186* -0.142 -0.110 0.274*** 0.035 0.262*** 1 0.004 0.060 0.069 0.220 0.442 0.007 0.744 0.010 SIZE 0.850*** 0.531*** 0.329*** 0.686*** 0.400*** 0.142 0.394*** 0.123 0.152 1 0.000 0.000 0.001 0.000 0.004 0.165 0.000 0.231 0.137 ASTD -0.436*** -0.385*** -0.469*** -0.441*** -0.196 -0.315*** -0.193* -0.025 -0.053 -0.515*** 1 0.000 0.000 0.000 0.000 0.168 0.002 0.066 0.810 0.604 0.000 Notes: ***p<0.01; **p<0.05; *p<0.1
Table 5 - Pearson correlation coefficients (Model 3)
VAR. TUR GW LP SRD ADV BDSIZE BDAC EMP LEV SIZE ASTD
TUR 1 GW 0.092 1 0,371 LP 0.389*** 0.526*** 1 0.001 0.000 SRD 0.562*** 0.513*** 0.587*** 1 0.000 0.000 0.000 ADV 0.521*** 0.224** 0.484*** 0.447*** 1 0.000 0.038 0.000 0.000 BDSIZE 0.171* 0.387*** 0.029 0.096 -0.134 1 0.094 0.000 0.807 0.350 0.219 BDAC 0.246** 0.364*** 0.442*** 0.541*** 0.416*** 0.088 1 0.018 0.000 0.000 0.000 0.000 0.405 EMP 0.437*** -0.193* -0.136 -0.131 0.182* 0.128 -0.194* 1 0.000 0.060 0.244 0.204 0.096 0.214 0.066 LEV 0.290*** 0.186* -0.142 0.108 0.035 0.274*** 0.035 0.262*** 1 0.004 0.069 0.220 0.292 0.751 0.007 0.744 0.010 SIZE 0.850*** 0.329** 0.686*** 0.703*** 0.557*** 0.142 0.394*** 0.123 0.152 1 0.000 0.001 0.000 0.000 0.000 0.165 0.000 0.231 0.137 ASTD -0.436*** -0.469*** -0.441*** -0.527*** -0.390*** -0.315*** -0.193* -0.025 -0.053 -0.515*** 1 0.000 0.000 0.000 0.000 0.000 0.002 0.066 0.810 0.604 0.000 Notes: ***p<0.01; **p<0.05; *p<0.1
Model 1, which demonstrates the effect of intangibles disclosed in firms’ financial position was validated for the dependent variable (adjusted R2 = 92.8%; F = 15.534; p < 0.001). Model 2, aiming to verify the impact of the human capital proxies, was also validated for TUR (adjusted R2 = 93.4%; F = 13.590; p = < 0.001). Model 3, representing the disaggregated effects of intangibles, was also validated for TUR (adjusted R2 = 96.1%; F = 47.775; p < 0.001).
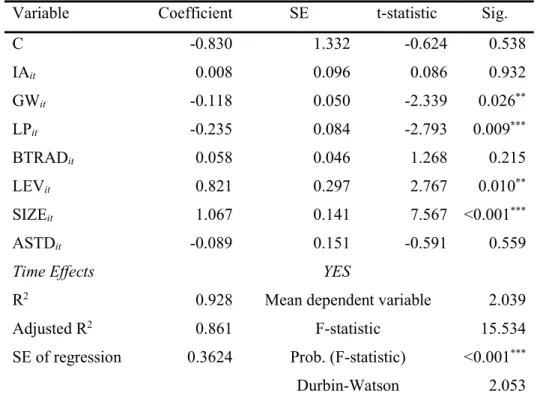
Table 6 – Regression Model 1
Variable Coefficient SE t-statistic Sig.
C -0.830 1.332 -0.624 0.538 IAit 0.008 0.096 0.086 0.932 GWit -0.118 0.050 -2.339 0.026** LPit -0.235 0.084 -2.793 0.009*** BTRADit 0.058 0.046 1.268 0.215 LEVit 0.821 0.297 2.767 0.010** SIZEit 1.067 0.141 7.567 <0.001*** ASTDit -0.089 0.151 -0.591 0.559
Time Effects YES
R2 0.928 Mean dependent variable 2.039
Adjusted R2 0.861 F-statistic 15.534
SE of regression 0.3624 Prob. (F-statistic) <0.001*** Durbin-Watson 2.053 Notes: ***p<0.01; **p<0.05; *p<0.1
Notes: TUR = Turnover; IA = Intangible assets; GW = Goodwill; LP = Licenses and Patents; BTRAD = Brands, trade names and trademarks; LEV = Leverage; SIZE = Firm’s size; ASTD = Accounting standards.
Table 7 – Regression Model 2
Variable Coefficient SE t-statistic Sig.
C ~0.715 1,475 -0.485 0.632 IAit -0.109 0.064 -2.703 0.019*** GWit -0.027 0.061 -0.437 0.666 LPit -0.027 0.047 -1.178 0.249 BTRADit --0.055 0.055 0.782 0.441 BDSIZEit 0.025 0.029 0.861 0.397 BDACit -0.029 0.049 -0.178 0.860 EMPit <0.001 <0.001 3.543 0.002*** LEVit 0.558 0.311 1.782 0.085* SIZEit 1.061 0.168 6.308 <0.001*** ASTDit -0.097 0.142 -0.683 0.501
Time Effects YES
R2 0.934 Mean dependent variable 1.629
Adjusted R2 0.872 F-statistic 13.590
SE of regression 0.3462 Prob. (F-statistic) <0.001*** Durbin-Watson 2.089 Notes: ***p<0.01; **p<0.05; *p<0.1
Notes: TUR = Turnover; IA = Intangible assets; GW = Goodwill; LP = Licenses and Patents; BTRAD = Brands, trade names and trademarks; BDSIZE = Board of directors; BDAC= Board of directors’ annual compensation; EMP = Employees; LEV = Leverage; SIZE = Firm’s size; ASTD = Accounting standards.
The results obtained in the first model allow to conclude that, relating the independent explanatory variables that are statistically significant, GW has the highest impact in explaining the firms’ returns, presenting a negative relation with TUR (standardized β = -0.118; p = 0.026), contradicting the expected signal of H1. The remaining variables representing intangible assets, namely IA (standardized β = 0,008; p = 0.215), LP (standardized β = -0.235; p = 0.009) and BTRAD (standardized β = 0.058; p = 0.780) are not statistically significant to explain the model, which leads to the rejection of H1 due to the mixed signals evidenced. As expected, considering the literature review, the control variables LEV (standardized β = 0.821; p = 0.01) and SIZE (standardized β = 1.067; p < 0.001) are positive and statistically significant in the prediction of TUR.
Regarding the quality of the model evaluated by its explanatory capacity, the results of adjusted R2 evidence that Model 1 explains in 92.8% the variance of the dependent variable turnover.
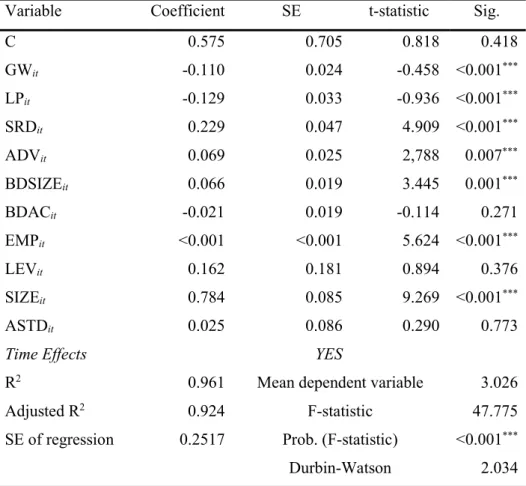
Table 8 – Regression Model 3
Variable Coefficient SE t-statistic Sig.
C 0.575 0.705 0.818 0.418 GWit -0.110 0.024 -0.458 <0.001*** LPit -0.129 0.033 -0.936 <0.001*** SRDit 0.229 0.047 4.909 <0.001*** ADVit 0.069 0.025 2,788 0.007*** BDSIZEit 0.066 0.019 3.445 0.001*** BDACit -0.021 0.019 -0.114 0.271 EMPit <0.001 <0.001 5.624 <0.001*** LEVit 0.162 0.181 0.894 0.376 SIZEit 0.784 0.085 9.269 <0.001*** ASTDit 0.025 0.086 0.290 0.773
Time Effects YES
R2 0.961 Mean dependent variable 3.026
Adjusted R2 0.924 F-statistic 47.775
SE of regression 0.2517 Prob. (F-statistic) <0.001*** Durbin-Watson 2.034 Notes: ***p<0.01; **p<0.05; *p<0.1
Notes: TUR = Turnover; IA = Intangible assets; GW = Goodwill; LP = Licenses and Patents; BTRAD = Brands, trade names and trademarks; SRD = Software and R&D expenses; ADV = Advertising expenses; BDSIZE = Board of directors; BDAC= Board of directors’ annual compensation; EMP = Employees; LEV = Leverage; SIZE = Firm’s size; ASTD = Accounting standards.
SRD and ADV evidence a positive and significant impact on TUR (standardized β = 0.229, p < 0.001; standardized β = 0.069, p = 0.007, respectively), with SRD being the independent variable that contributes the most to explain future economic benefits. Thus, H4 cannot be rejected.
When assessing the disaggregated effects of intangibles, the human capital proxies utilized in this research were found to be positive and significantly explainable of turnover in the case of BDSIZE (standardized β = 0.066; p < 0.001) and EMP (standardized β < 0.001; p < 0.001), not rejecting H2. Contrarily, BDAC was found not to be statistically significant in the prediction of TUR (standardized β = -0.021; p = 0.271) causing the rejection of hypothesis 2 for this variable. Since the intangible assets evidence a negative impact on TUR and human capital proxies present mixed effects, no conclusions can be taken regarding H3, which cannot be broadly validated.
Although SIZE is positive and significantly associated with TUR (standardized β = 0.784; p < 0.001), contrarily to the observations on models 1 and 2, LEV was excluded from the significant variables (standardized β = 0.162; p = 0.376).
Distribution of the intellectual capital drivers (Region and Accounting Standards)
In order to complement the statistical analysis, t-test for equality of means was performed for the different regions. The sample of 25 technological companies consists of 14 companies from North-America (56%), 3 from Europe (12%) and 8 from Asia (32%), which were split into two different groups: North-American companies (56%) and non-North-American companies (44%).
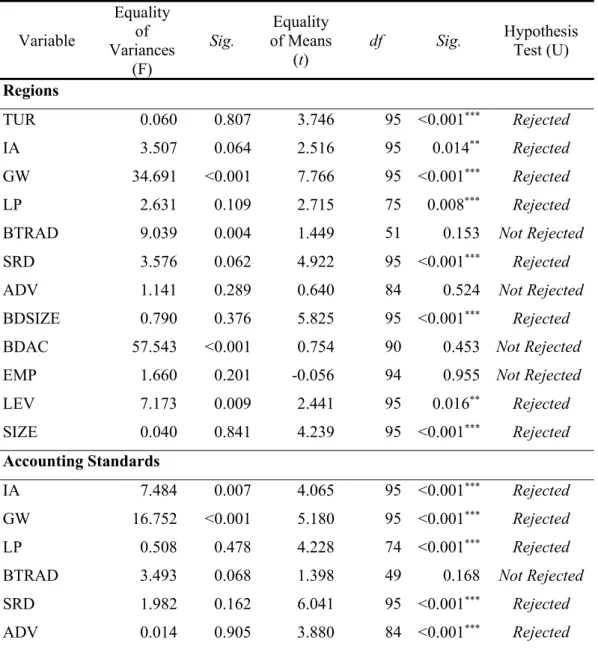
Table 9 – Comparison between Regions and between Accounting Standards
Variable Equality of Variances (F) Sig. Equality of Means (t)
df Sig. Hypothesis Test (U)
Regions
TUR 0.060 0.807 3.746 95 <0.001*** Rejected
IA 3.507 0.064 2.516 95 0.014** Rejected
GW 34.691 <0.001 7.766 95 <0.001*** Rejected
LP 2.631 0.109 2.715 75 0.008*** Rejected
BTRAD 9.039 0.004 1.449 51 0.153 Not Rejected
SRD 3.576 0.062 4.922 95 <0.001*** Rejected
ADV 1.141 0.289 0.640 84 0.524 Not Rejected
BDSIZE 0.790 0.376 5.825 95 <0.001*** Rejected BDAC 57.543 <0.001 0.754 90 0.453 Not Rejected
EMP 1.660 0.201 -0.056 94 0.955 Not Rejected
LEV 7.173 0.009 2.441 95 0.016** Rejected SIZE 0.040 0.841 4.239 95 <0.001*** Rejected Accounting Standards IA 7.484 0.007 4.065 95 <0.001*** Rejected GW 16.752 <0.001 5.180 95 <0.001*** Rejected LP 0.508 0.478 4.228 74 <0.001*** Rejected
BTRAD 3.493 0.068 1.398 49 0.168 Not Rejected
SRD 1.982 0.162 6.041 95 <0.001*** Rejected ADV 0.014 0.905 3.880 84 <0.001*** Rejected
BDSIZE 0.383 0.538 3.237 95 0.002*** Rejected BDAC 14.048 <0.001 1.861 90 0.066* Rejected
Notes: ***p<0.01; **p<0.05; *p<0.1
The null hypothesis assumes that the distribution of the intellectual capital drivers of the North-American region is convergent between regions and between accounting standards adoption. Observing the evidences stated in Table 9, there is statistical evidence to reject H0 for the variables TUR, IA, GW, LP, SRD, BDSIZE, and control variables SIZE and LEV, proving these variables present different distributions depending on the region (hypothesis H5). In fact, these variables display significantly higher means when considering the North-American region.
From the variables that rejected the null hypothesis, it is possible to observe that TUR has a higher mean in the North-American companies (mean = 10.84) than in the European and Asian ones (mean = 10.21). Furthermore, all the intangible assets disclosed in firms’ financial position, with the exception of BTRAD, reflect a higher mean for North-America in comparison with the non-American region. Of the human capital proxies, BDSIZE is the only whose distribution is different between regions, with North-American companies having, in mean, 11 directors on the boards and the remaining firms having, in mean, 9 people representing their board of directors. SRD also shows a higher mean in the case of North-American companies (mean = 8.70) versus the remaining regions (mean = 7.60), which can reflect a superior investment in research and development from U.S. companies.
Relating the accounting standards adoption for intangibles recognition and measurement, the rejection of the null hypothesis for the intangibles included in the three models, highlights that intangibles recognition and measurement depend on the accounting standards used in the preparation of the financial statements (hypothesis H6). Thus, a new direction of research is signalized in order to explore the convergence, in particular between firms using IFRS and firms using other accounting standards.
5. Concluding remarks
Model 1, which reflects the impact of the capitalized intangibles comprised in the companies’ statement of financial position, evidenced a negative contribution of GW to TUR, with the remaining intangible assets not being significant to explain turnover. The negative signal of GW is supported by Heiens et al. (2007) and may be due to the assets not translating the economic benefits expected by firms. Model 2 includes characteristics of the boards of
directors in order to conclude on the contribution of human capital to firms’ future returns. EMP evidenced a positive impact on TUR, confirming the proposition of Shakina and Molodchik (2014), although no significant relation was found between the remaining human capital variables and performance in this model. The aggregated measure of intangible assets (IA) evidenced a negative impact on TUR. Model 3 embodies intangible assets along with intangible resources (software and R&D expenses and advertising expenses) and human capital, aiming to identify the disaggregated effects of intangibles on turnover. In this model, GW and LP evidenced a significant, although negative, impact on TUR, reflecting isolated effects that were not captured in Model 2, where the total amount of intangible assets can explain the variance observed for turnover. Similarly, the human capital proxy BDSIZE becomes relevant to estimate TUR, suggesting that when considered alongside disaggregated measures of intangibility, the size of board of directors becomes important to enhance expected returns. Although this model’s results do not allow the validation of hypotheses regarding the disaggregated influence of intangibles, an isolated effect can be observed for some variables, exhibiting synergetic effects when considered together. Model 3 also includes the variables SRD and ADV, both contributing to operational economic revenues measured through TUR.
This paper also assesses whether the distribution of the intangibles (intellectual capital drivers) depends on the region of the firm by splitting the sample in two groups and comparing the means of the North-American region with the remaining regions. Results suggest that the distribution of intellectual capital is different among regions for the variables IA, GW, LP, BDSIZE and SRD, as well as for the indicator TUR and control variables. These variables evidence higher means for the North-American region, which indicates that U.S. companies have higher levels of IA, GW and LP, their boards are generally constituted by more members and they tend to invest more in R&D activities. North American firms also present a higher mean regarding the size and turnover of the business, implying that those firms are larger than European and Asian ones, and have higher levels of economic returns. Furthermore, this research also suggests that the capitalization of intangible resources can be associated with the accounting standards used in the preparation of the financial statements. This evidence can serve as a starting step for further developments on the topic.
Regarding suggestions for future research, it would be interesting to explore other variables as intangibles and human capital proxies in order to determine if it would originate different results for this sample. Moreover, the study would benefit from an analysis over a
longer period and for a larger sample, in order to conclude on the impact of intellectual capital on future economic returns.
Bibliography
Amadieu, P. and Viviani, J. L. (2010), “Intangible effort and performance: The case of the French wine industry”, Agribusiness, Vol. 26, No. 2, pp. 280–306.
Barney, J. (1991), “Firm resources and sustained competitive advantage”, Journal of Management, Vol. 17, No. 1, pp. 99-120.
Bini, L., Dainelli, F. and Giunta, F. (2016), “Business model disclosure capital in the Strategic Report: Entangling intellectual capital in value creation process”, Journal of Ingtellectual Capital, Vol. 17 No.1, pp. 83-102.
Bubic, J. and Susak, T. (2015), The impact of intangible assets on financial performance of Croatian companies. Paper presented at the Ninth International Scientific Conference on Economic and social Development, Istanbul.
Cañibano, L. (2018), “Accounting and Intangibles”, Spanish Accounting Review, Vol. 21, No. 1, pp. 1-6.
Chahal, H. and Bakshi, P. (2015), “Examining intellectual capital and competitive advantage relationship: Role of innovation and organizational learning”, International Journal of Bank Marketing, Vol. 33 No. 3, pp. 376-399.
Dumay, J. (2016), “A critical reflection on the future of intellectual capital”, Journal of Intellectual Capital, Vol. 17, No. 1, pp. 10-25.
Edvinsson, L. and Malone, M. (1997), Intellectual capital: The proven way to establish your company’s real value by measuring its hidden brainpower. London: Judy Piatkus Limited. Erikson, S. and Rothberg, H. N. (2016), “Intangible dynamics in financial services”, Journal of Services Theory and Practice, Vol. 26 No.5, pp. 642-656.
Ferenhof, H. A., Durst, S., Bialecki, M. Z. and Selig, P. M. (2015), “Intellectual capital dimensions: state of the art in 2014”, Journal of Intellectual Capital, Vol. 16 No. 1, pp. 58-100.
Ferreira, C. F. (2018). “The Impact of Intangibles on the Performance of the Major Technological Companies in the World”, Msc. Dissertation, Lisbon: ISCTE-IUL.
Forbes. 2017. World’s 25 Biggest Tech Companies in 2016, available at
https://www.forbes.com/pictures/57462056a7ea4353698e2b4b/worlds-25-biggest-tech-co/#24acdb030a7d (accessed 25 July 2018).
Gan, K. and Saleh, Z. (2008), “Intellectual capital and corporate performance of technology-intensive companies: Malaysia evidence”, Asian Journal of Business and Accounting, Vol. 1, No 1, pp. 113-130.
Giuliani, M. (2015), “Intellectual Capital dynamics: seeing them “in practice” through a temporal lens”, VINE, Vol. 45 No. 1, pp. 46-66.
Gleason, K. I., and Klock, M. (2006), “Intangible capital in the pharmaceutical and chemical industry”, The Quarterly Review of Economics and Finance, Vol. 46, No. 2, pp. 300-314. Grimaldi, M., Corvello, V., De Mauro, A. and Scarmozzino, E. (2017), “A systematic literature review on intangible assets and open innovation”, Knowledge Management Research and Practice, Vol. 15, No. 1, pp. 90-100.
Guo, W. C., Huo, S. R., and Chien, W. J. (2012), “A study on intellectual capital and firm performance in biotech companies”, Applied Economics Letters, Vol. 19, No. 16, pp. 1603-1608.
Guthrie, J., Ricceri, F. and Dumay, J. (2012), “Reflections and projections: A decade of intellectual capital accounting research”, British Accounting Review, Vol. 44, No. 2, pp. 68-82.
Hanssens, D. M. and Joshi, A. (2010), “The direct and indirect effects of advertising spending on firm value”, Journal of Marketing, Vol. 74, No. 1, pp. 20–33.
Heiens, R., Leach, R. T. and Mcgrath, L. C. (2007). “The contribution of intangible assets and expenditures to shareholder value”, Journal of Strategic Marketing, Vol. 15, No. 1, pp. 149-159.
Hussinki, H., Ritala, P., Vanhala, M. and Kianto, A. (2017). Intellectual Capital Profiles and Financial Performance of the Firm. In J. Guthrie, J. Dumay, F. Ricceri & C. Nielsen (Eds.), The Routledge Companion to Intellectual Capital, London, pp. 450-462.
Ilmakunnas, P. and Peikkola, H. (2014), “Intangible investment in people and productivity”, Journal of Productivity Analysis, Vol. 41, No. 1, pp. 443–456.
Inkinen, H., Kianto, A., Vanhala, M. and Ritala, P. (2017), “Structure of intellectual capital - an international comparison”, Accounting, Auditing & Accountability Journal, Vol. 30, No. 5, pp. 1160-1183.
Kianto, A., Ritala, P., Spender, J.-C. and Vanhala, M. (2014), “The interaction of intellectual capital assets and knowledge management practices in organizational value creation”, Journal of Intellectual Capital, Vol. 15, No. 3, pp. 362-375.
Lentjusenkova, O. and Lapina, I. (2016), “The transformation of the organization’s intellectual capital: from resource to capital”, Journal of Intellectual Capital, Vol. 17 No. 4, pp. 610-631.
Lev, B. and Zarowin, P. (1999), “The boundaries of financial reporting and how to extend them”, Journal of Accounting Research, Vol. 37, No. 2, pp. 353-385.
Li, H. and Wang, W. (2014), “Impact of intangible assets on profitability of Hong Kong listed information technology companies”, Business and Economic Research, Vol. 4, No. 2, pp. 98-113.
Lome, O., Heggeseth , A. G. and Moen, Ø. (2016), “The effect of R&D on performance: Do R&D-intensive firms handle a financial crisis better?”, Journal of High Technology Management Research, Vol. 27, No. 1, pp. 65–77.
Lopes, I. T. and Ferraz, D. P. (2016), “The value of intangibles and diversity on boards looking towards economic future returns: evidence from non-financial Iberian business organisations”, International Journal of Business Excellence, Vol. 10, No. 3, pp. 392-417. Lopes, I. T., Ferraz, D. P. and Rodrigues A.M.G. (2016), “The drivers of profitability in the top 30 major airlines worldwide”, Measuring Business Excellence, Vol. 20, No. 2, pp. 26-37. Marr, B., Shiuma, g. and Neely, A. (2004), “Intelectual capital: defining key performance indicators for organizational knowledge assets”, Business Process Management Journal, Vol. 10 No. 5, pp. 551-569.
Mashayekhi, B. and Bazaz, M. S. (2008), “Corporate governance and firm performance in Iran”, Journal of Contemporary Accounting & Economics, Vol. 4, No. 2, pp. 156–172.
Nadeem, M., Gan, C., and Nguyen, C. (2016), “Intellectual capital and firm performance: Static or dynamic estimation: Evidence from the UK”, Paper presented at the 8th European Conference on Intellectual Capital, Italy.
Nath, S. D., Islam, S. and Saha A. K. (2015), “Corporate board structure and firm performance: The context of pharmaceutical industry in Bangladesh”, International Journal of Economics and Finance, Vol. 7, No. 7, pp. 106-115.
Omil, J. C., Lorenzo, P. C. and Liste, A. V. (2011), “The power of intangibles in high-profitability firms”, Total Quality Management, Vol. 22, No. 1, pp. 29–42.
Pal, K. and Soriya, S. (2012). “IC performance of Indian pharmaceutical and textile industry”, Journal of Intellectual Capital, Vol. 13, No. 1, pp. 120-137.
Pucci, T., Simoni, C. and Zanni, L. (2015), “Measuring the relationship between marketing assets, intellectual capital and firm performance”, Journal of Management and Governance, Vol. 19, No. 1, pp. 589–616.
Ruiqi, W., Wang, F. Xu, L. and Yuan, C. (2017), “R&D expenditures, ultimate ownership and future performance: Evidence from China”, Journal of Business Research, Vol. 71, No. 1, pp. 47–54.
Salehi, M., Enayati, G. and Javadi, P. (2014), “The relationship between Intellectual Capital with Economic Value Added and Financial Performance”, Iranian Journal of Management Studies, Vol. 7, No. 2, pp. 259-283.
Sardo, F., Serrasqueiro, Z. And Alves, H. (2018). “On the relationship between intellectual capital and financial performance: A panel data analysis on SME hotels”, International Journal of Hospitality Management, Vol. 75, No. 1, pp. 67–74.
Sekaran, U. and Bougie, R. (2013), Research Methods for Business: A Skill-Building Approach, Sixth Edition, Chichester: John Wiley & Sons.
Shakina, E. & Molodchik, M. (2014), “Intangible-driven value creation: supporting and obstructing factors”, Measuring Business Excellence, Vol. 18, No. 3, pp. 87-100.
Slack, R. and Munz, M. (2016), “Intellectual capital reporting, leadership and strategic change”, Journal of Applied Accounting Research, Vol. 17 No.1, pp. 61-83.
Schiuma, G., Lerro, A. and Sanitate, D. (2008), “The intellectual capital dimensions of Ducati’s turnaround: exploring knowledge assets grounding a change management program”, International Journal of Innovation Management, Vol. 12 No. 22, pp. 161-193.
Sharma, S. and Dharni, K. (2016), “Measurement, management and reporting of intangible assets: A review”, Journal of Commerce & Accounting Research, Vol. 5, No. 4, pp. 56-69. Sheikh, N. A., Wang, Z. and Khan, S. (2013), “The impact of internal attributes of corporate governance on firm performance: Evidence from Pakistan”, International Journal of Commerce and Management, Vol. 23, No. 1, pp. 38–55.
Sridhar, S., Narayanan, S. and Srinivasan, R. (2014), “Dynamic relationships among R&D, advertising, inventory and firm performance”, Journal of the Academy Marketing Science, Vol. 42, No. 1, pp. 277–290.
Sveiby, K. E. (1997), The new organizational wealth: Managing & measuring knowledge-based assets. San Francisco: Berrett-Koehler Publishers.
Tanfous, M.B. (2013), “The contribution of intangibles to value creation”, Journal of Business Studies Quarterly, Vol. 5, No. 1, pp. 43-75.
Tudor, A. T., Dima, S., Dima, B. and Ratiu, R. V. (2014), “The linkage between intangibles and profitability”, Annales Universitatis Apulensius Sefries Oeconomica, Vol. 16 No. 1, pp. 283-293.
Uadiale, O. M. (2010), “The impact of board structure on corporate financial performance in Nigeria”, International Journal of Business and Management, Vol. 5, No. 10, pp. 155-166. Wang, Y.C., Tsai, J.-J. and Lin H.-W. W. (2013), “The influence of board structure on firm performance”, The Journal of Global Business Management, Vol. 9, No. 2, pp. 7-14.
Yousre, M. D., Badir, Z. A. and Tariq, A. (2016), “The impact of intellectual capital on innovation generation and adoption”, Journal of Intellectual Capital, Vol. 17 No. 4, pp. 675-695.
Zéghal, D. and Maaloul, A. (2010), “Analyzing value added as an indicator of intellectual capital and its consequences on company performance”, Journal of Intellectual Capital, Vol. 11, No. 1, pp. 39-60.
Appendix
1. Apple (https://investor.apple.com/investor-relations/default.aspx)
2. Samsung Electronics (https://www.samsung.com/global/ir/)
3. Microsoft (https://www.microsoft.com/en-us/Investor/annual-reports.aspx)
4. Alphabet (https://abc.xyz/investor/)
5. IBM (https://www.ibm.com/investor/financials/financial-reporting.html)
6. Intel (
https://www.intc.com/investor-relations/financials-and-filings/annual-reports-and-proxy/default.aspx)
7. Cisco Systems (https://www.cisco.com/c/en/us/about/annual-reports.html)
8. Oracle (http://www.annualreports.com/Company/oracle-corporation)
9. Hon Hai Precision
(http://quicktake.morningstar.com/stocknet/secdocuments.aspx?symbol=2317&country=twn)
10. Taiwan Semiconductor (https://www.tsmc.com/english/investorRelations/annual_reports.htm#)
11. Hewlett-Packard Enterprise (https://investors.hpe.com/financial/annual-reports)
12. Qualcomm (https://investor.qualcomm.com/annual-reports) 13. Alibaba (https://www.alibabagroup.com/en/ir/home) 14. SAP (https://www.sap.com/corporate/en/investors/reports.html) 15. Facebook (https://investor.fb.com/financials/default.aspx) 16. Tencent Holdings (http://quicktake.morningstar.com/stocknet/secdocuments.aspx?symbol=00700&country=hkg) 17. EMC (http://www.annualreports.com/Company/emc-corporation) 18. Amazon (https://ir.aboutamazon.com/) 19. HP (https://investor.hp.com/financials/annual-reports-and-proxies/default.aspx) 20. Ericcson (https://www.ericsson.com/en/investors/financial-reports) 21. Baidu (http://ir.baidu.com/financial-reports/) 22. Nokia (https://www.nokia.com/about-us/investors/) 23. SK Hynix (https://www.skhynix.com/jpa/ir/annualReport.do)
24. Tata Consultancy Services (https://www.tcs.com/investor-relations)