UNIVERSIDADE DA BEIRA INTERIOR
Engenharia
Assessing the effort of exercise using low cost
sensors
Carlos Pedro Lourenço Anastácio
Dissertação para obtenção do Grau de Mestre em
Engenharia Informática
(2º Ciclo de estudos)
Acknowledgements
I would like to thank all the people that directly or indirectly, made the realization of the dissertation possible. To Professor Paulo Fazendeiro, for the guidance, critics and suggestions given during the development of this work. I would also like to thank Professor Filipe Ferreira who made the school accelerometry dataset collection possible, and his students that willingly cooperated in the data gathering sessions. Also, a special thanks to Jason Costa, that helped me understand the work previously developed, which was crucial to writing this dissertation. Last but not least, would like to thank all my family, friends, and colleagues, for all the support during this academic challenge.
Resumo
No presente trabalho é proposta uma solução que visa ajudar os professores de educação física a fazer a avaliação dos seus alunos, e os alunos a sentirem-se mais motivados com a inclusão de tecnologia nas aulas de educação física e com o facto da métrica apresentada, ser calculada a partir do esforço de cada um, tentando assim ultrapassar alguns vieses inerentes ao processo de avaliação. Foi proposta uma solução que utiliza um sensor, neste caso o acelerómetro, para a obtenção de dados de acelerometria durante a execução de quatro atividades físicas: voleibol, andebol, basquetebol e futsal. Foram recolhidos dados de duas turmas que frequentam o 9º ano. O dispositivo utilizado para a obtenção desses valores de acelerometria foi o smarpthone dos alunos, através de uma aplicação móvel que é responsável pela recolha dos dados e por os enviar para um servidor. Esses dados foram sintentizados e analisados de forma a calcular a métrica Running Equivalent of Activity (REA).
Foi realizado um estudo empírico que visa a validação experimental da referida métrica tendo sido testados diversos protocolos experimentais. São sugeridas um conjunto de boas práticas para a adopção da solução ora proposta, no sentido de permitir uma aferição justa e equitativa do esforço aplicado pelos estudantes nas aulas de Educação Física.
Palavras Chave
Métrica de avaliação física, acelerometria, sistema de suporte à avaliação, reconhecimento de atividade, motivação do estudante, biblioteca de dados de acelerometria.
Abstract
In this work, it is proposed a solution that tries to help the physical education teachers in the assessment of their students, also trying to increase the motivational levels of students with the inclusion of new technologies in class, and with the fact that the presented metric, being estimated for each student from their own effort. It is proposed a solution that uses a sensor, in this case an accelerometer, in order to capture accelerometry data during the execution of four physical activities: volleyball, handball, basketball and futsal. Data was retrieved from two classes of the 9thº Portuguese school year. The device used to capture those accelerometry data was the student’s own smartphones, through a mobile application that collects data and sends it to a server. After that data is uploaded, it is analysed in order to calculate the metric Running Equivalent of Activity (REA).
An empiric study was developed aiming at the experimental validation of the metric referred above, having been followed diverse experimental protocols. A set of good practices is suggested for the adoption of the proposed solution, a mean to enable a fair and equitable assessment of the effort applied by the students during the physical education classes.
Keyword
Physical assessment metric, accelerometry, grading support system, activity recognition, student motivation, accelerometry dataset.
Contents
1. Introduction ... 19
1.1. Motivation ... 19
1.2. Objectives and synthesis of the state of the art ... 20
1.3. Main contributions ... 20
1.4. Organization of this document ... 21
2. State of the art ... 23
2.1. Introduction ... 23
2.2. Physical Education assessment ... 23
2.3. Assessment equipment and devices ... 24
2.4. Sensor Placement ... 26
2.5. Metrics of effort assessment ... 27
2.6. Accelerometry data reduction ... 29
2.7. Related work ... 33
2.8. Remarks ... 34
3. Integrated assessment environment architecture ... 35
3.1. Introduction ... 35
3.2. Mobile Client ... 35
3.3. Data model ... 37
3.4. Server Application ... 38
3.4.1 Registry and Login Systems ... 38
3.4.2 Teacher view ... 39
3.4.3 Student view ... 40
3.5. Remarks ... 41
4. Analysis of collected data ... 43
4.1. Introduction ... 43
4.2. Collection procedure ... 45
4.3 Students physical characteristics ... 47
x
4.4.1. Calculate REA using the first HIRA ... 47
4.4.2. Calculate REA using each collection HIRA ... 53
4.4.3. Calculate REA using the average of all the HIRA ... 58
4.5 Remarks ... 63
5. Conclusion and Future Work ... 65
5.1 Major Conclusions ... 65
5.2 Future Work ... 66
5.3 Concluding Remarks ... 67
List of figures
Figure 1 - 3-axis coordinate system in a smartphone [25]. ... 25
Figure 2 - Sensor Placement locations are: (a) collar area, (b) rear of the upper arm, (c) forearm, (d) front and rear sides of ribcage, (e) waist and hips, (f) thighs, (g) shin, and on (h) top of the foot [35]. ... 27
Figure 3 - The left panel represents the general data types, the right panel represents the 4 common research interests, the mid panel contains the 6 common analysis pathways between the data and the research interests [50]. ... 31
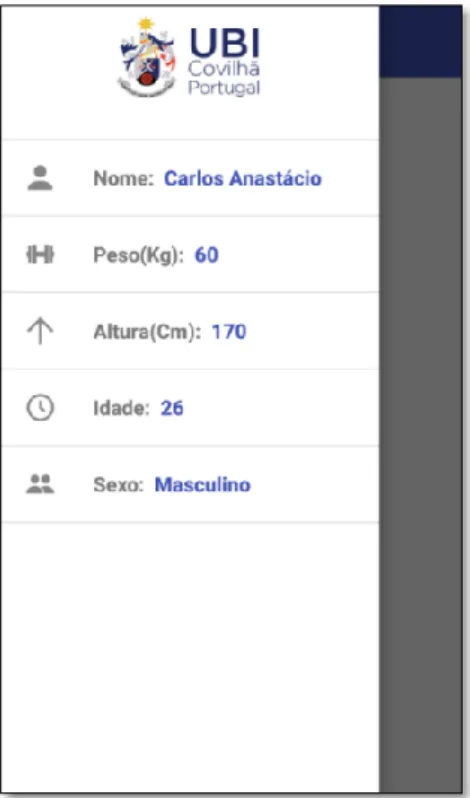
Figure 4 - Mobile Client with the drawer activated. ... 35
Figure 5 - Mobile Client capturing accelerometry data collection. ... 36
Figure 6 - Notification during accelerometry collection. ... 36
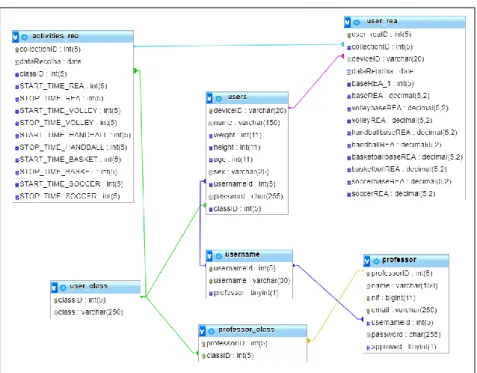
Figure 7 - New Database relational model. ... 37
Figure 8 - On the left side are inserted the beginning and the ending of each activity. On the right side are displayed the last calculated values. ... 39
Figure 9 - Accelerometry collections information. ... 39
Figure 10 - Teacher’s Home page. ... 40
Figure 11 - Student’s page. ... 41
Figure 12 - Complexity reduction via REA... 44
Figure 13 - Smartphone position during accelerometry collection. ... 45
Figure 14 - Volleyball magnitude values from collections 1 and 2 for Student 1. ... 48
Figure 15 - Volleyball REA for the first two collections calculated using the first HIRA value captured. ... 49
Figure 16 - Volleyball REA for students with three collections calculated using the first HIRA value. ... 49
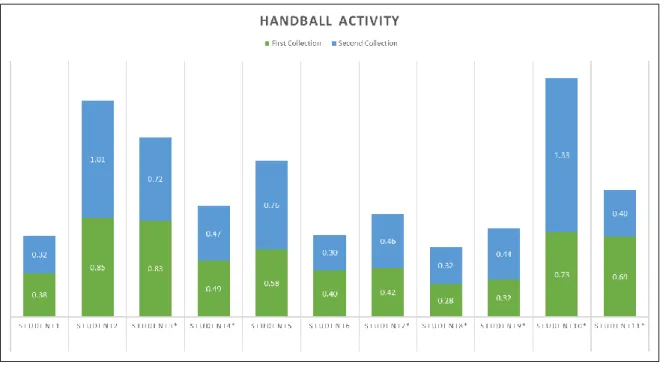
Figure 17 - Handball REA for the first two collections calculated using the first HIRA value captured. ... 50
Figure 18 - Handball REA for students with three collections calculated using the first HIRA value. ... 50
Figure 19 - Basketball REA for the first two collections calculated using the first HIRA value captured. ... 51
Figure 20 - Basketball REA for students with three collections calculated using the first HIRA value. ... 51
Figure 21 – Futsal REA for the first two collections calculated using the first HIRA value captured. ... 52
Figure 22 - Futsal REA for students with three collections calculated using the first HIRA value. ... 52
xii
Figure 23 - Volleyball REA for the first two collections calculated using each collection HIRA value. ... 54 Figure 24 - Volleyball REA for students with three collections calculated using each collection HIRA value. ... 54 Figure 25 - Handball REA for the first two collections calculated using each collection HIRA value. ... 55 Figure 26 - Handball REA for students with three collections calculated using each collection HIRA value. ... 55 Figure 27 - Basketball REA for the first two collections calculated using each collection HIRA value. ... 56 Figure 28 - Basketball REA for students with three collections calculated using each collection HIRA value. ... 56 Figure 29 - Futsal REA for the first two collections calculated using each collection HIRA value. ... 57 Figure 30 - Futsal REA for students with three collections calculated using each collection HIRA value. ... 57 Figure 31 - Volleyball REA for the first two collections, calculated using the average of all the HIRA values collected. ... 59 Figure 32 - Volleyball REA for students with three collections calculated using the average of all the HIRA values collected. ... 60 Figure 33 - Handball REA for the first two collections, calculated using the average of all the HIRA values collected. ... 60 Figure 34 - Handball REA for students with three collections calculated using the average of all the HIRA values collected. ... 61 Figure 35 - Basketball REA for the first two collections, calculated using the average of all the HIRA values collected. ... 61 Figure 36 - Basketball REA for students with three collections calculated using the average of all the base values collected. ... 62 Figure 37 - Futsal REA for the first two collections, calculated using the average of all the HIRA values collected. ... 62 Figure 38 - Futsal REA for students with three collections calculated using the average of all the base values collected. ... 63
List of Tables
Table 1. Standard MET guidelines for the activities performed by students. ... 27
Table 2 - Server Folder Structure ... 38
Table 3 – Physical activity list. ... 46
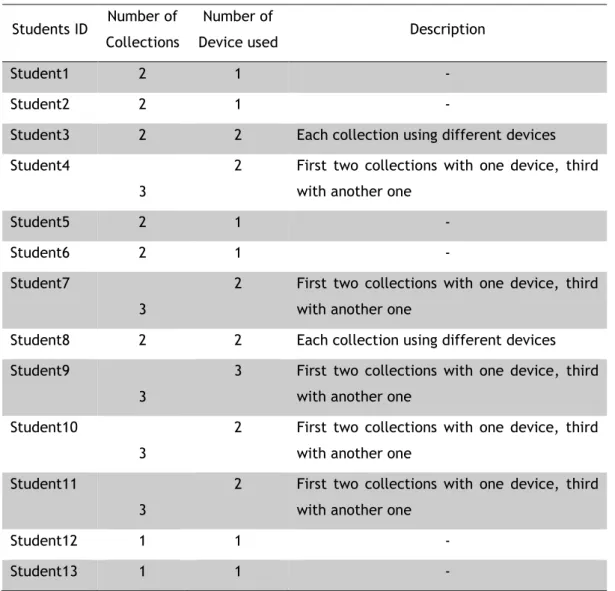
Table 4 – Number of collections, devices and description made by each student. ... 46
Table 5 - Students physical characteristics. ... 47
Table 6 – Students calibration activity (first collection values). ... 53
Table 7 - Calibration activity average, standard deviation, and REA values average using the first base value calculated. ... 53
Table 8 - Students calibration activity during all collections. ... 58
Table 9 - Activities average and standard deviation, using each collection base value. ... 58
Table 10 - Students average calibration activity from all collections. ... 59
Table 11 - Activities average and standard deviation, using the average base value of all collections. ... 63
Acronyms
AC Activity count
ADAS Actigraph data analysis software
AI Activity index
API Application programming interface
BMI Body mass index
HIRA High intensity running activity GPS Global position system
JAR Java Archive
MEMS Micro Electro Mechanical System MET Metabolic equivalent of task
OPACH Objective Physical Activity and Cardiovascular Health
PSG Polysomnographic
REA Running equivalent of activity REE Resting energy expenditure SEI Sleep efficiency index SOL Sleep onset latency
V02 Maximal oxygen consumption WASO Wake after sleep onset
1. Introduction
1.1. Motivation
Assessment in physical education has many purposes from decision making about classification, diagnosis, and guidance, reporting the progress of a student in developing the knowledge, skills, and attitudes. This assessment has become stagnated, with teachers using the same old methods, and techniques to evaluate their student’s overall performance, and grading them according to the national and/or state physical education standards [1]. A physical education teacher grades a student based on four domains: cognitive domain, health-related physical fitness, psychomotor-skills, and effective skills. The cognitive domain is related to the students knowhow, health-related physical is the improvement made by the students regarding fitness levels, and psychomotor-skills is what students are able to perform, and the last domain refers to the attitudes and beliefs about the subject [2].
The teacher needs to collect evidences about the student’s performance during the classes and make interpretations about how they progress based on those evidences, which can be demoralizing for some students, that even while trying their best, aren’t able to perform as well as some of their colleagues, due to physical limitations or psychological demotivation. In order to remove these external biases, we propose the use of a metric that could help the teacher assess his students, by comparing the effort of each student in pre-determined activities with their own best effort. The main focus is to motivate the students that may be overweight, or lacking fitness, and at the same time create a more objective student assessment, to help the teacher assess his students.
Schools have a very important role in trying to motivate their students for the practice of physical activities, through the classes dedicated to it, also encouraging them to practice physical activities outside of those classes. These kind of activities are associated with a longer and better quality of life, reducing the risk of a variety of diseases, and introduce many psychological and emotional benefits [3]. For many students, the school is the main environment for physical activities practice through the dedicated classes as well as after-school activities [3].
Schools should have a very important part in raising awareness about important issues like health disorders, they could try to incorporate technology in a way that can motivate the students to put more effort, than they would normally put in a guided physical activity. The physical education classes should be more interactive, allowing the students to check their performance over time. The lack of regular physical activity and bad eating habits may lead to health disorders like obesity, diabetes, cardiovascular diseases, and others. In fact, a 2013 study [4] states that about 13% of the world’s population (11% men and 15% women) were obese. High body-mass index (BMI) leads to cardiovascular diseases (heart disease and stroke),
Assessing the effort of exercise using low cost sensors
20
which were the leading cause of death in 2012 [4], and is also related to other diseases like diabetes, musculoskeletal disorders (like osteoarthritis), cancers (endometrial, breast, ovarian, prostate, liver, kidney, colon).
Over the last years, the number of smartphones has substantially increased. In 2016, 2.3 billion people had a smartphone, with numbers expecting to reach 2.6 billion in 2017 [5], [6]. With the increase in smartphones numbers, most children nowadays already possess a smartphone. This device contains many sensors, such as a Global position system (GPS), gyroscopes, accelerometers, temperature, magnetometers, and barometers, and with the help of a mobile application, those accelerometry values can be retrieved in order to analyse them, according to our need.
1.2. Objectives and synthesis of the state of the art
We argue that the use of an accelerometer sensor, and of a specially tailored metric of effort assessment to evaluate the student’s performance during the physical education classes, can result in a substantial help complementing the teacher’s evaluation of his students. The objective of this metric is to circumvent some of the limitations presented on the traditional evaluation methods, removing some of the subjectivity of the evaluation process, such as student’s different physical characteristics and device heterogeneity.
At the same time, it is expected that the motivation levels of the students could raise with the inclusion of technology and a fair metric that compares each student performance with their own best effort, through the execution of a calibration activity (for instance, high intensity running). This may lead to students being more motivated, especially those who can’t take advantage of their physical structure, or present lack of fitness.
The accelerometer sensor, must be placed in the waist for motion sensing, due to the fact that the waist is closer from the centre of mass of the human body, and is the most comfortable position during the execution of the physical activities, preventing student discomfort during the physical activities [25-27].
We aim to implement a solution that complements the student’s assessment, supporting the teacher during the grading process, and helping the students to get motivation and to put more effort during the physical education classes. The chosen metric will be used as a mean to compare the students’ own levels of activity and evolution in class, this way, making the students more confident, not only the ones who can’t take advantage of their physical structure, or present lack of fitness, but also the ones who are already fit, but always want to give their best.
1.3. Main contributions
From a practical point of view the major contribution of this work was the development of a prototype application that can be used to remove the relative subjectivity that exists in the
Assessing the effort of exercise using low cost sensors
student’s assessment during physical education classes, by using the student’s smartphone. The accelerometry data was captured and used to extract activity information related to each student, to complement the teacher’s assessment and grading system. The idea behind the smartphone’s accelerometery was to implement a more objective assessment, in a way that can motivate students who cannot take advantage of their physical structure, due to overweight or lack of physical dexterity.
We hope that with the inclusion of technology, and by providing the students with their own data collections, we can motivate them to practice a more active lifestyle and at the same time improve their efforts during the physical education classes. We also hope to help fight obesity and other diseases by trying to create good habits in the students.
An accelerometry dataset was collected from all the students, composed of a set of activities performed during the physical education classes.
A metric of effort called REA (running equivalent of activity) was validated during the execution of four physical activities, using three different approaches that were compared. Student’s performance can be analysed and compared by the teacher or by the students, (can only check their own performance) on the front-end application in a graphical way. These charts can be useful to help the teacher’s assessing his students and help motivate the students in order for them to put more effort during the physical education classes.
1.4. Organization of this document
This dissertation is divided into 5 sections. In section 2, a brief literature review is made comprising subjects like accelerometers, techniques to capture accelerometry data, the best locations to place the sensor in the body to be unobtrusive to the human body motion, the traditional assessment used to evaluate the students during the physical education classes. Then we proceed to explain the concept of data reduction and some techniques that can be used such as compression or data deduplication. Section 2 also elaborates on some metrics that can be used to assess the effort during physical activities. Section 3 details some of the elements of the system architecture, from the mobile client that needs to be installed on the student’s smartphone, the data model, the registry, and login systems and finally the teachers and students web view (on the front-end application). Section 4 details the analysis of the collected accelerometry data, such as the three approaches that were used to calculate the metric. Section 5 provides a summary of the main conclusion about the work that was developed during this time and points to some future work, and provides some personal concluding remarks, discussing the work and the biggest challenges that appeared during its development.
2. State of the art
2.1. Introduction
This chapter discusses the available literature for related areas of this work. First, a brief explanation about how the physical education assessment is being made, proceeding to an explanation about accelerometry, giving examples of its purpose and different areas of application, as well as the available devices with an accelerometer that could possibly be used to capture accelerometry data. Proceeding then to the available locations on the human body where a sensor can be placed. The last two subsections are dedicated to the study of metrics that can be used to measure student’s assessment effort, namely the metric that will be used during this study, and the techniques to accomplish reduction of accelerometry data. This will allow for a better understanding of the following chapters.
2.2. Physical Education assessment
Assessment in physical education serves many purposes and contributes to decision making about classification, diagnosis and guidance, motivation, reporting information about a student’s progress and achievement in developing knowledge, skills and attitudes [8], [9]. The goals of physical education are to improve physical fitness, sport and rhythmic skills for recreation and daily movement tasks, perform efficient, creative and expressive with an active living lifestyle, demonstrate critical thinking, assess attitudes and behaviours [8]. Often physical education classes have few time allocated in schools, which makes the assessment process not effective as an outcome [10].
Grading is the process of assigning marks to students based on a formal assessment of changes in student behaviour, it increases the students interest, motivation and assesses the effectiveness of instruction [11].
Student assessment is the process of gathering the evidences about student’s achievements such as, skills, attitudes, behaviour of learners, and make interpretations about how was the students’ progress based on those evidences. A physical education teacher, collects and keeps track of assessment data to make decisions about instructions and to measure student’s learning recurrently during the learning process [1], [8].
Physical educators assess based on four domains, cognitive domain, health-related physical fitness, psychomotor-skills, and affective skills. Cognitive domain is what the students need to know (knowhow), health-related physical fitness retracts the improvements made regarding fitness levels, psychomotor-skills is what students are able to do/perform, and the affective domain refers to the attitudes and beliefs about the subject [2].
Assessing the effort of exercise using low cost sensors
24
The use of factors such as attitude, attendance and effort combined with subjective ratings of the student’s motor performance, forms the way the actual model uses today in physical education evaluation [12]. Sport skill is possibly the most difficult human motor performance to assess, due to several facts such as complexity of sport performance, appropriateness of existing sport skill tests, and the fact that they need too much time to set up and manage [13]. There are two types of assessments that can be used to evaluate student' achievement/progression in physical education [2]. Firstly, formative assessment which is a continuously process made throughout a physical education curricular year, where teachers need to create an inclusive program that meets the needs of the students, lastly, the summative assessment in which the teacher creates a summative physical education task which allows the students the demonstration of specific key skills they have been working on, and the teacher will assess the students based on a series of performance criteria [14], such as shooting position during basketball, or futsal (for example).
Students receive immediate feedback during the classes, with skills being attempted and the participant knowing the result immediately due to direct observation, the problem lies in defining success. If physical education is to be considered an important discipline, then the assessment needs to follow best practice like formalism and timely teacher feedback [15]. To provide a comprehensive summary of each student’s progress, the professor needs to conduct pre-assessments to understand at which point the students are at the beginning of a learning sequence, and formative assessments that allow him to track the ongoing instructions. Suitable assessments provide concrete evidence of whether the students have achieved a grade-level outcome, demonstrating that students are meeting the standards and results [2]. In order to complement the assessment of students during the physical education classes, in this work it is proposed a solution that uses an accelerometer and an assessment metric, to help the professor assess his students, at least in the psychomotor skill aspect with the reduction of issues such as subjectivity, device heterogeneity and student’s different physical characteristics, allowing a fair comparison between students despite the fitness of each student.
2.3. Assessment equipment and devices
An accelerometer is an integrated electronic component, used to measure acceleration forces exercised on an object. These forces can be static, like a constant force of gravity, or they can be dynamic, caused by movement or vibration of the accelerometer. When the static force is measured, it is possible to find the inclination angle of the device in relation to the earth, and when the dynamic force is measured, it is possible to analyse the kind of movement exercised on a particular object [8-9].
There are various types of accelerometers, each one with their own characteristics, advantages and drawbacks. Accelerometers are divided in two major groups: mechanical and electronic. In the mechanical group the most used are the capacitive, piezoelectric and piezoresistive,
Assessing the effort of exercise using low cost sensors
while in the second group, there is the Micro Electro Mechanical System also known as MEMS, this one with a big growth [9-10].
The sensors MEMS are simple devices that emulate the mechanical parts through micro-machining technology and consists, of a cantilever beam with a proof mass and a capping to ensure the degradation by water, dust and physical contact doesn’t damage the chip. The inertial force will make the proof mass to deflect when there is acceleration or gravity [7]. The three-axis accelerometer signal can be described using the following formula.
𝑎𝑚= 1
𝑚 (𝐹 − 𝐹𝑔) (1)
Where, 𝑎𝑚 is the measured acceleration, 𝑚 is the mass of the body, 𝐹 is the sum of all forces
on the body, and 𝐹𝑔 is the gravity force which is 9,81 𝑚/𝑠2 , which is also detected by the sensor
[16].
This MEMS device is the one integrated in smartphones, because of his small size, low consumptions, and low costs. Thanks to these factors this type of accelerometer has a huge commercial potential, and enables the development of applications for different areas, medical [9-10], navigation [11-12] and sports [13-14] for instance.
In smartphones, the default position of the accelerometer is in the centre of mass of the device and usually uses a 3-axis coordinate system, as displayed in Figure 1. If it is kept in the default orientation, the x-axis is horizontal and points to the right, the y-axis is vertical and points upwards and the z-axis is perpendicular to the screen.
Assessing the effort of exercise using low cost sensors
26
Due to the small size, low consumptions, and low costs, there are a lot of devices with an incorporated accelerometer, like smartphones, pedometers, tablets, smart fitness watches, fitness wristband, activity trackers.
For example, the Fitbit:ZIP, is an external device that has an accelerometer with 3-axis, with the objective of measuring the movements patterns of each user. Allows users to track steps, distances and calories burned [26]. This device can be synchronized with smartphones and computers, in order to keep updated information in real time. Unfortunately, all the Fitbit trackers software are exclusive and not open for developers to work with the device accelerometer values. Another example is the Nike+FuelBand [27], an activity meter used in the wrist, it allows users to see the steps performed and the number of calories burned through an accelerometer. The device can also be synchronized with the application and allows users to track their progress in the smartphone, unfortunately it isn’t also open source. Actigraph is a company that traditionally develops high end activity monitors present in several studies. One of their most recent devices the Actigraph GT9X Link [28], includes a gyroscope, magnetometer, and secondary accelerometer to deliver valuable information about movement, rotation, and body position. It captures and records high resolution raw acceleration data, which can then be transformed in a diversity of objective activity and sleep measures. It has measures like raw acceleration (G’s), physical activity intensity, activity bouts, energy expenditure, MET rates and others. The main problem of this device it seems to be the high price.
Due to the limitations mentioned before and availability of the accelerometer axis values from almost all those devices, we decided to use smartphones to perform this study, this way it would only be needed a mobile application in order to capture those accelerometry values and no additional equipment has to be purchased.
2.4. Sensor Placement
Sensors can be placed in multiple locations (see Figure 2), on the human body whose movements are being studied, and they need to be unobtrusive to the human body motion [7].
To measure the whole-body movement, the sensor is normally placed on the sternum [29], lower back [30], and waist [31]. Some studies [32]–[34] adopted placing the sensor in the waist for motion sensor, since the waist is closer to the centre of mass of the human body, and being the most comfortable during the activities performance. Since motion will be analysed, and with the information provided by the mentioned studies, in this developed solution the students will place their smartphones on a waist bag provided by us.
Sensors can easily be attached and detached from a waist bag, causing less constraint in body movement, and minimizing discomfort as well. The sensor needs to be securely fitted and attached to the human body, to prevent relative motion between the sensors and the parts of the human body. If the attachment is loose or unsecured, it causes vibration and displacement
Assessing the effort of exercise using low cost sensors
of the wearable systems, producing unnecessary signal artefacts and degradation of the sensing accuracy [7].
Figure 2 - Sensor Placement locations are: (a) collar area, (b) rear of the upper arm, (c) forearm, (d) front and rear sides of ribcage, (e) waist and hips, (f) thighs, (g) shin, and on (h) top of the foot [35].
2.5. Metrics of effort assessment
Since all students have different physical features, and their accelerometry data can be collected by different devices, a measurement that can be used is the metabolic equivalent task (MET) [36]. This MET is an extensively used physiological concept that characterises a simple procedure for expressing energy cost of physical activities as multiples of resting metabolic rate, allowing us to quantify the energy cost of activities at rest, or the average resting oxygen consumed by the body at rest. One MET represents the energy expenditure at rest (REE) or the resting 𝑂2 consumption (𝑉𝑂2) [36]. To calculate the MET value, it is necessary
to multiply the energy cost of a physical activity by the REE value. MET can be seen as an index of the activities intensities (see Table 1), in a way that people with different weights and heights can be compared [36].
Table 1. Standard MET guidelines for the activities performed by students. Activity Met value
Resting 1 Running 12,9 – 14,6 Volleyball 6 Handball 8 – 12 Basketball 11,1 Football 10,3
Assessing the effort of exercise using low cost sensors
28
Another measurement that can be used is the running equivalent of activity, hereafter called REA and expressed as follows,
𝑅𝐸𝐴𝐴𝐶𝑇=
𝑎𝑣𝑔𝑀𝑎𝑔𝑛(𝐴𝑐𝑡𝑖𝑣𝑖𝑡𝑦)
avgMagn(RunHigh) (2)
This measurement provides a comparison base with other kinds of activities, being defined as the ratio of the standard average acceleration vector of the activity by the previously calculated average magnitude of a calibration activity [37]. For this calibration, it can be used, for instance the high intensity running activity. From hereafter, this activity will be called high intensity running activity (HIRA), and in this work will be used as the base measurement due to the fact that this activity provides consistent accelerometry values [37].
It is important that the students perform the HIRA at maximum intensity without breaks, because all the subsequent activity estimations will depend on this data.
The average of the magnitude (3) for a short period and a high intensity activity, is extracted individually for each student, defining this way the base measurement.
𝑚𝑎𝑔𝑎𝑥𝑖𝑠= √𝐴𝑥2+ 𝐴𝑦2+ 𝐴𝑧2 (3)
By using this method, the student’s comparison is conceivable, without having to worry about their different physical characteristics.
Students collect accelerometry data while running for 2 minutes at their highest intensity, then after this data is collected, it is necessary to calculate the average magnitude for those 2 minutes, providing the base magnitude value for a normalized REA value of 1 [37]. It is also necessary to remove the gravity by using a low pass filter [25], in order to only extract the acceleration of the student, if the gravity were not removed, a vertical acceleration force would be incorrectly reported when students would be standing without moving.
This activity needs to be of short duration, to guarantee that the students run at high intensity, to get a precise representation of the student’s maximum performance, if they do not perform this activity at their maximum level, the other activities may report a high magnitude, which will not represent the true activity level. The HIRA value is calculated by identifying the activity by the timestamps presented in the dataset and by calculating the average of the magnitude for all the axis (X, Y, Z) in the defined time. This REA calculation allows an estimation of a related activity measurement, removing the heterogeneity of the different devices used by the students during the collections, allowing this way a more reliable student comparison. REA is calculated for each activity performed, this way, allowing the teacher to check the performance of his students by activity or by an overview of all the performed activities. This metric had some inspiration on the metabolic equivalent of task (MET), due to the fact that it also provides a measurement that allows the comparison of different subjects regarding energy costs in physical activities [37].
Assessing the effort of exercise using low cost sensors
In [38] two metrics are proposed for human activity (walking, stair climbing, chair-standing, and lying on a bed) based on high-density acceleration recordings from an accelerometer sensor placed on the waist. The start and end times of each activity were recorded by a lab technician for a more detailed description. These two metrics are based on two concepts: Time Active, which is a measurement of the length of time when activity can be distinguished from rest, Activity Index (AI) is a measurement of the relative amplitude of activity comparative to rest. In this study, they start by normalizing the data on a scale that can be interpreted in units of intensity of activity, then they measure using the same type of accelerometer, from different people and locations, in order to have comparable and similar interpretation data, finally, this approach automatically mimics human information processing. AI is a complement for the Time Active, which only emphases the time spent active without information about how active the subject is, like running and walking without stops for 15 minutes give the same Time Active but a different AI. AI is defined as the “total acceleration at a particular time point after removing the global average acceleration relative to rest” [38], thus any device than can be used in an unbiased way.
In [39] the procedure used is composed of two phases, being the first one the calibration sample and the second one the validation sample. These phases are then reported to the laboratory between 21 hours (9:00 p.m.) and 24 hours (12:00 midnight), for an overnight polysomnographic (PSG) recording using standard sleep recording montage along with an actigraphic recording. The Actigraph was placed on the dominant wrist to record the sleep and the wake activities during the recording night. The data recorded with the Actigraph was analysed using an actigraph data analysis software (ADAS. This software allows the visual inspection of patterns of activity based on the actigraphic data, this data can be manipulated to yield statistical values for a number of actigraphically derived variables, such as sleep efficiency index (SEI), wake after sleep onset (WASO), sleep onset latency (SOL) and others. Furthermore, amplitude, periodicity, and phase of the circadian rhythm in activity patterns can be determined with the added smoothing and autocorrelation functions.
2.6. Accelerometry data reduction
There are five issues that are important to consider when processing accelerometer data: identifying the wearing period of the day (accelerometer), spurious data, compute outcome variables and aggregating days of data and extracting bouts of moderate to vigorous physical activity (MVPA). The clarification of these problems and the standardization of accelerometry data reduction would significantly improve the ability to compare results across studies [40]. The study [41] emphasizes three key data reduction criteria, the number of valid days, the daily wear time and non-wear time. Finally, the extraction of MVPA bout is used to understand whether the subjects met the current physical activity recommendation, in our case the students need to perform about 60 minutes of physical activities, however, it’s unlikely that
Assessing the effort of exercise using low cost sensors
30
children will be able to sustain a high level of activity for 30 or 60 minutes, instead they have short bouts [42].
Data reduction techniques are used in order to reduce the number of data records by removing invalid data or produce summary data and statistics at different aggregation levels for various applications [43], these can be deduplication, compression, thin provisioning, sampling, BIRCH summarization. The deduplication technique typically happens at the storage block level, the system analyses the storage to check if duplicate blocks (contiguous set of bits/ bytes that form an identifiable unit of data, this term is normally used in word processing, network communication and database management) exist and gets rid of any redundant blocks. In case an application tries to change one block, that block is copied prior to modification so that other files that are dependent of that block can continue to use the version that stayed unmodified, avoiding this way a corrupted file. The data compression technique is used to reduce the size of a file, by removing redundant information from files, to reduce the disk space that is typically required. This is accomplished by using algorithms or formulas created with the purpose of identifying and delete the redundant bits of data [44]. The thin provisioning technique is used to complement the other two techniques, by providing a dynamic form of storage allocation. By eliminating the pre-allocation of unused capacity, more data can be stored on the storage platform, this method provides an effective, on-demand storage consumption model [45]. The Sampling technique allows us to draw statistical interpretations about the unknown population from sample data, but it’s viewed as an expensive resource and it is supposed that capturing population data is impossible [46]. Sampling can be used in the context of data reduction for data mining [47], [48]. The BIRCH technique is a clustering method for handling very large datasets, it starts by generating more compact summary that retains as much distribution information as possible, by concentrating on densely occupied portions, and then clusters the data summary instead of the original big dataset [49].
Figure 3 reproduced from [50] represents a general framework for accelerometer-related studies.
Assessing the effort of exercise using low cost sensors
Figure 3 - The left panel represents the general data types, the right panel represents the 4 common research interests, the mid panel contains the 6 common analysis pathways between the data and the research interests [50].
In [38] the information captured from the accelerometer, is a high-volume and complex data that needs to be handled carefully and standardized to guarantee the validity and reproducibility of the metric.
Areas that were projected to be active show a wide range of variation both in terms of patterns and amplitude of the signal. The data was captured with a sample rate of 𝑓 = 10 𝐻𝑧 for a total of 34 Subjects and each one was observed for four to five days. The subjects were only observed during in-lab sessions, not during in-home data collection. Once the presence or absence of activity is estimated, many types of metrics can be used to describe the rest of the data. In [50], an ActiGraph GT3X+, which is a tri-axial accelerometer was used, in OPACH (Objective Physical Activity and Cardiovascular Health), to measure physical activity. It was configured to collect raw acceleration time series (x, y, z axes) at 𝑓 = 30𝐻𝑧. Then the ActiLife 6 companion software, could calculate axis-specific Activity Count (𝐴𝐶) (𝐴𝐶𝑥2+ 𝐴𝐶𝑦2+ 𝐴𝐶𝑧2), and AC Vector
Magnitude (√(𝐴𝐶𝑥2+ 𝐴𝐶𝑦2+ 𝐴𝐶𝑧2), which is the square root of the sum of the axis-specific AC),
by using the raw acceleration time series. They also propose a metric called activity index (AI), which, according to the authors have several desirable properties, like transparency, ease of deployment, additivity and rotational invariance, this metric was then compared with the established AC. AI had the best results in distinguishing among various types of physical activities across different level of intensity, it also had the best overall performance predicting energy expenditure expressed in METs, and had the better predictive performance for classifying an epoch into various physical activities categories. One of the limitations of this study is the fact that only one kind of accelerometer was used, which is completely different from our case, in which all the devices were different, even though they were all smartphones. Another limitation given by the authors was the fact that the accelerometry data was collected only from hip-worn accelerometers, like what happens in our case, but with waist-worn accelerometers.
Assessing the effort of exercise using low cost sensors
32
The work presented in [51], uses an Android application in order to collect accelerometry data from a tri-axial accelerometer. The smartphone was placed on the subject’s waist, and the data was collected from 5 long-term activities: commuting, working at home, shopping and exercising.
The data collected from the accelerometer was smoothed with the moving average filter, 𝑣𝑠(𝑡)= 1
𝑛 ∑ 𝑣(𝑖) 𝑡−1
𝑖=𝑡−𝑛 , using a window length of 15, where 𝑣 is the original vector, 𝑣𝑠 is the smoothest
vector and 𝑛 is the window length. The long-term activities are composed of simple activities, which are the ones they want to extract for a window length of 𝑤 seconds. Each one of those simple activities are represented as a feature vector, and to calculate that vector they had the need to compute 14 features from each 𝑤 seconds window. The statistical features computed over the window were: the mean value for each of the axis, the standard deviation for each axis, Pearson correlation for each pair of axes and the mean value of the derivatives for each axis. They also used two of the physical features described in [52] which are the average of the movement intensity 𝐴𝐼 = 1
𝑇(∑ 𝑀𝐼(𝑡) 𝑇
𝑡=1 ), and the variance of the movement intensity 𝑉𝐼 = 1
𝑇(∑ (𝑀𝐼(𝑡) − 𝐴𝐼) 2 𝑇
𝑡=1 ), the movement intensity is computed as follows: 𝑀𝐼(𝑡) =
√𝑎𝑥(𝑡)2+ 𝑎𝑦(𝑡)2 + 𝑎𝑧(𝑡)2, where 𝑎𝑥(𝑡)2, 𝑎𝑦(𝑡)2, 𝑎𝑧(𝑡)2 are the accelerations at time 𝑡 from
the 𝑤 second window. At the end they conclude that the features proposed in article [52] can be used to recognize long-term activities. Furthermore, they extracted a set of features from the distribution of primitives and used a threshold in order to reduce the noise, which help them to increase the classification accuracy. At the end of this process, they have a set of simple activities that arose from each of the long-term activities. Then, they proceed to primitive generation to build blocks of long-term activities, to generate these primitives they perform clustering on all simple activities from the training set performed in the previous step. Once the clustering is finished each primitive match to the centroid of each cluster. Following histogram generation, which is responsible for representing the distribution of primitives for each long-term activity.
They also concluded that by using one tri-axial accelerometer, it was possible to accurately recognize the activities performed by the subjects.
In [53] it is mentioned that one of the first steps in the data reduction process is to screen the subject files for spurious data. Data found above or below the range of biological plausibility needs to be dealt with. The foundation for asserting the low level of plausibility is based on the notion that, if a subject is wearing an accelerometer, the accelerometer is capturing accelerometer values. The authors propose a set of data cleaning and data reduction rules of thumb to deal with incomplete activity monitoring data. They conclude that despite many limitations, accelerometers provide an accurate and feasible method of gathering detailed physical activity information in a free-living environment.
Our approach, reported in the following chapters, to reduce the complexity of analysing charts created from thousands of lines, (CSV files), save costs by using the accelerometers provided by the students smartphone, relies on the use of the REA metric [37], which is responsible for
Assessing the effort of exercise using low cost sensors
the removal of the devices heterogeneity. This statistical metric reduces the complexity of charts being loaded, and analysed with lots of data, and hard to understand data, to a simple value, which is compared to a reference (HIRA). After those REA values are computed, the CSV file from which those values were calculated can be deleted, since the REA, for each activity will be added to the database. This will help reduce the amount of storage needed to store all the files uploaded from the smartphones, and it will also help reducing the complexity, summarizing data thanks to the metric REA. From the literature review, it is possible to argue that, subjects’ activity comparison is not reliable using directly extracted features such as the magnitude or number of steps, since the devices used for the accelerometry collection are different, and students have very different physical traits.
2.7. Related work
Advances made in the semiconductor industry, which also boosted advances in mobile devices, have made it possible to build microprocessors smaller than a pinhead. This evolution enabled activity recognition systems to be used in our daily life, in forms of applications ranging from medical, engineering to leisure.
The application of these devices varies from both academic and consumer-driven. For instance, accelerometers in laptops protect hard drives from damage, in case the laptop were to drop while in use, the accelerometer would detect the free fall and would immediately turn off the hard drive [54]. They are also incorporated in a lot of personal electronic devices such as media players, gaming, smartphones. In smartphones, the accelerometer allows users to step counting, user interface control and switching between portrait and landscape modes [55]. This technology is also used in car safety, allowing the airbag deployment at the right time in case of crashing [55].
In medical applications, accelerometers can be used to monitor and diagnose patients [56], rehabilitation [57], child and elderly care [29], assistance for people with cognitive disorders [58]. In gaming applications, accelerometers can be used on gaming controllers (e.g. Wii Remote), control of a character [59], as a musical instrument [60].
In Jennifer Kwapisz et al.[61], different activities like walking, jogging, ascending stairs, descending stairs, sitting and standing, were recognized using machine learning using Android smartphones, to collect data. Twenty-nine users participated in this study. In this study, they achieved 90% of accuracy for walking, jogging, sitting, and standing, 61,5% while ascending upstairs and 55,5% descending downstairs.
In Edmond Mitchell et al.[62], different sports activities were recognized using machine learning, like walking, sprinting, tackling, dribbling the ball, from a collected database composed of soccer and field hockey activities. Fifteen users were recorded in five matches of soccer, while seventeen users were recorded for the field hockey. The maximum accuracy was 87% using a fusion of classifiers.
Assessing the effort of exercise using low cost sensors
34
In Muhammad Shoaib et al.[63], by using accelerometer, magnetometer and gyroscope alone as well as combined, there are some situations where each performs better and which factors affect their performance. Six activities were recognized like waking downstairs, running, sitting, standing, walking upstairs and walking using an Android application. Overall, an accelerometer performs better than a gyroscope, however, when both are combined the results tend to improve.
2.8. Remarks
Physical education assessment like in any other subject has three types of pillars that are used to assess student’s achievement/progression in physical education: diagnostic assessment, formative assessment, and summative assessment. The use of factors such as attitude, attendance and effort combined with subjecting rating of the student’s motor performance, forms the way the actual model uses today in physical education evaluation. In order to complement the student’s evaluation performance over the physical education classes, the accelerometer sensor will be used.
Accelerometers allowed the development of multiple innovative applications in many different areas. Judging by the wide research done in many areas, like medicine, sports, navigation, engineering, gaming. This sensor, improved people’s quality of life, and quality of service. The analysed literature provided valuable insights relating to accelerometers, examples of some devices with an integrated accelerometer, sensor placement locations on the human body, and studies that used sensors to track motion.
An approximation with data reduction is made, more precisely accelerometer data reduction was a key element during the development of the proposed solution, and some techniques are presented with a brief explanation.
We identified two assessment metrics of effort [37, 64], as putative ways to circumvent the heterogeneity of the devices, and the differences in the students’ physical characteristics, such as weight, height and age.
The assessment metric of effort REA allows the comparison between students without having to worry about their physical differences, this allows the teacher to complement his student’s evaluation over the physical education classes, by tracking their performance.
3. Integrated assessment environment
architecture
3.1. Introduction
In this chapter is discussed how the accelerometry data is handled. First is given a brief explanation about the mobile application that was used to capture the accelerometry data. Following an explanation of the data model, the software that the server needs to run, the registry system that was created for the webpage to give students access to their own data. Finally, is shown how the webpage displays the data for both the students and the teachers.
3.2. Mobile Client
A mobile client [37] is essential for collecting the accelerometry data, for that, the students need an Android version superior to 2.2. After the mobile client is installed in the student’s smartphone, they need to execute the application, and insert the user information which is displayed in the app drawer (see Figure 4).
Assessing the effort of exercise using low cost sensors
36
After those steps are complete, the students need to calibrate the sensors due to accelerometer reporting slightly wrong values, to do so, they need to place their smartphones on a flat surface, click on “Calibrar” and wait a few seconds. When the user information has been added and the smartphone calibrated, the user is ready to start capturing accelerometry values (see Figure 5).
Figure 5 - Mobile Client capturing accelerometry data collection.
If a wireless connection is available after the students stop the capture, the values as well as the information provided by the students (Figure 4) will be uploaded to the server, if there is no connection available, the values are stored on the smartphone and then uploaded when a connection is available. After the values are uploaded to the server, the file will be deleted from the students’ smartphone. For users to collect data with their smartphones, they need to have at least 75 Megabytes of free memory space available. The application uses an android service [65], when is recording accelerometry data, allowing the accelerometry collection to run in the background indefinitely, this way users can interact with their smartphones without affecting the accelerometry data collection. While data is being collected, a notification is displayed with the current sensor values readings, from the three axis (x,y,z) (see Figure 6).
Assessing the effort of exercise using low cost sensors
3.3. Data model
The database model (See Figure 7) was inspired on the one developed by a former student [37], there was a need to expand the data model to be able to handle some functionalities that were needed for this solution. Some of the functionalities are, the creation of a login system that would allow scholars the tracking of their own performance over time, and at the same giving the teacher a way to track their students’ performance, helping to evaluate their performance over the physical education classes, and at the same time giving the teacher functionalities on his homepage.
The entity professor is responsible for storing information related to each professor registered on the system. Since one professor can teach one class, only one class can be taught by a teacher, this way generating a table called professor_class, which is responsible for storing the professorID, and the classID.
The entity activities_rea, was needed to keep track of the beginning and ending of each activity, this information is sent to the database to simplify the teacher's task. The teacher only needs to insert the beginning and ending of each activity in his home page, and a runnable JAR is responsible for calculating the running equivalent activity (REA), and storing those values in the database on the table user_rea. This information can then be displayed in the teacher view.
The entity username works like a username pool, each student and professor must have one in order to login, and this way, we can keep their username unique, the admin must manually set the field professor to let him access his homepage, to keep students from registering as professors.
Assessing the effort of exercise using low cost sensors
38
3.4. Server Application
The server is located at Universidade da Beira Interior, Covilhã, running Linux Ubuntu 14.04 64 bits. The server runs MySQL version 14.14 which is necessary in order to work with the database. It also runs PHP version 7, which is mandatory to run a PHP script [37] that uploads the accelerometry data completely autonomous, creating the required folder structure (Table 2), inserting the user information in the database and moving the received files to their respective locations, and it’s also used on the front-end application.
Table 2 - Server Folder Structure
/sensorsDataTese/accel/device_id/DD-MM-YY.csv /sensorsDataTese/accel/device_id/DD-MM-YY_2.csv /sensorsDataTese/accel/device_id/DD-MM-YY_3.csv
On the server, each student will have their respective folder, identified by the device id generated on the mobile client, where all the CSV files are stored, in case a student uploads more than one CSV file per day, a number is added at the end of the filename (Table 2). The server also runs apache2 which allows students or teachers to check their own data, via browser, or the data from all the students (in case the user is a teacher). The server is also responsible for analysis tools, that extract information and generate REA charts.
3.4.1 Registry and Login Systems
The registry process starts in the mobile client, where the students fill the formulary, the application is responsible for inserting the data filled by the users in the database. After that first registry, and after the student’s formulary information is uploaded to the server, they can proceed to the registry in the web application, to do so, they need to complete the registry formulary with all the necessary data for their registration to be successful. For a professor to register on the system, he needs to insert a username, email, password, name, and tax number? (NIF), since the process needs to be controlled, to avoid student’s registration as professors, a field approved was added to the table professor, once a teacher registration is complete, that field is set as 0. To proceed to the login that value needs to be changed to 1 by the administrator. After the registration is complete, and the field approved is set to 1 by the administrator, the professor can log in. The fields username and password have a minimum size of 4 characters and 6 characters respectively, and the field username is a unique field. When the registration process has been completed with success, the user can proceed to the login. In order to login the students only need their username and password. After that process is complete, students and teachers can visualize their own information, and in case of a professor, visualize his student’s performance. The database has an entity called username, which works as a pool of usernames, since students and teachers are two different entities, maintaining this
Assessing the effort of exercise using low cost sensors
way their uniqueness, as can be seen in the Figure 8, the field professor is used to hide sensitive information about the collections from the students.
The password fields are being encrypted with password_hash, using the PASSWORD_DEFAULT [66], which uses the bcrypt algorithm. When the users are logging in, the password is verified using password_verify [67], which verifies that the given hash matches the given password, it returns true if the password and the hash match, or false if they don’t match.
3.4.2 Teacher view
This view allows the teacher to perform a series of tasks, like submitting the times of each activity to calculate the REA (see Figure 8), displaying the results calculated in a table. After these times are submitted, they will be inserted on the table activity_rea of the database. These times will be needed to calculate the REA of each activity during a determined time. After the REA values are calculated they will be inserted on the table user_rea of the database.
Figure 8 - On the left side are inserted the beginning and the ending of each activity. On the right side are displayed the last calculated values.
The calculated REA values can be displayed by class, date or all the results calculated at the time. All the information about the collection times can also be displayed by class, date or all the collections done to date (see Figure 9).
Assessing the effort of exercise using low cost sensors
40
It also has a control panel, that allows the teacher to check the classes he teaches, add, and remove students from a class, displaying on a table all the students that are “registered” in a class already, he can also check the registered students by class.
The home page displays all students who are enrolled in a class taught by the teacher logged in. The teacher only needs to select the student from the list displayed on the left (see Figure 14), to retrieve the charts and all the information related to the selected student, this displayed information is the same as the one displayed in the student view.
The charts (see Figure 10) were generated for each student with the REA values that were stored in the database as well as the data of each accelerometry collection. In order to generate the charts, Google bar charts [68] was used.
Figure 10 - Teacher’s Home page.
3.4.3 Student view
This view is responsible for displaying all the information related to the logged student, such as weight, height, BMI, class as well as the generated charts obtained from their accelerometry collections data, with this data being collected throughout physical education classes. First, students need to complete their registration process, and after the login process is complete they will be redirected to their homepage (see Figure 11).
Assessing the effort of exercise using low cost sensors
Figure 11 - Student’s page.
3.5. Remarks
Adapting technology to physical education classes, tends to attract the student’s interest, the accelerometry data collection, can be seen as a way to make students more competitive among themselves, and a way to help the teacher as a complement to the evaluation over the curricular year.
The mobile client wasn’t changed due to the fact, that some of the students that were collecting accelerometry data this year, also collected data last year, and some of them still had the application installed on their smartphones from the previous year. In a future implementation, the mobile client should also have a unique field, for the students to insert, like a username or email.
Unfortunately, not all the students from each class were able to collect accelerometry data during any of the collections, due to other operating systems on their smartphones, parent’s permission or simply didn’t want to do the collections. The data model can be changed to, support collections from other schools.
The charts displayed on the teacher and student views, are only shown after the teacher submit the times of each activity performed during a collection, because to calculate the REA for all the activities the teacher needs to input the beginning and ending of each activity.
4. Analysis of collected data
4.1. Introduction
In this chapter, the experiments that were made using the accelerometry data that was collected in the physical education classes are discussed. First is given an explanation about the collection procedure, and then are presented the students characteristics.
These experiments comprised for the following physical activities: volleyball, handball, basketball, and futsal. This chapter displays REA values on each activity using three different approaches, by displaying charts with the data obtained during the collections. Each approach displays two charts for each activity, the first one being responsible for displaying the REA values captured during two collections, and the second ones demonstrates the students that were able to do three collections during the curricular year. Students 12 – 13 only managed to perform one collection, so since it won’t be possible to evaluate their progress, they won’t appear on the next subtopics.
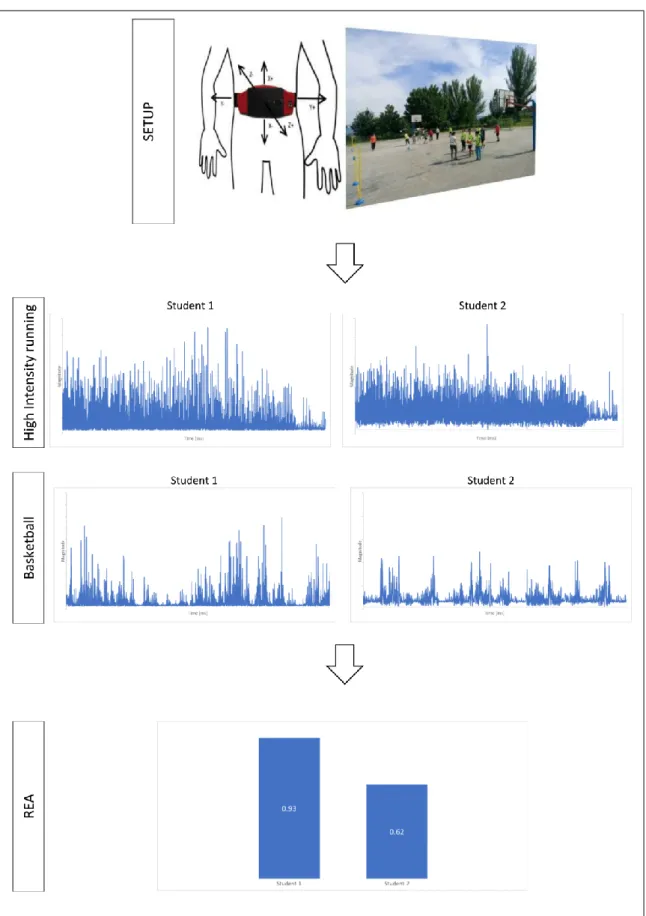
Figure 12, presents schematically the complexity reduction via REA, that is the base of this study, first the setup shows how the accelerometry data is captured, and has a picture of one of the collections with students performing basketball, the high intensity running (HIRA) and basketball charts were generated from the accelerometry data that is on the csv files, with the time (millisecond) being displayed on the X axis, and the magnitude being displayed on the Y axis, and finally, the REA values for the two students during the basketball activity. As can be seen the complexity of the two basketball charts, was reduced to two chart columns with the REA for each student.
Assessing the effort of exercise using low cost sensors
44
Assessing the effort of exercise using low cost sensors
4.2. Collection procedure
Four data collections were scheduled, allowing us to visualize the student’s progression. Professor F. Ferreira conducted the class, instructing the students through the different activities. The activities are composed of 4 different sports: volleyball, handball, basketball, and futsal, and they were performed with team matches of equal team size and equal match length.
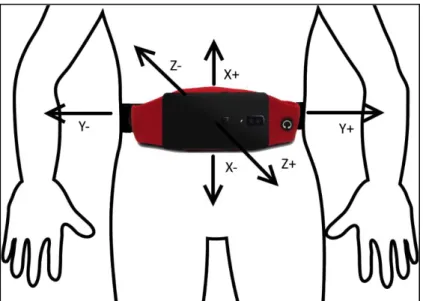
To collect the accelerometry data, a smartphone bag was provided to the students, that bag needs to be placed on their waist, to allow them the execution of the activities in the most comfortable way, and without disturbing their performance of the physical activities. The students need to position their smartphone, on their smartphone bag, and the phone needs to be placed with the back facing forward, it’s top pointing left, and must be in front of the subject waist (see Figure 13).
Figure 13 - Smartphone position during accelerometry collection.
Every student needs to start the data collection at the same time, allowing this way an easier and more accurate activity identification and extraction, and making the process easier for the teacher. The entire class was recorded without any interruptions, allowing the identification of each activity by a timestamp. Each activity had an estimated time (see Table 3), between them there were 2 minutes breaks, to allow the students to rest, drink water, and prepare for the next activity. Due to some delays, like students spending more time than the break time, or the teacher giving instructions for the next activity, pauses tend to take longer, which led to timing the beginning and ending of each activity with a chronometer, granting this way more precise times, which will influence the REA calculation for each activity, therefore making these values more accurate (for each activity as well as overall).
Assessing the effort of exercise using low cost sensors
46
Table 3 – Physical activity list. Activity Duration Description
Volleyball 13 Team match of 3x3 Handball 13 Team match of 3x3 Basketball 13 Team match of 3x3 Futsal 13 Team match of 3x3
From all the collections made, datasets were successfully received from 13 students, only six used the same smartphone during all the collections, other six changed at least once, and one changed twice. (see Table 4).
Table 4 – Number of collections, devices and description made by each student.
Students ID Number of Collections
Number of
Device used Description
Student1 2 1 -
Student2 2 1 -
Student3 2 2 Each collection using different devices Student4
3
2 First two collections with one device, third with another one
Student5 2 1 -
Student6 2 1 -
Student7
3
2 First two collections with one device, third with another one
Student8 2 2 Each collection using different devices Student9
3
3 First two collections with one device, third with another one
Student10
3
2 First two collections with one device, third with another one
Student11
3
2 First two collections with one device, third with another one
Student12 1 1 -
![Figure 3 - The left panel represents the general data types, the right panel represents the 4 common research interests, the mid panel contains the 6 common analysis pathways between the data and the research interests [50]](https://thumb-eu.123doks.com/thumbv2/123dok_br/18057202.863496/31.892.195.742.110.369/represents-represents-research-interests-contains-analysis-pathways-interests.webp)