Features Processing and Transformations
AN APPROACH TO VARIABLE AGGREGATION IN EFFICIENCY ANALYSIS
Veska Noncheva, Armando Mendes, Emiliana Silva
Abstract: In the nonparametric framework of Data Envelopment Analysis the statistical properties of its estimators have been investigated and only asymptotic results are available. For DEA estimators results of practical use have been proved only for the case of one input and one output. However, in the real world problems the production process is usually well described by many variables. In this paper a machine learning approach to variable aggregation based on Canonical Correlation Analysis is presented. This approach is applied for efficiency estimation of all the farms in Terceira Island of the Azorean archipelago.
Keywords: Canonical Correlation Analysis, Data Envelopment Analysis, Efficiency, Variable Aggregation ACM Classification Keywords: H.2.8 Data mining, G.3Multivariate statistics, G.4Efficiency
Conference: The paper is selected from International Conference "Classification, Forecasting, Data Mining" CFDM 2009,
Varna, Bulgaria, June-July 2009
Introduction
Data Envelopment Analysis (DEA) is becoming an increasingly popular management tool. It is a mathematical programming based technique. The task of the DEA is to evaluate the relative performance of units of a system. It has useful applications in many evaluation contexts.
DEA makes it possible to identify efficient and inefficient units in a framework where results are considered in their particular context. The units to be assessed should be relatively homogeneous and are originally called Decision Making Units (DMUs). DMUs can be manufacturing units, departments of a big organization such as universities, schools, bank branches, hospitals, medical practitioners, power plants, police stations, tax offices, hotels, or a set of farms. DEA is an extreme point method and compares each DMU with only the "best" DMUs. DEA can be a powerful tool when used wisely. A few of the characteristics that make it powerful are:
- DEA can handle multiple input and multiple output models.
- DMUs are directly compared against a peer or combination of peers.
- Inputs and outputs can have very different units. For example, one variable could be in units of lives saved and another could be in units of dollars without requiring an a priori tradeoff between the two.
The same characteristics that make DEA a powerful tool can also create problems. An analyst should keep these limitations in mind when choosing whether or not to use DEA.
- Since DEA is an extreme point technique, noise such as measurement error can cause significant problems.
- When the number of inputs or outputs is increased, the number of observations must increase at an exponential rate.
- For DEA estimators, useful theoretical results have been obtained only for the case of one input and one output variable.
The approach presented in this paper is focused on measuring efficiency when the number of DMUs is few and the number of explanatory variables needed to compute the measure of efficiency is too large. We approach this problem from a statistical standpoint through variable aggregation. The aggregation in our approach is not fixed.
Variable Aggregation in DEA
DEA estimators are biased by construction. When the number of exploratory variables is large, unless a very large quantity of data are available, the resulting imprecision will manifest itself in the form of large bias, large variance, and very wide confidence intervals (see [Simar and Wilson, 2008]). Because of it, the question of obtaining an appropriate aggregate input and aggregate output from appropriate individual inputs and outputs, respectively, is an important one. A natural way to define an aggregate input (or an aggregate output) is to assume a linear structure of aggregation of the input variables (and outputs, respectively). One of the most important issues here is the choice of weights in the aggregation.
A subtle technique for the aggregation of inputs or outputs is the use of weight restrictions. This way the unimportant variables will still count in the overall model but only up to the specified limit of ‘importance’. Weights choice may be done by the researcher according his opinion about the contribution of each variable. In our machine learning approach the weights are not fixed. They are extracted from data describing the production process under investigation. To achieve this aim we apply Canonical Correlations Analysis (CCA) to aggregate automatically both input and output data sets.
Obviously the input and output sets of variables in a production process are related. We are concerned with determining a relationship between the two sets of variables. The aim is the linear combinations that maximize the canonical correlation to be fond. In CCA such a linear combination is called “canonical variate” and in DEA it will be used as an aggregate variable.
In this paper, we propose CCA to aggregate both input and output variables in order to get final input
and output,
respectively.
Canonical Correlation Analysis
Canonical Correlation Analysis (CCA) is a multidimensional exploratory statistical method. A canonical correlation is the correlation of two latent variables, one representing a set of independent variables, the other a set of dependent variables. The canonical correlation is optimized such that the linear correlation between the two latent variables (called canonical variates) is maximized. There may be more canonical variates relating the two sets of variables. The purpose of canonical correlation is to explain the relation of the two sets of original variables. For each canonical variate we can also assess how strongly it is related to measured variables in its own set, or the set for the other canonical variate.
Both methods Principal Components Analysis (PCA) and CCA have the same mathematical background. The main purpose of CCA is the exploration of sample correlations between two sets of quantitative variables, whereas PCA deals with one data set in order to reduce dimensionality through linear combination of initial variables.
Another well known method can deal with quantitative data. It is Partial Least Squares (PLS) regression. However, the object of PLS regression is to explain one or several response variables (outputs) in one set, by variables in the other one (the input). On the other hand, the object of CCA is to explore correlations between two
sets of variables whose roles in the analysis are strictly symmetric. As a consequence, mathematical principles of both PLS and CCA methods are fairly different.
The canonical coefficients of a canonical variate are standardized coefficients and their magnitudes can be compared. However, the canonical coefficients may be subject to multicollinearity, leading to incorrect judgments. Also, because of suppression, a canonical coefficient may even have a different sign compared to the correlation of the original variable with the canonical variable. Therefore, instead, we interpret the relations of the original variables to a canonical variable in terms of the correlations of the original variables with the canonical variables - that is, by structure coefficients.
Example: Terceira’s Farms’ Efficiency Measurement
Terceira is the second biggest island in the Azorean archipelago. The Azores islands belong to Portugal with a population of about 250000 inhabitants. The most part (about 75%) of this population is in S. Miguel and Terceira islands. The main economic activity is dairy and meat farming. In S. Miguel, Terceira and S. Jorge islands, about 24% of the farms produce only milk, other 13% of farms produce only meat and 24% produce both and other cultures as well. The remaining farms produce other agricultural productions. Dairy policy depends on Common Agricultural Policy of the European Union and is limited by quotas. In this context, decision makers need knowledge for deciding the best policies in promoting quality and best practices. One of the goals of our work is to provide Azorean Government with a reliable tool for measurement of productive efficiency of the farms.
In Azores there are about 15.107 farmers. Azorean farms are small - about 8 hectares per farm, what is about the half of the average European farm dimension (15.8 in 2003). The production system is primarily based on grazing (about 95% of the area). In the last years, the most representative expenses – based in data of FADN (Farm Account Database Network) are on concentrates, annual depreciation, rents and fertilizers. The subsidies are important for the dairy farms, and in 2004 they were about 61.6% of all profit. Some of these subsidies are compensations for low selling prices received by farmers, and so they are due after the production of meat and milk, others are incentives to investment and compensation for high prices of production factors. There are also subventions to improve ecological production.
Some research work on the dairy sector in Azores has been already done ([Marote and Silva, 2002], [Silva, et al. 2001]). The beef sector in Azores has been investigated by means of Stochastic Frontier Analysis ([Silva, 2004])). Any resource used by an Azorean dairy farm is treated as an input variable and because of it the list of variables that provide an accurate description of the milk and meat production process is large. The names of all input variables used in the analysis are the following: EquipmentRepair, Oil, Lubricant, EquipmentAmortization, AnimalConcentrate, VeterinaryAndMedicine, OtherAnimalCosts, PlantsSeeds, Fertilizers, Herbicides, LandRent, Insurance, MilkSubsidy, MaizeSubsidy, SubsidyPOSEIMA, AreaDimension, and DairyCows. The names of output variables are Milk and Cattle. The number of all farms in Terceira is 30.
The analysis of the Terceira’s farms efficiency is implemented in R statistical software version 2.8.1 using the DEA, FEAR and CCA packages and routines developed by the authors (see [R Development Core Team, 2007]). Outliers may influence the results. Because of it we start the data analysis with outlier detection. One outlier obtained in Terceira data was the result of a recording error and it was corrected. We used again the statistical methodology presented in [Wilson, 1993] and implemented in FEAR package to look for new atypical observations. Using the graphical analysis presented in Figure 1 another three observations could also be identified as outliers. However data from Terceira Island are viewed as having come from a probability distribution and it is quite possible to observe few points with low probability. One would not expect to observe many such points, given their low probability. The fact that a particular observation has low probability of occurrence is not
sufficient to warrant the conclusion that this observation is an error. More errors in the available data are not identified.
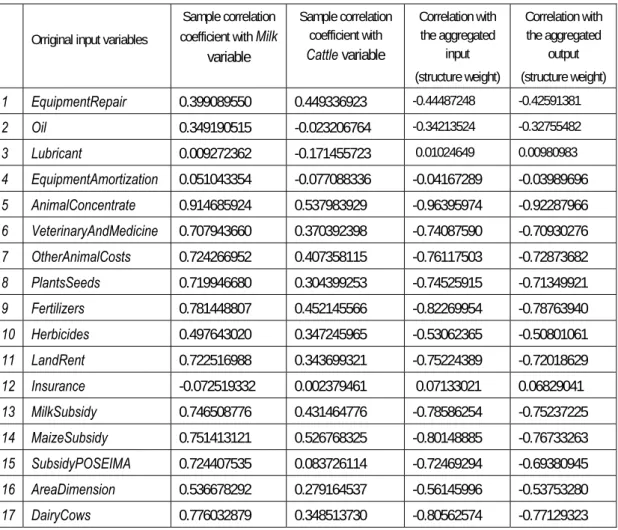
The application of canonical correlation analysis aims at highlighting correlations between input and output data sets, called X and Y, respectively. Two preliminary steps calculate the sample correlation coefficients and visualise the correlation matrixes. All sample correlation coefficients are presented in Table 1 and the correlation matrixes are visualised in Figure 2.
Figure 1. Plot produced by the outlier detection procedure.
Figure 2. Visualisation of sample correlation coefficients.
1 2 3 4 5 6 7 8 9 10 11 12 13 14 15
Cattle
Table 1. Sample correlation coefficients and correlations of the original inputs
with both aggregated input and output.
Orriginal input variables
Sample correlation coefficient with Milk
variable Sample correlation coefficient with Cattle variable Correlation with the aggregated input (structure weight) Correlation with the aggregated output (structure weight) 1 EquipmentRepair 0.399089550 0.449336923 -0.44487248 -0.42591381 2 Oil 0.349190515 -0.023206764 -0.34213524 -0.32755482 3 Lubricant 0.009272362 -0.171455723 0.01024649 0.00980983 4 EquipmentAmortization 0.051043354 -0.077088336 -0.04167289 -0.03989696 5 AnimalConcentrate 0.914685924 0.537983929 -0.96395974 -0.92287966 6 VeterinaryAndMedicine 0.707943660 0.370392398 -0.74087590 -0.70930276 7 OtherAnimalCosts 0.724266952 0.407358115 -0.76117503 -0.72873682 8 PlantsSeeds 0.719946680 0.304399253 -0.74525915 -0.71349921 9 Fertilizers 0.781448807 0.452145566 -0.82269954 -0.78763940 10 Herbicides 0.497643020 0.347245965 -0.53062365 -0.50801061 11 LandRent 0.722516988 0.343699321 -0.75224389 -0.72018629 12 Insurance -0.072519332 0.002379461 0.07133021 0.06829041 13 MilkSubsidy 0.746508776 0.431464776 -0.78586254 -0.75237225 14 MaizeSubsidy 0.751413121 0.526768325 -0.80148885 -0.76733263 15 SubsidyPOSEIMA 0.724407535 0.083726114 -0.72469294 -0.69380945 16 AreaDimension 0.536678292 0.279164537 -0.56145996 -0.53753280 17 DairyCows 0.776032879 0.348513730 -0.80562574 -0.77129323
Figure 2 highlights a significant correlation between Milk and AnimalConcentrate and nearly null correlation
between Milk and Lubricant, Milk and EquipmentAmortization, and Milk and Insurance.
The correlation coefficient between the two canonical variates, presenting the production process of Terceira farms, is 0.957.
The canonical weights (canonical coefficients) explain the unique contributions of original variables to the canonical variable. In this example the small canonical coefficients are a result of existing multicollinearity. Some canonical coefficients even have a different sign compared to the correlation of the original variable with the canonical variable. Therefore, we follow the standard approach to interpreting the relations of the original variables to a canonical variable in terms of the correlations of the original variables with the canonical variables - that is, by structure coefficients. The structure weights explain the simple, overall correlation of the original variables with the canonical variable. The structure weights are reported in Table 1 and Table 2. The canonical weights are reported in Table 3. From the first two tables we can conclude that both canonical variates are predominantly associated with the following original inputs: Animal Concentrate, Fertilizers, DairyCows, MaizeSubsidy, MilkSubsidy, OtherAnimalCosts, PlantsSeeds, LandRent, VeterinaryAndMedicine, SubsidyPOSEIMA and with the original output variable Milk.
Computational aspects of the canonical correlation analysis are implemented in CCA package in R (see [González et al., 2008]).
Both, the original inputs and outputs are aggregated into overall measures called aggregate input variate and aggregate output variate, respectively.
Table 2. Correlations of the original outputs with both aggregated input and output.
Original outputs Correlations with the aggregated input
(structure weights)
Correlations with the aggregated output (structure weights)
Milk -0.9529591 -0.9953781
Cattle -0.5225409 -0.5458007
Table 3. Canonical weights.
Input variables (X)
Estimated coefficients for the input variate
Output variables (Y)
Estimated coefficients for the output variate
EquipmentRepair 2.839421e-05 Milk -3.419875e-05
Oil 1.549179e-05 Cattle 3.778954e-05
Lubricant 1.199566e-03 EquipmentAmortization -3.131292e-06 AnimalConcentrate -8.497169e-05 VeterinaryAndMedicine 1.473172e-05 OtherAnimalCosts -5.441544e-06 PlantsSeeds -1.021208e-04 Fertilizers -1.305625e-06 Herbicides 6.589684e-04 LandRent 2.583145e-05 Insurance 1.655867e-04 MilkSubsidy 2.115323e-05 MaizeSubsidy -3.555158e-04 SubsidyPOSEIMA -6.560970e-05 AreaDimension 3.092947e-04 DairyCows -2.520118e-02
Then we use aggregated input and output in the BCC DEA model presented in [Cooper et al., 2007] and described bellow.
An input oriented DEA model aims to minimise inputs while satisfying at least the given output levels. As we mentioned above the dairy policy in Azorean Islands depends on Common Agricultural Policy of the European Union and it is limited by quotas. Because of it we apply an input oriented DEA model.
The input-oriented BCC model evaluates the efficiency of DMUo, o=1,…,n, by solving the linear program: B
θ
min
, subject toθ
Bxo − Xλ
≥ 0 , Yλ
≥ yo,e
λ
=
1
,λ
≥
0
,where
θ
B is a scalar,λ
is a column vector with all elements non-negative,e
is a row vector with all elementsunity, and n is the number of DMUs.
The BCC problem is solved using a two-phase procedure. In the first phase, we minimise θB and, in the second
optimal value obtained in the first phase. An optimal BCC solution is represented by (θB*, λ*, s-*, s+*), where s-* and s+* represent the maximal input excesses and output shortfalls, respectively. If an optimal BCC solution (θB*, λ*, s -*, s+*) satisfies θB*=1, s-*=0, and s+*=0, then the DMUo is called BCC-efficient. The sum s-* + s+* , called slack, may
essentially be viewed as allocative inefficiency.
Computational aspects of the BCC model are implemented in both DEA and FEAR packages in R.
We build the DEA analysis on aggregated measures. Table 4 contains the DEA estimates of efficiency. All slacks are zeros. The farms 3, 8,14,17 and 20 are BCC-efficient.
For purposes of efficiency measurement, the upper boundary of the production set is of interest. The efficient frontier is the locus of optimal production plans (e.g., minimal achievable input level for a given output) and it is visualised on Figure 3.
Table 4. Efficiency of Terceira’s farms.
Figure 3 . The DEA estimator of the production set obtained by the BCC Model.
Conclusion
In our approach to efficiency measurement CCA provides an aggregation of both input and output units and then DEA provides efficient units. The aggregation can cause additional bias in an DMU’s technical efficiency scores. The effects of the input aggregation on efficiency indicators have not been investigated. Estimating the aggregation bias is a question of our future research.
DMU 1 2 3 4 5 6 7 8 9 10 Efficiency 0.885 0.866 1.000 0.971 0.916 0.874 0.941 1.000 0.883 0.975 DMU 11 12 13 14 15 16 17 18 19 20 Efficiency 0.867 0.824 0.845 1.000 0.894 0.896 1.00 0.899 0.998 1.000 DMU 21 22 23 24 25 26 27 28 29 30 Efficiency 0.960 0.861 0.861 0.890 0.870 0.882 0.962 0.882 0.858 0.782
Acknowledgments
This work has been partially supported by Direcção Regional da Ciência e Tecnologia of Azores Government through the project M.2.1.2/l/009/2008.
Bibliography
[Cooper et al., 2007] Cooper, W. W., Seiford, L. M. and Tone, K. Data envelopment analysis: a comprehensive text with models, applications, references and DEA-solver software. Second edition. Springer. New York. ISBN 0-387- 45281-8, 2007.
[González et al., 2008] Ignacio González, Sébastien Déjean, Pascal G. P. Martin, and Alain Baccini. CCA: An R Package to Extend Canonical Correlation Analysis. In: Journal of statistical software Vol. 23, Issue 12, Jan 2008
[Marote and Silva, 2002] Eusébio Marote, Silva, Emiliana. Análise dinâmica da eficiência das explorações leiteiras da ilha Terceira. In: Actas do Congresso de Zootecnia, 12ª ed., 2002
[R, 2008] R Development Core Team. R: A Language and Environment for Statistical Computing, R Foundation for Statistical Computing, Vienna, Austria, ISBN 3-900051-07-0, http://www.R-project.org, 2008
[Silva, et al. 2001] Emiliana Silva, Julio Berbel, and Amílcar Arzubi. Tipología y análisis no paramétrico de eficiencia de explotaciones lecheras en Azores (Portugal) a partir de datos de RICA-A. In: Economía agraria y recursos naturales: Nuevos enfoques y perspectivas – Actas do Congreso de la Asociación Española de Economía Agraria, 4ª ed., Universidad Pública de Navarra, 2001
[Silva, 2004] Emiliana Silva and Fátima Venâncio. A competitividade das explorações pecuárias no Faial: Recurso a metodologias alternativas. In: Actas do Congresso de Economistas Agrícolas, 4ª ed. , 2004
[Simar and Wilson, 2008] Simar, L., and P.W. Wilson. Statistical Inference in Nonparametric Frontier Models: Recent Developments and Perspectives, in: H. Fried, C.A.K. Lovell, S. Schmidt (eds) The Measurement of Productive Efficiency and Productivity Change, New York, Oxford University Press, 421-521, 2008
[Wilson, 1993] Paul W. Wilson. Detecting outliers in deterministic nonparametric frontier models with multiple outputs. In: Journal of Business and Economic Statistics, 11, pp. 319-323, 1993.
Authors' Information
Veska Noncheva – Associate Professor, University of Plovdiv, 24 Tzar Assen Str, Plovdiv 4000, Bulgaria; Researcher, CEEAplA, Azores University, Ponta Delgada 9501-801, Portugal; e-mail: [email protected]
Armando Mendes – Researcher; CEEAplA, Azores University, Ponta Delgada 9501-801, Portugal; e-mail: [email protected]
Emiliana Silva – Researcher; CEEAplA, Azores University, Angra do Heroísmo 9700-851, Portugal; e-mail: [email protected]