Carlos Pestana Barros & Nicolas Peypoch
A Comparative Analysis of Productivity Change in Italian and Portuguese Airports
WP 006/2007/DE _________________________________________________________
Paula C. Albuquerque and João C. Lopes
Economic Impacts of Ageing: An Interindustry Approach
WP 01/2010/DE/SOCIUS/UECE _________________________________________________________
Department of Economics
WORKING PAPERS
ISSN Nº 0874-4548
Economic Impacts of Ageing: An Interindustry Approach
Paula C. Albuquerque and João C. Lopes
Autobiographical notes:
Full name: Paula Cristina A. Mateus de Albuquerque
Affiliation: ISEG, School of Economics and Management – UTL, Technical University of Lisbon, and SOCIUS, Research Unit on Economic Sociology and Organizations (ISEG/UTL)
E-mail address: pcma@iseg.utl.pt
Full adress: ISEG, Rua Miguel Lupi, nº 20, Gab.604, 1249-078 Lisboa - Portugal Phone number: +351 21 392 59 05
Brief professional biography: Assistant professor at ISEG–UTL – Economics
Department(microeconomics); researcher at SOCIUS (the Economics of Ageing); last published paper: Albuquerque, P. C., (2009) “The Elderly and the Extended Household in Portugal: An Age-Period-Cohort Analysis”, Population Research and Policy Review, Vol.28, No.3, pp.271-300
Full name: João Carlos Ferreira Lopes
Affiliation: ISEG, School of Economics and Management – UTL, Technical University of Lisbon, and UECE, Research Unit on Complexity and Economics (ISEG/UTL)
E-mail address: jcflopes@iseg.utl.pt
Full adress: ISEG, Rua Miguel Lupi, nº 20, Gab.404, 1249-078 Lisboa - Portugal Phone number: +351 21 392 59 67
2
Economic Impacts of Ageing: An Interindustry Approach
Abstract:
Purpose – The purpose of this paper is to quantify the impact of the evolution of consumption patterns associated with ageing on the relative importance of industries in Portugal.
Design/Methodology/Approach – This paper uses data from the Family Spending Survey to disaggregate the Household column of the Portuguese Input-Output Table in different age groups, projecting their consumption, using the latest demographic projections made by Statistics Portugal (INE).
Findings – The study identifies the industries that are likely to be stimulated by the ageing of the Portuguese populations, as well as the industries that will most likely become disadvantaged by the process.
Social implications – The task of identification of growing and declining industries due to ageing is important to help the design of employment, environmental, and social policies.
Original/Value– The contemporary demographic trends in western societies have added to the importance of studying the economic and social consequences of ageing. Previously, the main issues have been the labour market effects, the sustainability of social security systems, and long-term care. In this paper, we address a different research topic, quantifying the sectoral impact of the evolution of consumption patterns associated with ageing.
Keywords Ageing; Input-output; Consumption behaviour
Paper type Research paper
1. Introduction
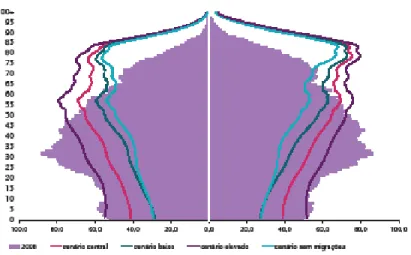
The contemporary demographic trends in western societies have increased the importance
of studying the economic and social consequences of ageing. Broad demographic
changes that started to take place after World War II are replacing a traditional pyramidal
structure with an inverted pyramid (see Figure 1).
3 The main issues have been the labour market effects, the sustainability of social security
systems and long-term care of the elderly (see, e.g. Fertig and Schmidt (2004); Onofri
(2004); Poole and Wheelock (2005); Martins et. al. (2009)).
In this paper, we address a different research topic, quantifying the sectoral impacts of the
evolution of consumption patterns associated with ageing, along the lines suggested in
Dewhurst (2006) and Kronenberg et al (2008).
Firstly, we use data from the Family Spending Survey of 2005/06 published by Statistics
Portugal (INE) to characterise the consumption patterns of Portuguese households by age
of the reference person (Section 2).
Next, we make the correspondence between household consumption by COICOP
commodity groups and (domestic) consumption demand directed to each of the 55
(input-output) industries with positive production in Portugal, then disaggregating the
Household column of the Portuguese Input-Output Table into two different age groups
(young and old) and comparing the respective sectoral structures (Section 3).
At this stage of our research, we use the demographic projections of INE until 2060
(presented in Section 4) to highlight (and quantify) feasible changes in the relative
importance of specific productive sectors (Section 5).
In a future stage of research, we plan to quantify also the energy and environmental
impacts of ageing in Portugal (for an interesting application to the German case, see
Kronenberg et al, 2008) and integrate some flexibility in demand and supply behaviours
on the lines of the study of demographic changes in the Chicago Region made by Yoon
4 2. Consumption behaviour of households
Based on data from the Portuguese Household Budget Survey, 2005-06, Figures 2 and 3
below show the allocation of current consumption expenditure by age categories.
Expenditures are aggregated into the following 12 categories (COICOP division):
01 - Food and non-alcoholic beverages
02 - Alcoholic beverages, tobacco and narcotics 03 - Clothing and footwear
04 - Housing, water, electricity, gas and other fuels
05 - Furnishings, household equipment and routine household maintenance 06 - Health
07 - Transport 08 - Communication 09 - Recreation and culture 10 - Education
11 - Restaurants and hotels
12 - Miscellaneous goods and services
Take in Figures 2 and 3
The middle-age households are those that consume more, on average. Of course, this is
an average consumption per household and household composition is not independent of
age. Expenditure on transport, education, recreation and culture, restaurants and hotels
clearly declines with age, whereas the current older households spend a larger share of
their budget on housing, water, electricity and fuel, or on health.
This paper assumes that this pattern will not change in the future – a strong assumption
since tastes and purchasing power of different age categories may change, but a
reasonable starting point - to measure the effect of the demographic composition of
5 3. Conversion of household spending into (domestic) consumption demand
3.1 Correspondence COICOP – NACE/CLIO
The impact of changes in consumption resulting from the modification of the
demographic composition of the population must be obtained with the help of
input-output matrices. These matrices use a different classification of goods and services - CPA
instead of COICOP (for a full list of these classifications, see UN, 2008).
This fact causes a problem of conversion between the two classifications. Since it has not
been possible to obtain a conversion matrix from INE, we use the corresponding matrix
for Germany (published by the German Federal Statistical Office - Statistisches
Bundesamt - and kindly provided to us by Tobias Kronenberg). Although this is a source
of inaccuracy, we expect the consumption structure by age to be reasonably close
between the two countries, since both are western European, developed countries.
With the data of the Household Budget Survey (INE, 2007), we were able to calculate the
expenditure by product category that was made by households whose reference person
was younger than 65 years old (young households) and the corresponding expenditure
that was made by households whose reference person was 65 or older (old households).
The calculated proportions are to be found in the appendix to the paper, in Table A.3.1.
Data was weighted using the household weights provided in the survey.
Using the correspondence matrix, we allocated this expenditure to goods and services of
the NACE/CLIO notation. This allowed us to calculate the proportion of produced
commodities that was consumed by young households and the proportion consumed by
6 3.2 Adjusting total consumption spending to domestic consumption demand
The procedure described in sub-section 3.1 leaves us with a column of total (or two
columns of age-specific) consumption flows at purchaser prices (see Table A.3.2). In
order to obtain domestic consumption flows at basic prices, necessary to calculate the
sectoral production impacts on domestic firms only, we must consider several issues,
namely, imported components of consumption, margins and (net) product taxes (for a
discussion of these methodological issues, see Mongelli et al., 2008).
Although we have matrices for the base year – 2005 – that allow us to make these
adjustments (Dias, 2008), we opt not to do so this way, because at an early stage, we
discovered (substantial) differences between actual total consumption, registered in the
Total Flows Matrix at purchaser prices and estimated total consumption, using the
Household Budget Survey, 2005-06.
To overcome this limitation, we apply to the actual value of domestic consumption at
basic prices of 2005 the (vertical) structure of consumption (total and by age groups)
calculated with the results described in sub-section 3.1.
Earlier, we made another simplifying assumption, considering null the consumption
flows directed to Portuguese industries with null production in 2005 (these industries
have been excluded from the analysis, as indicated in Section 5 below).
After completing these procedures, we have a column vector of estimated household
domestic consumption demand by industry (at basic prices) in the base year 2005 (see
7 4. Projecting domestic consumption demand
In the next step, we project private consumption from 2005 to 2060, assuming constant
the patterns of consumption of the old and young households and incorporating the
demographic transformations that are expected.
The recent demographic projections issued by INE provide values for the expected
number of individuals by age category. For this paper, we would have liked to have a
household projection, but this does not exist. Therefore, we use another working
assumption: that the expected change in the composition of households is zero, that is, we
do not expect households in 2060 to be either larger or smaller than today.
We consider that the expected number of young households will rise in the same
proportion as the number of young individuals and that the expected number of old
households will rise in the same proportion as the number of old individuals. However,
there are two alternatives when we calculate the growth rate of young and of old
individuals: we may calculate the proportion of individuals under 65 and the proportion
of individuals aged 65+ by comparison with the number of all individuals in the two
years, or by comparing with the number of individuals aged 15 and over, since there are
no reference persons in the survey under 15 years old.
In the first case, the base of comparison – the Portuguese population - is expected to
decrease between 2006 and 2060; in the second case, the base of comparison –
individuals older than 14 - is expected to increase. In both cases, we multiply the base
year per household expenditures by the expected number of households in each age group
8 However, the consumption patterns of young and old people are the same, this difference
having only a level effect, which is not relevant for calculating the sectoral impacts.
In fact, we are only interested in capturing the impact on industry outputs of changes in
the demographic age structure of population (and corresponding consumption patterns of
young versus old individuals). So we proceed as if the total value of domestic
consumption at basic prices in 2060 is exactly the value observed in 2005, but the
projected vector of domestic consumption demand by industry is very different due to the
substantial increase in the relative weight of old consumers, reinforcing some industries
and diminishing the importance of others. The demographic figures used in this study are
presented in Table A.4.1 and the vector of domestic household consumption projected for
2060 in Table A.4.2.
5. Sectoral impacts of demographic changes
Based on the methodologies and results described in the previous sections, we have the
final demand changes presented in Table A.5.1. Our analysis embraces 55 industries,
obtained after eliminating the industries with null production in 2005 (10 - Coal and
lignite; peat; 11 - Crude petroleum and natural gas; 12 - Services incidental to oil and gas
extraction excluding surveying; Uranium and thorium ores; 95 - Private households with
employed persons).
We highlight the industries with the greatest (consumption) percentage growth and with
the greatest decline in Tables 1 and 2.
9 Taking into consideration the final demand changes induced by ageing trends, and using
the well known output multipliers given by the Leontief inverse matrix of the base year
(see Miller and Blair, 2009), we can calculate the industries’ output changes between
2005 and 2060 (see Table A.5.2).
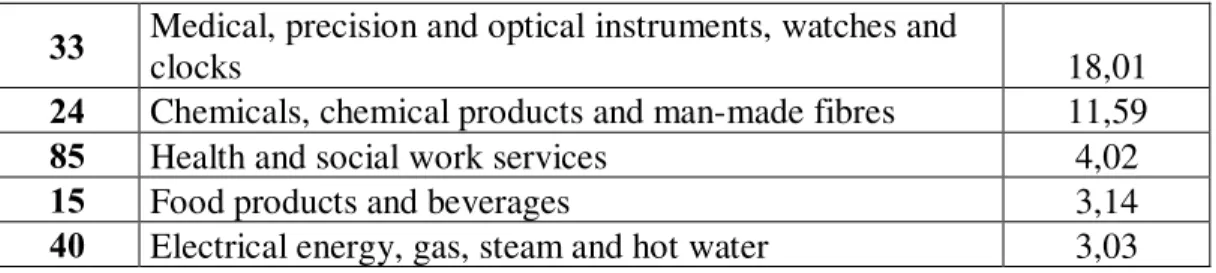
The main output percentage variations, positive and negative, are presented in Tables 3
and 4, respectively. Note that the numerical results and even the rankings of industries do
not necessarily coincide with the previous ones, because of the indirect effects induced by
the inter-industry linkages.
Take in Tables 3 and 4
6. Concluding remarks
In this paper, a first approach to the economic consequences of ageing in Portugal is
made, with a particular incidence in multi-sectoral (or inter-industry) relationships.
After a brief description of the consumption patterns of households by age of the
reference person, the separation is made between two major groups (young: between 15
and 64; old: 65 and over), the consumption structure of these groups being quantified
using the Family Spending Survey of 2005/06, by commodity classification of COICOP.
Next, by applying an appropriate correspondence procedure to COICOP values, the
young and old household total consumptions at purchaser prices by goods and services of
10 After making some inevitable simplifying assumptions to deal with the problems of
imported consumption, margins and commodity taxes, the structures of household
domestic final demand directed at industries is calculated and used to generate base year
(2005) sectoral productions. Supposing that these structures remain unchanged between
2005 and 2060, but considering the effects of demographic changes (the process of
significant ageing of the Portuguese population visible in the demographic projections
conducted by INE), we quantify final demand and productions in 2060 and the
corresponding (significant) percentage changes in this long period of time, even if the
values of global domestic consumption are the same in both of the limiting years.
As would be expected, some sectors gain importance in an ageing society (Medical
instruments; Chemical products – pharmaceuticals; Health services; Electricity, gas and
water, etc.), while other sectors suffer a relative decline (Public administration and
defence services, compulsory social security services; Education services; Office
machinery and computers; Radio, television and communication equipment and
apparatus; Tobacco products; Other transport equipment; etc.).
Input-output analysis is a convenient methodology to quantify these changes, because it
gives not only the direct effects on demands and outputs but also the indirect and induced
effects via multipliers and sectoral linkages.
However, the results of this type of study provide only approximate and very crude trend
indications, since they are based on strong assumptions (constant consumption behaviour
of each age group; fixed technologies; unchanged relative prices of goods, services and
factors; etc.). This is why the extrapolations made in this paper are not predictions for the
future. Nevertheless, they indicate the change in the relative importance of sectors
11 using the available information that may be of use in devising economic, social and
environmental policies in an ageing society.
Acknowledgment: Financial support by FCT (Fundação para a Ciência e a Tecnologia), Portugal is gratefully acknowledged.
REFERENCES
Dewhurst, J.H.L. (2006), “Estimating the effect of projected household composition change on production in Scotland”, Working Paper No. 186, University of Dundee, Department of Economic Studies.
Dias, A.M. (2008), “Sistema integrado de matrizes Input-Output para Portugal, 2005”, Documento de Trabalho No 8/2008, Departamento de Prospectiva e Planeamento (DPP), Lisboa.
Fertig, M. and Schmidt, C.M. (2004), “Gerontocracy in motion? European cross-country evidence on the labour market consequences of population ageing”, in Write, R.E. (ed.), 2004, Scotland’s Demographic Challenge, scotecon.net, University of Stirling.
INE (2007), “Inquérito às Despesas das Famílias 2005-2006”, Lisboa.
INE (2008), “Projecções de população residente: Portugal - 2008-2060 - Metodologia”, Departamento de Estatísticas Demográficas e Sociais, Lisboa.
Kronenberg, T. (2008), “The impact of demographic change on energy use and greenhouse gas emissions”, Paper presented at the Intermediate Input-Output Meeting, Seville, Spain.
Martins, P., Novo A., and Portugal, P. (2009), “Increasing the legal retirement age: the impact on wages, worker flows and firm performance”, IZA DP No 4187.
Miller, R. E. and Blair, P. D. (2009), Input-Output Analysis: Foundations and Extensions,
Second edition. New York: Cambridge University Press (First edition published by Prentice-Hall, 1985).
12 framework. Methodological aspects and modelling implications”, Paper presented at the Intermediate Input-Output Meeting, Seville, Spain.
Onofri, P. (ed.) (2004), The economics of an ageing population: Macroeconomic issues,
ESRI Studies on Ageing, Edward Elgar.
Poole, W. and Wheelock, D. C. (2005), “The real population problem. Too few working, too many retired”, the Regional Economist, Federal Reserve Board of St. Louis, April 2005, pp. 5-9.
UN (2008), System of National Accounts, available at:
http://unstats.un.org/unsd/nationalaccount/SNA2008.pdf (accessed 15 October 2009)
Yoon, S. and Hewings, G.J.D. (2006), “Impacts of demographic changes in the Chicago region”, REAL Discussion Paper 06-T-7.
13 FIGURES:
Figure1: Age pyramids, Portugal, 2008 and 2060
Source: INE, 2009, Projecções de População Residente em Portugal: 2008-2060
Note: Different lines correspond to different scenarios.
15 TABLES
Table 1: Main Positive Consumption Impacts of Ageing (% changes)
33
Medical, precision and optical instruments, watches and
clocks 18,47
24 Chemicals, chemical products and man-made fibres 13,66
45 Construction work 7,50
40 Electrical energy, gas, steam and hot water 5,30 05 Fish and other fishing products; services incidental of fishing 4,72
85 Health and social work services 4,09
14 Other mining and quarrying products 4,06
Table 2: Main Negative Consumption Impacts of Ageing (% changes)
75
Public administration and defence services; compulsory
social… -13,29
80 Education services -11,67
30 Office machinery and computers -8,92
32
Radio, television and communication equipment and
apparatus -8,53
65
Financial intermediation services, except insurance and
pension… -8,35
67 Services auxiliary to financial intermediation -8,35 34 Motor vehicles, trailers and semi-trailers -8,07 91 Membership organisation services n.e.c. -7,86
22 Printed matter and recorded media -7,69
50 Trade, maintenance and repair services of motor vehicles… -6,34 92 Recreational, cultural and sporting services -5,99
16 Tobacco products -5,89
71
Renting services of machinery and equipment without
operator… -5,82
52 Retail trade services, exc. of motor vehicles and motorcy… -5,80
35 Other transport equipment -5,72
72 Computer and related services -5,50
16 Table 3: Main Positive Output Impacts of Ageing (% changes)
33 Medical, precision and optical instruments, watches and
clocks 18,01
24 Chemicals, chemical products and man-made fibres 11,59
85 Health and social work services 4,02
15 Food products and beverages 3,14
40 Electrical energy, gas, steam and hot water 3,03
Table 4: Main Negative Output Impacts of Ageing (% changes)
75 Public administration and defence services; compulsory
social… -13,29
80 Education services -10,82
30 Office machinery and computers -8,78
34 Motor vehicles, trailers and semi-trailers -8,05
32 Radio, television and communication equipment and
apparatus -6,88
16 Tobacco products -5,89
35 Other transport equipment -5,49
91 Membership organisation services n.e.c. -5,15 92 Recreational, cultural and sporting services -4,85
19 Leather and leather products -4,74
18 Wearing apparel; furs -4,68
36 Furniture; other manufactured goods n.e.c. -4,39
17 APPENDIX:
Table A.3.1 – Proportion of expenditures of Young Househlds and of Old Households by COICOP, 2005-2006
Young Old
01.1- Food 0,760431 0,239569
01.2- Non-alcoholic
beverages 0,809002 0,190998
02.1- Alcoholic beverages 0,759006 0,240994
02.2- Tobacco 0,864942 0,135058
03.1- Clothing 0,853778 0,146222
03.2- Footwear 0,869289 0,130711
04.1- Actual rentals for housing 0,863511 0,136489 04.2- Imputed rentals for housing 0,774395 0,225605 04.3- Maintenance and repair of the dwelling 0,703192 0,296808 04.4- Water supply and miscel. services relating to the
dwelling 0,783679 0,216321
04.5- Electricity, gas and other fuels 0,754783 0,245217 05.1- Furniture and furnish., carpets and other floor
coverings 0,872516 0,127484
05.2- Household textiles 0,803302 0,196698
05.3- Household appliances 0,815517 0,184483
05.4- Glassware, tableware and household utensils 0,839053 0,160947 05.5- Tools and equipment for house and garden 0,84367 0,15633 05.6- Goods and services for routine household
maintenance 0,75104 0,24896
06.1- Medical products, appliances and equipment 0,587612 0,412388
06.2- Outpatient services 0,748662 0,251338
06.3- Hospital services 0,616789 0,383211
07.1- Purchase of vehicles 0,887235 0,112765
07.2- Operation of personal transport equipment 0,86933 0,13067
07.3- Transport services 0,821588 0,178412
08.1- Postal services 0,58374 0,41626
08.2- Telephone and telefax
equipment 0,880019 0,119981
08.3- Telephone and telefax services 0,798629 0,201371 09.1- Audio-visual, photogr. and information
processing equipment 0,89472 0,10528
09.2- Other major durables for recreation and culture 0,976655 0,023345 09.3- Other recreational items, equipm., gardens and
pets 0,820419 0,179581
18 services
09.5- Newspapers, books and
stationery 0,878456 0,121544
09.6- Package holidays 0,839501 0,160499
10 - Education 0,930354 0,069646
11.1- Catering services 0,843602 0,156398
11.2- Accommodation
services 0,898677 0,101323
12.1- Personal
care 0,829926 0,170074
12.3- Personal effects n.e.c 0,820438 0,179562
12.4- Social protection 0,871008 0,128992
12.5- Insurance 0,86093 0,13907
12.6- Financial services
n.e.c. 0,889157 0,110843
12.2+12.7- Other services 0,995947 0,004053
Table A.3.2 – Household expenditures by NACE/CLIO category, 2005-06
Cod. Young Old Total Total %
01 1006674867 301476654,4 1308151522 1,94% 02 26961964,57 8027976,218 34989940,79 0,05% 05 26668530,63 8401743,142 35070273,77 0,05% 10 18169387,16 5650438,265 23819825,42 0,04% 11 579334263,6 188216728,4 767550992,1 1,14%
12 0 0 0 0,00%
13 0 0 0 0,00%
14 6276655,987 1906880,498 8183536,486 0,01% 15 8242377785 2473758460 10716136245 15,89% 16 886279767,1 138389955,6 1024669723 1,52% 17 518582635,9 103701386,2 622284022,1 0,92% 18 1471572827 252095964,4 1723668792 2,56% 19 650757199,6 111346059,9 762103259,5 1,13% 20 28208897,28 8282056,057 36490953,34 0,05% 21 288791348,7 67921189,03 356712537,7 0,53% 22 603604547,3 80236862,55 683841409,9 1,01% 23 2661999050 479839549,4 3141838599 4,66% 24 1863667482 907631934 2771299416 4,11% 25 329701357,3 81491040,03 411192397,3 0,61% 26 89099441,3 25585107,9 114684549,2 0,17%
19 28 158237257,6 40766704,19 199003961,8 0,30%
29 409975851 94795045,63 504770896,6 0,75% 30 149677800,3 17612310,5 167290110,8 0,25% 31 59754367,79 9756857,287 69511225,07 0,10% 32 268426437,3 32878055,46 301304492,8 0,45% 33 426388573,1 255699478 682088051,1 1,01% 34 2892180336 370733216,1 3262913552 4,84% 35 189887161,1 30081997,27 219969158,4 0,33% 36 817119761 145175892,7 962295653,7 1,43%
37 0 0 0 0,00%
40 1083729373 352086886,5 1435816260 2,13% 41 141103293,4 38949178,89 180052472,3 0,27% 45 70160516,74 25551248,39 95711765,13 0,14% 50 989824974,6 148782381,4 1138607356 1,69%
51 0 0 0 0,00%
52 134927112,7 21233835,22 156160947,9 0,23% 55 5549443085 1003442626 6552885711 9,72% 60 403146707 87545478,85 490692185,9 0,73% 61 27484272,39 5968357,785 33452630,17 0,05% 62 255550878,9 55494249,78 311045128,6 0,46% 63 495514041,2 94048920,59 589562961,8 0,87% 64 1615617155 400653947,6 2016271103 2,99% 65 15611368,03 1946118,976 17557487,01 0,03% 66 1420024631 241506658,7 1661531290 2,46% 67 272514,4905 33971,75828 306486,2488 0,00% 70 11034916596 3048280866 14083197462 20,89% 71 166607224,2 26180086,5 192787310,7 0,29% 72 25533447,71 4119744,287 29653192 0,04%
73 0 0 0 0,00%
20 Table A.3.3 – Estimated domestic consumption demand at basic prices, 2005
Cod TC (coicop/io)
TC vert.
strct. DC (io/coicop)
01 1308151522 1,98% 1910392901
02 34989940,79 0,05% 51098465
05 35070273,77 0,05% 51215781
13 0 0,00% 0
14 8183536,486 0,01% 11951039
15 10716136245 16,23% 15649586663
16 1024669723 1,55% 1496402926
17 622284022,1 0,94% 908768563
18 1723668792 2,61% 2517204291
19 762103259,5 1,15% 1112957201
20 36490953,34 0,06% 53290507
21 356712537,7 0,54% 520934378
22 683841409,9 1,04% 998665486
23 3141838599 4,76% 4588265240
24 2771299416 4,20% 4047138762
25 411192397,3 0,62% 600495450
26 114684549,2 0,17% 167482547
27 0 0,00% 0
28 199003961,8 0,30% 290620581
29 504770896,6 0,76% 737155231
30 167290110,8 0,25% 244306439
31 69511225,07 0,11% 101512515
32 301304492,8 0,46% 440017807
33 682088051,1 1,03% 996104923
34 3262913552 4,94% 4765080178
35 219969158,4 0,33% 321237648
36 962295653,7 1,46% 1405313341
37 0 0,00% 0
40 1435816260 2,17% 2096831402
41 180052472,3 0,27% 262944284
45 95711765,13 0,14% 139775151
50 1138607356 1,72% 1662794694
51 0 0,00% 0
52 156160947,9 0,24% 228053678
55 6552885711 9,92% 9569676093
60 490692185,9 0,74% 716595022
61 33452630,17 0,05% 48853413
62 311045128,6 0,47% 454242797
21
64 2016271103 3,05% 2944513642
65 17557487,01 0,03% 25640530
66 1661531290 2,52% 2426460183
67 306486,2488 0,00% 447585
70 14083197462 21,32% 20566761577
71 192787310,7 0,29% 281541934
72 29653192 0,04% 43304806
73 0 0,00% 0
74 344708922,3 0,52% 503404588
75 116764487,4 0,18% 170520038
80 1300172364 1,97% 1898740332
85 2290494515 3,47% 3344982893
90 485146484,1 0,73% 708496213
91 119284801,6 0,18% 174200644
92 1070301368 1,62% 1563042279
93 1208582593 1,83% 1764984841
Tot 66041211562 100,00% 96444991000
Table A.4.1 – Demographic Projections, Portugal - 2060
2006 Projection - 2060 Projection - 2060
Resident Population 10599095 10364157
Population 65+ 1828617 3351045
Population < 65 8770478 7013112
Population >14 and <65 7132841 5774802
Population >15 8961458 9125847
Weight of Pop. 65+ in Pop. 15+ 0,204 0,367
A. 1 - Tot Pop. dimin. A. 2 - Pop 15+ augm.
Nº of Families (Survey) 10403 10172 10594
Nº of Young Families (Survey) 8280 6437 6704
Nº of Old Families (Survey) 2123 3735 3890
Nº of Families (Total) 3829464 3744581 3899712
Nº of Young Families (Total) 3048048 2369557 2467723
22 Table A.4.2 – Projected domestic consumption demand at basic prices, 2060
Cod TC (coicop/io) TC vert. strct. DN (io/coicop)
01 1313086035 2,06% 1982938108
02 35086756 0,05% 52985763
05 35516342 0,06% 53634496
13 0 0,00% 0
14 8234937 0,01% 12435873
15 10760603068 16,85% 16249970922
16 932513965 1,46% 1408222637
17 585625741 0,92% 884374343
18 1587605186 2,49% 2397499281
19 701830424 1,10% 1059859183
20 36503216 0,06% 55124810
21 344024804 0,54% 519524141
22 610432353 0,96% 921835693
23 2913794794 4,56% 4400225561
24 3045938988 4,77% 4599781227
25 399706589 0,63% 603611193
26 114287051 0,18% 172588956
27 0 0,00% 0
28 194749290 0,30% 294097856
29 485522578 0,76% 733204982
30 147351349 0,23% 222520534
31 63621850 0,10% 96077628
32 266529176 0,42% 402495226
33 781418574 1,22% 1180048090
34 2900748217 4,54% 4380523459
35 200552538 0,31% 302861549
36 890689816 1,39% 1345062494
37 0 0,00% 0
40 1462044990 2,29% 2207886345
41 178231102 0,28% 269153151
45 99504326 0,16% 150265035
50 1031297253 1,61% 1557398806
51 0 0,00% 0
52 142256790 0,22% 214827058
55 6079859633 9,52% 9181413126
60 467456837 0,73% 705923261
61 31868575 0,05% 48125873
23
63 550707151 0,86% 831642533
64 1960996629 3,07% 2961371031
65 15560801 0,02% 23498921
66 1528898000 2,39% 2308843462
67 271632 0,00% 410201
70 13942489055 21,83% 21055050567
71 175588658 0,27% 265162702
72 27099074 0,04% 40923280
73 0 0,00% 0
74 325130414 0,51% 490991047
75 97905530 0,15% 147850637
80 1110637933 1,74% 1677214000
85 2305709418 3,61% 3481934122
90 480238851 0,75% 725225837
91 106283524 0,17% 160502545
92 972993882 1,52% 1469352804
93 1119795112 1,75% 1691042582
Tot 63865115268 100,00% 96444991000
Table A.5.1 – Domestic Final Demand differences by industry (2005 – 2060)
cod. Industries Changes
Changes % 01 Products of agriculture, hunting and related services 72545207 3,80 02 Products of forestry, logging and related services 1887298 3,69 05 Fish and other fishing products; services incidental of fishing 2418714 4,72
13 Metal ores 0 0,00
14 Other mining and quarrying products 484834 4,06
15 Food products and beverages 600384258 3,84
16 Tobacco products -88180289 -5,89
17 Textiles -24394220 -2,68
18
Wearing apparel; furs
-119705010 -4,76
19 Leather and leather products -53098019 -4,77
20 Wood and products of wood and cork (except furniture)… 1834303 3,44
21 Pulp, paper and paper products -1410238 -0,27
22 Printed matter and recorded media -76829792 -7,69
23
Coke, refined petroleum products and nuclear fuels
-188039679 -4,10 24 Chemicals, chemical products and man-made fibres 552642465 13,66
24
26 Other non-metallic mineral products 5106409 3,05
27 Basic metals 0 0,00
28 Fabricated metal products, except machinery and equipment 3477275 1,20
29 Machinery and equipment n.e.c. -3950249 -0,54
30 Office machinery and computers -21785905 -8,92
31 Electrical machinery and apparatus n.e.c. -5434887 -5,35
32 Radio, television and communication equipment and
apparatus -37522581 -8,53
33 Medical, precision and optical instruments, watches and
clocks 183943167 18,47
34
Motor vehicles, trailers and semi-trailers
-384556718 -8,07
35 Other transport equipment -18376100 -5,72
36 Furniture; other manufactured goods n.e.c. -60250847 -4,29
37 Secondary raw materials 0 0,00
40 Electrical energy, gas, steam and hot water 111054943 5,30 41 Collected and purified water, distribution services of water 6208867 2,36
45 Construction work 10489884 7,50
50
Trade, maintenance and repair services of motor vehicles…
-105395888 -6,34 51 Wholesale trade and commission trade services… 0 0,00 52 Retail trade services, exc. of motor vehicles and motorcy… -13226620 -5,80
55
Hotel and restaurant services
-388262966 -4,06 60 Land transport; transport via pipeline services -10671761 -1,49
61 Water transport services -727541 -1,49
62 Air transport services -6764728 -1,49
63 Supporting and auxiliary transport services; travel agency… -29340983 -3,41
64 Post and telecommunication services 16857390 0,57
65 Financial intermediation services, except insurance and
pension… -2141610 -8,35
66 Insurance and pension funding services, except compulsory …
-117616721 -4,85 67 Services auxiliary to financial intermediation -37384 -8,35
70 Real estate services 488288990 2,37
71 Renting services of machinery and equipment without
operator… -16379232 -5,82
72 Computer and related services -2381526 -5,50
73 Research and development services 0 0,00
74 Other business services -12413541 -2,47
75 Public administration and defence services; compulsory
social… -22669401 -13,29
80
Education services
25
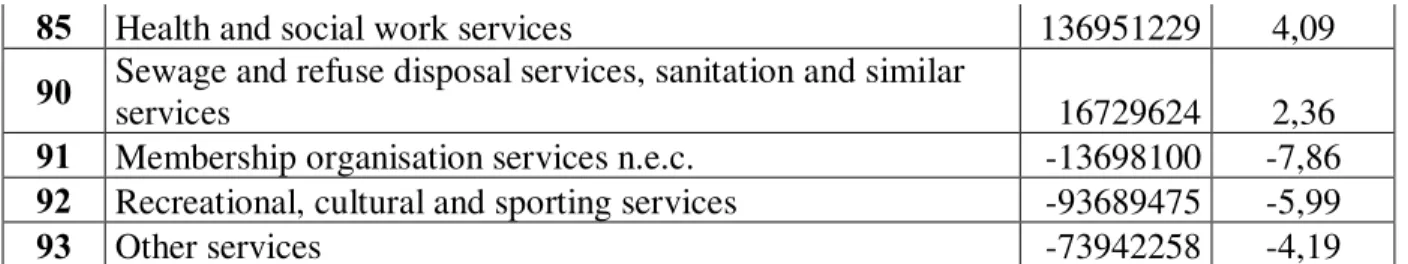
85 Health and social work services 136951229 4,09
90 Sewage and refuse disposal services, sanitation and similar
services 16729624 2,36
91 Membership organisation services n.e.c. -13698100 -7,86 92 Recreational, cultural and sporting services -93689475 -5,99
93 Other services -73942258 -4,19
Table A.5.2 – Industry Output differences (2005 – 2060)
cod. Industries Changes
Changes % 01 Products of agriculture, hunting and related services 239417055 3,03 02 Products of forestry, logging and related services 1961960 0,89 05 Fish and other fishing products; services incidental of fishing 1146831 0,64
13 Metal ores 0 0,00
14 Other mining and quarrying products 3162461 1,96
15 Food products and beverages 666717403 3,14
16 Tobacco products -94315962 -5,89
17 Textiles -64886346 -3,26
18 Wearing apparel; furs -140464611 -4,68
19 Leather and leather products -65376649 -4,74
20 Wood and products of wood and cork (except furniture)… -3565789 -0,62
21 Pulp, paper and paper products 5190219 0,50
22 Printed matter and recorded media -84194567 -3,83
23 Coke, refined petroleum products and nuclear fuels -162512222 -2,74 24 Chemicals, chemical products and man-made fibres 637906719 11,59
25 Rubber and plastic products 26242361 1,91
26 Other non-metallic mineral products 11451956 1,22
27 Basic metals -14952493 -3,57
28 Fabricated metal products, except machinery and equipment -2589297 -0,20
29 Machinery and equipment n.e.c. -6154855 -0,63
30 Office machinery and computers -22395412 -8,78
31 Electrical machinery and apparatus n.e.c. -14470984 -3,81
32 Radio, television and communication equipment and
apparatus -38420724 -6,88
33 Medical, precision and optical instruments, watches and
clocks 188300820 18,01
34 Motor vehicles, trailers and semi-trailers -403689377 -8,05
35 Other transport equipment -18722154 -5,49
36 Furniture; other manufactured goods n.e.c. -78275454 -4,39
37 Secondary raw materials -325748 -0,35
26 41 Collected and purified water, distribution services of water 6150601 1,29
45 Construction work 59590733 1,70
50 Trade, maintenance and repair services of motor vehicles… -100274363 -3,66 51 Wholesale trade and commission trade services… 8372956 0,22 52 Retail trade services, exc. of motor vehicles and motorcy… -12958720 -1,76
55 Hotel and restaurant services -388152947 -3,69
60 Land transport; transport via pipeline services 7984522 0,36
61 Water transport services -332908 -0,29
62 Air transport services -7970913 -1,37
63 Supporting and auxiliary transport services; travel agency… -33113905 -2,21
64 Post and telecommunication services 10385142 0,20
65 Financial intermediation services, except insurance and
pension… 57673699 1,20
66 Insurance and pension funding services, except compulsory …
-113643821 -3,90 67 Services auxiliary to financial intermediation -15332239 -2,04
70 Real estate services 484224588 2,22
71 Renting services of machinery and equipment without
operator… -18209795 -2,52
72 Computer and related services -793585 -0,16
73 Research and development services 3954040 2,29
74 Other business services 32926858 0,34
75 Public administration and defence services; compulsory
social… -22669401 -13,29
80 Education services -223145464 -10,82
85 Health and social work services 150582288 4,02
90 Sewage and refuse disposal services, sanitation and similar
services 19785990 1,97
91 Membership organisation services n.e.c. -13145305 -5,15 92 Recreational, cultural and sporting services -101162912 -4,85