i i
“main” — 2018/3/1 — 16:48 — page 65 — #1
i i
Revista Brasileira de Geof´ısica (2016) 34(1): 65-94 © 2016 Sociedade Brasileira de Geof´ısica ISSN 0102-261X
www.scielo.br/rbg
THE USE OF ALTERNATIVE METHODS FOR DIFFERENTIATION OF BANDED
IRON FORMATIONS AND IRON ORE IN THE BODY N4WS,
SERRA NORTE – CARAJ ´AS MINERAL PROVINCE
Vitor Nascimento Ferreira
1, Adalene Moreira Silva
1, Catarina Labou´e Benfica Toledo
1,
Marta Henriques J´acomo
2, Luciano Mozer de Assis
3and Augusto C´esar Bittencourt Pires
4ABSTRACT.The use of non-traditional geophysical methods is becoming increasingly common in activities involving iron ore, as the increasing ore demand inten-sified the competition in the international market. This motivated us to integrate the physical properties of the rocks to better understand the relations of the iron ore with the proto-ore and host rocks. The work was conducted in N4WS body, Serra Norte, Caraj´as Mineral Province (CMP), located in the state of Par´a, Brazil. The Caraj´as Mineral Province hosts some of the largest world-class iron ore deposits operated by Vale S.A. The results of airborne magnetic data showed that the mineralized bodies previously mapped are not directly linked to the high gradients observed in the amplitude of the analytic signal. This response is related to the proto-ore, constituted by jaspilites with low values of K, eU and eTh. Measurements of the magnetic susceptibility and gamma radiation emission in drill holes were satisfactory. There was a clear differentiation between iron ore, jaspilites and mafic rocks, mainly in the magnetic susceptibility parameter. The gamma-ray results from radioelements separated iron formations and associated mineralization from the adjacent mafic rocks. The use of the non-supervised classification k-means was useful for distinguishing between jaspilites within the same package and to show anomalous areas not previously mapped. The integration of rock physical properties, geological data and airborne geo-physical data produced excellent results. There was a direct correlation between what was measured and what was observedin situat the surface. Thus, it was possible to individualize the lithotypes in the N4WS using the physical properties. This confirms the feasibility of using these methods as an alternative to the currently used tools for iron ore exploration, with the potential to increase the efficient use of human and financial resources investments.
Keywords: multisource data integration, jaspilites, gamma-ray spectrometry, rock physical properties.
RESUMO.A utilizac¸˜ao de m´etodos geof´ısicos n˜ao tradicionais est´a se tornando cada vez mais comum em atividades que envolvem o min´erio de ferro, uma vez que a alta demanda impulsiona o mercado internacional. Este avanc¸o nos leva a integrar a assinatura das propriedades f´ısicas de rocha para melhor entendimento do min´erio de ferro com o protomin´erio e suas rochas adjacentes. O trabalho foi realizado no corpo N4WS, Serra Norte, Prov´ıncia Mineral de Caraj´as (CMP), localizado no estado do Par´a. A Prov´ıncia Mineral de Caraj´as abriga alguns dos maiores dep´ositos de min´erio de ferro de classe mundial, todos explorados pela Vale S.A. Os resultados dos dados aeromagn´eticos mostraram que os corpos mineralizados previamente mapeados n˜ao possuem uma ligac¸˜ao direta com os gradientes elevados observados na amplitude do sinal anal´ıtico. Esta resposta ´e relacionada ao protomin´erio, constitu´ıdo por jaspilitos de assinatura gamaespectrom´etrica relacionados aos baixos valores de K, eU e eTh. As respostas das medidas de susceptibilidade magn´etica e emiss˜ao de radiac¸˜ao gama realizadas nas sondagens dentro do prospecto foram satisfat´orias. Houve uma clara diferenciac¸˜ao entre o min´erio de ferro, jaspilitos e rochas m´aficas, principalmente no parˆametro susceptibilidade magn´etica. Os resultados da gamaespectrometria separaram as formac¸˜oes ferr´ıferas e min´erio das rochas m´aficas adjacentes. O uso da classificac¸˜ao n˜ao-supervisionada K-m´edias foi ´util para distinc¸˜ao entre jaspilitos dentro do mesmo pacote e identificac¸˜ao de ´areas anˆomalas n˜ao mapeadas anteriormente. A integrac¸˜ao entre propriedades f´ısicas de rocha, dados geol´ogicos e dados aerogeof´ısicos mostrou excelentes resultados. Houve uma correlac¸˜ao direta entre o que foi medido e observadoin situna superf´ıcie. Dessa forma, foi poss´ıvel individualizar os litotipos em N4WS utilizando as propriedades f´ısicas de rocha. Isto confirma a viabilidade dos m´etodos aplicados como uma alternativa para as ferramentas utilizadas atualmente na explorac¸ ˜ao de min´erio de ferro, com o potencial para aumento da eficiˆencia dos recursos humanos e investimentos financeiros.
Palavras-chave: integrac¸˜ao de dados multifonte, jaspilitos, gamaespectrometria, propriedades f´ısicas de rocha.
1Universidade de Bras´ılia, Instituto de Geociˆencias, Campus Universit´ario Darcy Ribeiro, Asa Norte, Bras´ılia, DF, Brazil – E-mails: vitor.geo.ferreira@gmail.com; adalene@unb.br; catarinatoledo@unb.br
2Universidade de S˜ao Paulo, IAG – USP, Rua do Mat˜ao 1226, 05508-090 S˜ao Paulo, SP, Brazil – E-mail: marta.jacomo@iag.usp.br
3Vale S.A., Mina de ´Aguas Claras, Avenida de Ligac¸˜ao, n.3580, 34000-000 Nova Lima, Minas Gerais, Brazil – E-mail: luciano.assis@vale.com 4Agˆencia para o Desenvolvimento da Ind´ustria Mineral Brasileira (ADIMB), Bras´ılia, DF, Brazil. Phone: +55(61) 3326-0759 – E-mail: abcpires@unb.br
i i
“main” — 2018/3/1 — 16:48 — page 66 — #2
i i
66
ALTERNATIVE METHODS FOR DIFFERENTIATION OF BANDED IRON FORMATIONS AND IRON OREINTRODUCTION
Iron ore is currently the highest mineral asset in the Brazilian trade balance, with a growing importance in the national markets. Brazilian reserves, despite corresponding to 16.4% of the world reserves, are highlighted by the high grade of iron with particu-lar reference to the production in the Caraj´as Mineral Province. The Caraj´as District contains known reserves of the order of 18 billion tons with an average grade of 65.4% Fe. The reserves are distributed in a number of deposit groups, wherein the largest one is the Serra Norte deposit with – 6,200Mt 65.8% Fe. This ore can be blended together with low grade ores in diverse/various parts of the world.
Despite its importance, only during the last decade, there were significant advances in the application of geophysical methods (e.g. Dalstra & Flis, 2008; Flis, 2008; Braga, 2009) to iron ore characterization. Large companies are demanding the use of in-novating tools to reduce costs.
Among the main advantages of the geophysical methods, stand out the agility in the acquisition, processing and interpreta-tion of data when compared to direct drilling and the continuous information provide by these methods. However, their main dis-advantage is the ambiguity of results, which often can be solved by the integration of different geophysical methods, or even, by using information of a few drill holes for result validation.
To understand the behavior of iron ore and its host rocks, this work aims to characterize the jaspilites, iron ore and adjacent rocks using the rock physical properties of magnetic susceptibil-ity and gamma-rays spectrometry (K, eTh and eU). The data in-tegration allowed and highlighted the important physical contrast inside the Gr˜ao Par´a Group.
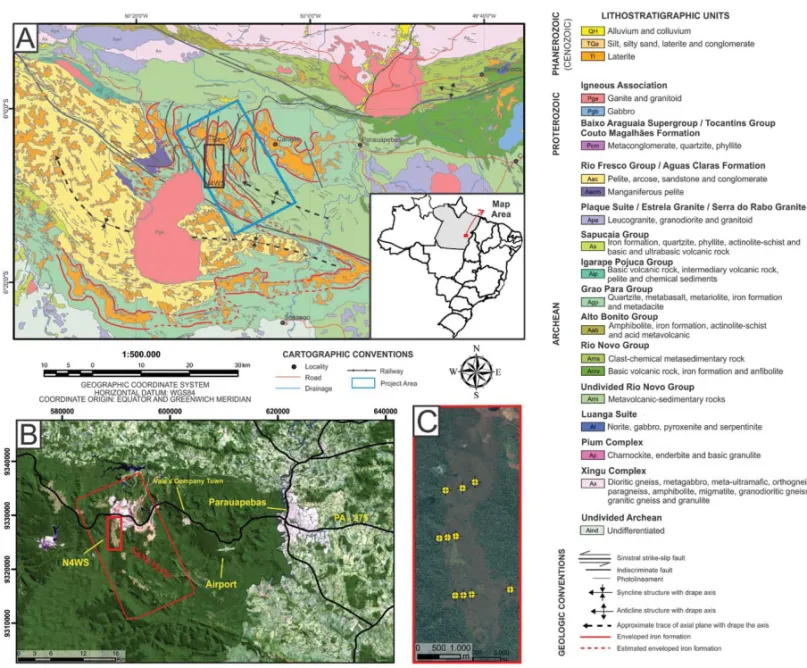
The study area is located in the Serra Norte, Caraj´as Mineral District (Fig. 1), within the limits of the Caraj´as National Forest, in the county/city of Parauapebas, Par´a State. This mining district, exploited by Vale S.A., is represented by the N4 and N5 open pits, and the deposits N1 to N3 and N6 to N9. The thickness of the mineralized package varies between 250 and 300 m, with lengths from 200 m (N3, N6, N7 and N9) up to 10 km (N4) and it can reach up to 600 m deep (down dip). The N4WS prospect is still in pre-exploration phase and it will be the target of the present study.
GEOLOGICAL SETTING
The Caraj´as Mineral Province (CMP) is located in the eastern-southeastern portion of the Amazon Craton and is divided into two Archean tectonic blocks: the southern Rio Maria granite-greenstone terrain (Huhn et al., 1988) and the north area, which
is called Caraj´as (Fig. 1). The Rio Maria Domain is characterized by a juvenile Mesoarchean crust, with sequences of greenstone belts and TTG-type granitoids. In contrast, Caraj´as Domain is pre-dominantly Neoarchean, characterized mainly by metavolcanic-sedimentary sequences and high-K granitoids. Both domains are marked by an Osirian A-type granitic magmatism (Vasquez et al., 2008).
The CMP is defined as a polymetallic province due to its huge richness and mineral diversity. It is the most important mineral province in Brazil and one of the most important in the world. It gathers a singular group of mineral deposits, unique in the planet. It hosts one of the largest iron deposits in the world (26 billion of tonnes) still in production and increasing potential for other com-modities like Mn, Cu, Au, Ni, U, Ag, Pd, Pt, Os, among others. There are many noteworthy deposits: iron deposits: Serra Norte (N1 to N9), South (S1 to S45) and east (SL1 to SL3); Fe-Cu-Au oxide type deposits: Salobo, Pojuca, Alem˜ao, Igarap´e Bahia, Cristalino, Sossego, Alvo 118, Gameleira; Azul manganese de-posits; and the Vermelho nickel deposits (Lobato et al., 2005).
The oldest Archaean units representing Caraj´as domain basement, known as Xingu Complex, consist of granitic, tonalitic and trondhjemitic composition gneisses with intercalated am-phibolites and tonalitic intrusions (Silva et al., 1974) are aged ca. 2859± 2 M.y. (U-Pb zircon; Machado et al., 1991), migma-tized in ca. 2851± 4 M.y. (U-Pb zircon; Machado et al., 1991). Small ortogranulite nuclei called Pium Complex aged ca. 3002 ± 14 M.y. (U-Pb zircon; Pidgeon et al., 2000) may be individu-alized in the southern portion of the Caraj´as domain (Ara´ujo & Maia, 1991). Data available in the literature show that the metamorphism of these rocks has occurred at around 2.8 Ga. (Machado et al., 1991; Roberts et al., 1992; Pimentel & Machado 1994; Pidgeon et al., 2000).
Supracrustal rocks are represented by a succession of volcano-sedimentary rocks, represented by Itacai´unas Super-group (DOCEGEO, 1988), which includes the Igarap´e Salobo, Igarap´e Pojuca, Gr˜ao Par´a, Igarap´e Bahia and Buritirama groups that form the mountains and plateaus of the Caraj´as region. Among these units, stands out the Gr˜ao Par´a Group and, within it, the Caraj´as Formation which consists of jaspilites that host the main iron ore bodies of the province. Besides Caraj´as Formation, Gr˜ao Par´a Group also has a mafic volcanic sequence in the base referred to as Parauapebas Formation, and a basic volcanic se-quence at the top, known as Igarap´e Cigarra Formation (Macam-bira, 2003; Zuchetti, 2007).
Beisiegel et al. (1973) divided the Gr˜ao Par´a Group into two paleovolcanic sequences, upper and lower, separated by Caraj´as
i i
“main” — 2018/3/1 — 16:48 — page 67 — #3
i i
FERREIRA VN, SILVA AM, TOLEDO CLB, J´ACOMO MH, ASSIS LM & PIRES ACB
67
Figure 1 – A – Geological map of the Caraj´as Mineral Province (Modified from Costa, 2007). B – Location of the work/study area with emphasis on the Serra Norte.
Landsat 8 OLI (RGB composition, 764 bands) image. C – N4WS Prospect with the respective drill holes used.
Formation. The lower paleovolcanic sequence named Parauape-bas Formation (Rio Doce Geologia e Minerac¸˜ao, 1984) is repre-sented by hydrothermally altered mafic volcanic rocks with pri-mary features preserved. The upper paleovolcanic sequence, cor-responding to Igarap´e Cigarra Formation (Macambira, 2003; Zuc-chetti, 2007), consists of basic volcanic rocks similar to those of the Lower Paleovolcanic Sequence, and can be distinguished by lenticular intercalations of iron formation.
The Caraj´as Formation comprises banded iron formations of jaspilite oxide type facies, with variations related to alterations. It is almost totally transformed in hematitic ore up to a hundred me-ters deep, cut by mafic dikes and sills. This unit hosts iron ore deposits with an average grade of 66% iron. It occurs concordant to Paraupebas Formation and Igarap´e Cigarra Formation. Caraj´as Formation has 200-250 m average thickness in Serra Norte (near
220 m thickness in the area of the N4E mine) and above 300 m in Serra Sul (Macambira, 2003). It extends laterally, from plateau N1 to plateau N5 in an almost continuous way. It is covered un-conformably by Igarap´e Azul Formation between N1 and N2 and interrupted tectonically between N4 and N5 by strike-slip faults. In general, in N4, the dip is to the west and in N5 the strikes of Caraj´as Formation are displaced by faults and compose a syn-cline, whose axis dips to SW (Macambira, 2003).
Jaspilites present typical interlayered light and dark bands, with centimetric mesobands and milimetric microbands of ferrous oxide interlayered with brilliant to light red layers. They are consti-tuted by microcrystalline SiO2(jasper and chert) with inclusions of microcrystalline hematite. Dark mesobands are made up of iron oxides presenting a variety of textures. The dominant thin phases are microcrystalline hematite and martitized magnetite.
Granula-i i
“main” — 2018/3/1 — 16:48 — page 68 — #4
i i
68
ALTERNATIVE METHODS FOR DIFFERENTIATION OF BANDED IRON FORMATIONS AND IRON ORE tion of these rocks are small, with granoblastic texture, sometimesveinlet and brecciated (Beisiegel et al., 1973; Meirelles, 1986; Lindenmayer et al., 2001; Macambira, 2003; Figueiredo & Silva et al., 2004; Lobato et al., 2005).
Besides compositional banding, Caraj´as jaspilites preserve many depositional and post-depositional structures, such as spherulites of a probable organic origin, plane parallel lamina-tion, scour-and-fill structures and slump structures, overloading marks, flame structures and dissolution breccias, thatindicate ab-sence of regional metamorphism (Meirelles, 1986; Lindenmayer et al., 2001; Macambira, 2003). The jaspillites have suffered a ruptile to ruptile-ductile deformation, like faults, shear zones and a complex pattern of folds outlined by primary bedding, charac-teristic structures at shallow crustal level (Vasquez et al., 2008).
The lithochemical composition of the jaspilites is uniform. The sum of Fe2O3T (total) and SiO2in Caraj´as is systematically above 97% demonstrating high ore purity and absence of terrige-nous material. They are interpreted as made up by chemical pre-cipitation in a wide and tectonically stable shallow submarine plat-form, with possible contribution of fumaroles and/or hydrother-mal vents (Lindenmayer et al., 2001a; Macambira & Schrank, 2002).
The Caraj´as Formation has an inferred age, determined an metavolcanic rocks concordant to the jaspilites bedding, with in-tervals between 2740± 8 and 2757 ± 18 M.y. (Trendall et al., 1998; Krymsky et al., 2002). According to Macambira (2003), the maximum deposition interval of this unit is 29 M.y., with maximum age 2759± 2 M.y. equals to Parauapebas Formation (Machado et al., 1991), and minimal age 2740± 8 M.y. (Trendall et al., 1998) corresponding to a sill that cuts Caraj´as Formation.
Deposited over the Gr˜ao Par´a Group occurs the ´Aguas Claras Formation basin, a sedimentary sequence consisting of conglom-erates, sandstones, dolomites/limestones and gray, red and car-bonaceous siltstones (Meireles et al., 1982; Meireles & Silva, 1988; Ara´ujo & Maia, 1991), with depositional age of circa 2681 ± 5 M.y. (Trendall, 1998). Souza et al. (2001) suggest that the deposition occurred in a passive continental margin environment as a result of regional strain.
Two main geotectonic models have been proposed for the Gr˜ao-Par´a Group: which admit evolution associated to continental rift environments or magmatic arcs (Meirelles & Dardenne, 1991; Teixeira, 1994; Lindenmayer et al., 2005; Lobato et al., 2005; Zucchetti, 2007).
The Parauapebas Formation is represented by basaltic flows, felsic volcanic rocks and mafic intrusions, which occur concor-dantly over the Caraj´as Formation both reflecting the same age
(Beisiegel et al., 1973; Macambira, 2003). Mafic rocks include basaltic flows and intrusive rocks like sills and dikes, of basalts, andesitic basalts, andesites, basaltic andesites, traquiandesites, dacites, quartz- diorites, diorites and gabbros (Ara´ujo et al., 1991; Meirelles & Dardenne, 1991; Macambira, 2003; Lindenmayer et al., 2005; Zucchetti, 2007). They also occur associated to lower basaltic flows with layers of basic to intermediate pyroclastic rocks and volcanoclastics, felsic flows and tuffs described as rhyolites (Meirelles & Dardenne 1991, Zucchetti & Lobato 2004). The Pa-rauapebas Formation is dated 2759± 2 and 2760 ± 11 M.y., obtained through U-Pb zircon (Machado et al., 1991; Trendall et al., 1998).
The Igarap´e Cigarra Formation was initially designed by Macambira et al. (1990), but it was previously named as Se-quˆencia Paleovulcˆanica Superior (Beisiegel et al., 1973), Unidade Superior (Gibbs et al., 1986). It is also considered Parauapebas Formation by some authors (Vasquez et al., 2008). It has variable thickness from 1 to 3 km, and its contact is still a matter of doubt among many authors (Meirelles & Dardenne, 1991; Lindenmayer et al., 2001). It is made up of mafic flows with interlayered tuffs, overlain by clastic and chemical sediments like siltites, phylites and graywacke (Gibbs et al., 1986; Macambira, 2003). Among the most frequent lithotypes are hydrothermally altered basalts with preserved igneous textures (Macambira, 2003).
There is still no consensus on the origin of the iron min-eralization in the Caraj´as Mineral Province, even the classifica-tion of the local iron formaclassifica-tions (Gross, 1980) is not a definite proposal. Beukes et al. (2002) describe in-summary three types of genetic processes for high grade hematite deposits: super-gene, hydrothermal and supergene-hydrothermal alteration. The mentioned processes are applied and supported by diverse au-thors for Caraj´as Mineral Province, as explained in the following paragraphs.
Supergene iron ore deposits are developed in an area where erosive discordance intercepts carbonate enriched iron forma-tions. High grade ore is derived by carbonate and chert leach-ing durleach-ing weatherleach-ing, with grades decreasleach-ing in depth, in the unaltered/unchanged iron formation. Microcrystalline hematite is developed in an iron formation, with detrital conglomeratic ore generated from the base erosion of overlaid ore (Beukes et al., 2002). This mineralization process is suggested by Dardenne & Schobbenhaus (2001) and Tolbert et al. (1971).
Hydrothermal deposits, in turn, are commonly associated with extensional faults that intersect carbon shales that form the base of the host iron formation. The mineralization is attributed to silica and carbonate leaching, and oxidation of all the iron
i i
“main” — 2018/3/1 — 16:48 — page 69 — #5
i i
FERREIRA VN, SILVA AM, TOLEDO CLB, J´ACOMO MH, ASSIS LM & PIRES ACB
69
to hematite. An oxidation halo commonly involves the orebod-ies (Beukes et al., 2002). This action of hydrothermal fluids re-sponsible for the iron mineralization in Caraj´as is supported by Dalstra & Guedes (2004), Rosi`ere et al. (2004, 2005), Lobato et al. (2005a, 2005b). To Rosi`ere et al. (2004, 2005), there is still a structural control in such mineralization, since large bodies de-veloped in zones of greater permeability, i.e., in the hinge region of the Caraj´as synform.
The ore hydrothermal alteration and supergene enrichment model (Beisiegel et al.,1973; Beukes et al., 2002), is characterized by the abundance of friable hematite ore in deep lateritic weath-ering profiles. This type of deposit, which ranges between 100 and 500 meters deep, is composed of hematite, specularite and martite. Tabular bodies of compact hematite occur associated with friable ore and predominate in the lower portion of the iron forma-tion, while smaller lenticular ore bodies are located at the top of the succession.
MATERIALS AND METHODS
Magnetic and radiometric airborne surveys were conducted for exploration purposes at N4WS body. The airborne magnetic and gamma-ray surveys included coverage of high-density magnetic and gamma-spectrometric profiles over the study area. The mag-netic survey was completed using 150 m flight line spacing at 100 m elevation (drape survey) with flight line directions of N25W. The magnetic survey was completed using an optically pumped (cesium vapor) magnetometer with a Scintrex CS-3 sensor at res-olution of 0.001 nT with a detection range of 20,000-95,000 nT.
The airborne gamma-ray spectrometry survey was completed using 250 m flight line spacing at 100 m elevation (drape sur-vey) with flight line orientations of N15E for the production lines and N75W for the control lines. The gamma-ray spectrometry sur-vey was completed using a detecting system which consisted of two downward looking groups of crystals (thallium-doped NaI) of 1024 cubic inches each, and two upward looking crystals of 256 cubic inches each.
The fieldwork in N4WS was conducted in August 2012 and May 2013 in order to document the relevant geological features of the major host rock units, the styles of mineralization in the 11 drill holes, and to sample every two meters for further petrophys-ical analysis. The location of the drill holes is shown in Figures 1 and 3.
A GDD MPP-EM2S+ Multi Parameter Probe was used to measure the magnetic susceptibility and conductivity down the
11 drill holes within the N4WS prospect. The samples repre-sent approximately 3300 m drilled, involving iron ore, proto-ore, jaspilite, and interlayered mafic rocks. Three measurements were taken at each point and an average magnetic susceptibility for each sample was calculated. None of the samples were found to be con-ductive using the multi parameter probe, therefore no conductivity measurements are reported in this study. The instrument consists of a gun-shaped probe connected to a reading unit (Palm Top) which enables the determination of the magnetic susceptibility (× 10–3SI) and relative and absolute conductivity values (mhos/m) in samples. The parameters of the equipment indicate a sampling rate 10 times per second and a presented rate every 0.5 second. Each sample consisted of three sequential measurements with a stabilization period of approximately 15 seconds.
A Radiation Solutions RS-230 BGO Super-Spec gamma-ray spectrometer was used in the laboratory inside a designed lead box to complete K, U, Th and total count assays of the 3300 m drilled, involving the mentioned iron ore, its proto-ore, jaspilite, and interlayered mafics.
The following auxiliary data sources were used: geological maps, data from diverse drilling campaigns, and airborne Laser Imaging Detection and Ranging survey (LIDAR) which was used to make the digital elevation model (DEM).
The software used in the processing, analysis and interpre-tation of the different data, were RSAnalyst, from Georadis (ver-sion 0.141.0), Oasis Montaj (ver(ver-sion 8.2) with the Target exten-sion, from Geosoft Inc. and ArcGIS (version 10.1) from Esri, Inc.
Airborne Geophysics Data Processing
The magnetic data were interpolated in a regular grid with 35 m cells using the appropriate algorithms to maintain data fidelity at the original sample locations using Oasis Montaj software, ver-sion 8.2 from GEOSOFTTM. The algorithm was based on a lin-ear interpolation along the direction of the flight lines, and on an Akima spline perpendicular to the flight lines. The analysis of the variation of the anomalous magnetic field was aided by its linear transformations, mainly the analytic signal amplitude, which is widely used to locate the spatial distribution of magnetic sources in low latitudes. The use of the derivatives, especially the first vertical derivate, helped to determine the spatial positions of the magnetic sources, and was also extremely useful to character-ize linear features. The horizontal derivatives further allowed the mapping of the lateral limits of these same sources. All of these steps were guided by the analysis of the radial power spectrum of the anomalous magnetic field.
i i
“main” — 2018/3/1 — 16:48 — page 70 — #6
i i
70
ALTERNATIVE METHODS FOR DIFFERENTIATION OF BANDED IRON FORMATIONS AND IRON ORE The gamma-spectrometric data (channels TC, K, U, and Th)were interpolated in a regular grid with 60 m cells using the appropriate algorithms to maintain data fidelity at the original sample locations using the Oasis Montaj software, version 8.2 from GEOSOFTTM. The methodology used in the interpretation of the gamma-spectrometric data involved: a) comparison of each micro-levelled grid with digital terrain data, verifying zones where the topography influenced the gamma-spectrometry response; b) analysis of the total count channel and other individual chan-nels to define major gamma-spectrometric domains; c) K, Th, and U channels were displayed as RGB and CMY false-color maps (ternary images), optionally merged with digital terrain data; and d) computation of U/Th, Th/K, and U/K ratios and analysis of their correlation with the gamma-spectrometric domains.
Physical Properties of the N4WS Deposit Host Rocks, Proto-ore and Iron Ore
As mentioned before, the data were collected to characterize the magnetic susceptibility and radiometric physical properties of the N4WS rocks. Data were obtained from the measurement of gamma radiation, including the total count channels and radioelements K, eU and eTh, and magnetic susceptibility in drill cores, at 2 meters regular spacing, of a total of 1700 samples of different lithotypes. The magnetic susceptibility in rocks depends on the amount, grain size and the mode of distribution of magnetic minerals. Its unit of measurement is dimensionless, and in this study it is in-dicated as SI. The magnetic susceptibility of rocks or minerals typically range from 10–5to 3 SI (Heider et al. 1996). Only a few minerals have high enough magnetic susceptibility to produce detectable anomalies in prospecting work. They are: magnetite, pyrrhotite (monoclinic), ilmenite, franklinite and maghemite. Due to their abundance, the first three are the main contributors to the magnetization of rocks (Gouvea & Silva, 1995). Clark (1997) presents a summary of observation intervals and magnetic sus-ceptibility ranges common to several types of rocks.
To collect the gamma-rays from radioelements K, eTh and eU, a 1024 channels portable gamma spectrometer, model RS-230, manufactured by Radiation Solutions Inc., was used. It consists of a spectrometer and a cannon with a bismuth germanate used for the measurements. The equipment allows measurements of gamma radiation not only K % and eU and eTh ppm but also in scintillations per minute (cpm). Samples were submitted to 5 minutes exposure to the equipment. According to IAEA (2003), the sampling time needed for a measurement depends on the ra-dioactivity of the source and the required accuracy. For Lovborg
& Mose (1987), 2 minutes sampling time for highly radioactive rocks and 6 minutes for low radioactivity rocks are considered acceptable according to tests using a detector with 350 cm3of NaI (Tl) with 10% precision. As the rocks of this study have a low radiometric response every 5 minute measurements were made. To control and eliminate external sources of radiation, an insulat-ing box built mostly by non-radiogenic lead, was developed at the Institute of Geosciences, Universidade de Bras´ılia.
STUDY AREA CHARACTERIZATION Geological Units
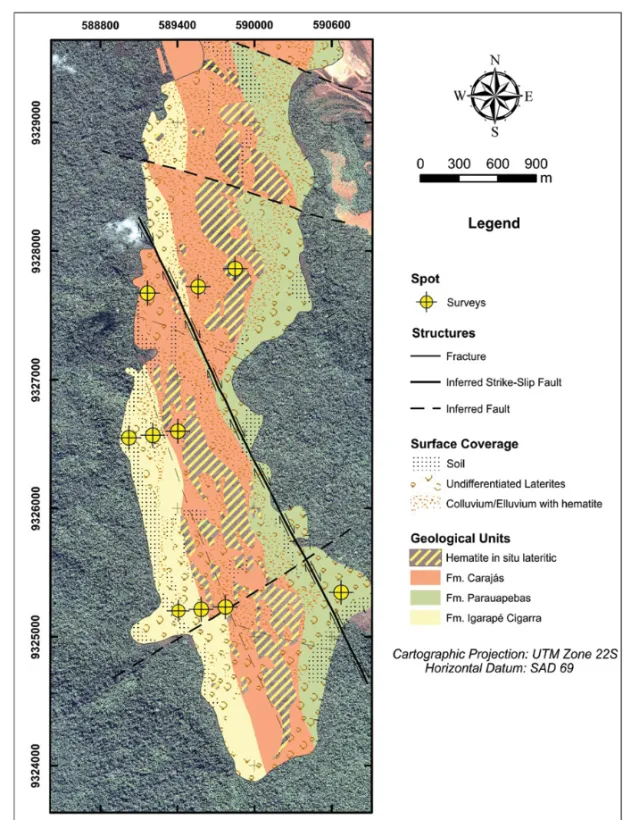
A geological map (Fig. 2), provided by Vale S.A., was used to assist in data interpretation. This map was focused in the high plateaus where the iron formation occurs. The data are a result of the final research report from Resende and Barbosa (1972), having the updating work of Macambira (2003) with focus in the iron formations and respective adjacent rocks.
The lithotypes mapped in the surveys as well as field work are arranged in a summary below, with abbreviations and ade-quate descriptions according to Assis (2013) and the Vale S.A. database. This designation was used in the present work to avoid the repetition of the lithological varieties throughout the text. Figure 3 illustrates the respective lithotypes.
• Ore Canga (CM): lateritic cover that formsin situ on the ore outcrops. The thickness can reach more than 20 m. It has high Fe content and relatively low contaminants, en-abling its potential use as ore. It is an indicator of the oc-currence of iron ore.
• Chemical Canga (CQ): Also known as sterile lateritic cover is derived from the regolith of mafic rocks or asso-ciated with mature and cemented colluvial deposits. • Jaspilite (JP): banded iron formation, may have
centimet-ric to millimetcentimet-ric laminations often with anastomosing pat-tern. Laminations often appear with alternating mafic and jasper/chert. Breccias also occur with fragments of jasper enclosed in magnetite-rich matrix. Venulations commonly occur with quartz and/or carbonate. Constant variation in size between crystals of magnetite/martite. Jaspilite rep-resents the proto-ore in the region, 20 to 40% Fe grade values.
• Friable Hematite (HF): Iron ore with an average grade of 66% Fe. Highly friable and porous structure of jaspilite, partially to totally obliterated due to silica leaching. Color
i i
“main” — 2018/3/1 — 16:48 — page 71 — #7
i i
FERREIRA VN, SILVA AM, TOLEDO CLB, J´ACOMO MH, ASSIS LM & PIRES ACB
71
Figure 2 – Geological map of the N4WS body, focusing on lithotypes described in the plateaus of the Serra Norte. Background Image: orbital sensor Ikonos, 2007.
varies between shades of gray, sometimes yellowish asso-ciated with aluminum contamination.
• Mafic (M): basalts, gabbros and diabases little to not af-fected by weathering. Tuffs, pyroclastics are also described but they are rarer. They are chloritized systematically, with rich and restricted levels of talc. Mafic rocks are green to dark green, often with typical volcanic structures such as amygdale filled by quartz, carbonates and chlorites and eventually by sulfides. They occur as both flow and intru-sion into the jaspilites under the form of sill.
• Semi-weathered Mafic (MS): saprolite of mafic rocks, with relicts of the original texture of the protolith or even total loss of the original structure.
Magnetometry
The anomalous magnetic field observation is enhanced by its linear transformations, mainly: the analytic signal amplitude, in-dicating the position of the magnetic sources; total horizontal gra-dient amplitude and first vertical derivative. The use of derivatives was useful in the delineation of local structures, mainly vertical.
i i
“main” — 2018/3/1 — 16:48 — page 72 — #8
i i
72
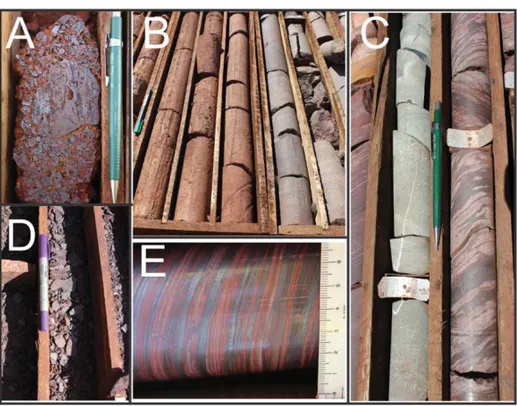
ALTERNATIVE METHODS FOR DIFFERENTIATION OF BANDED IRON FORMATIONS AND IRON OREFigure 3 – Main lithotypes of the project area. A) Ore Canga. B) Chemical Canga varying to
semi-weathered Mafic. C) On the left Mafic rock and on the right jaspilite. D) Detail of iron ore, named Friable Hematite. E) Detail of jaspilite with jasper and iron oxides banding.
It is important to understand the relative spatial positions of the sources.
The analytical signal amplitude map (Fig. 4) shows the mag-netic features and interesting structures from a prospective view. It is noted that the mineralized bodies, validated with the geolog-ical map generated from drill holes, with a high Fe content have a low gradient and are often not mapped. The main reason is the genesis of the ore, which is rich in hematite and martite (magnetite alteration) but poor in magnetite. The loss of magnetism due to the oxidation and enrichment of iron ore (Macambira, 2003) shows that the observed features are indicative of proto-ore.
Gamma-ray spectrometry
For gamma-spectrometric data, images were generated from the corrected total count data (µR/h) and from the channels K (%), eU (ppm) and eTh (ppm). Among the three channels, we can high-light the channel of thorium as very relevant. Thorium is charac-terized by being the most inert element of the three measured ones. It has a higher concentration than the others, which may indicate regions of higher chemical weathering, typical on the study area, with thick regoliths.
Normally, in prospecting for iron ore, the gamma spectrom-etry data are more often used for mapping geological units as-sociated with iron formations than for the determination of their occurrence (Flis, 2008). This is due to the low natural
concentra-tion of radioelements in iron formaconcentra-tions. In Brazil, the low values of radioelements tend to stand out as well as the association with the lateritic plateaus.
The composition in false RGB color was also quite well an-alyzed, and defined the gamma spectrometry signature of the re-gional geology of the study area. The signature of regolith asso-ciated with this unit shows plateaus enriched in eTh. However, the lateritic coverage associated with mafic rocks, associated with the Paraupebas and Igarap´e Cigarra formations, is enriched eTh and eU. Clastic sedimentary rocks such as sandstones and conglom-erates with arcosean matrix covering the Gr˜ao Par´a group, are mapped with high K and were correlated with the units of Gorotire and ´Aguas Claras Formations. It is also noteworthy a NE-SW trend with high values of K coinciding with the direction of the hinge zone of the anticline that separates N4 and N5. This is pos-sibly correlated with the hydrothermal influence described in the literature (Fig. 5).
The outcropping iron formation associated with the Caraj´as Formation was individualized by its signature of low radioelement levels of K, eTh and eU that show a high correlation with previ-ously mapped outcrops (Fig. 5).
However, a more detailed characterization of the regional geology was unsuccessful, because the signal to noise ratio was relatively low, which did not allow the construction of a lithogeo-physical map of Serra Norte.
i i
“main” — 2018/3/1 — 16:48 — page 73 — #9
i i
FERREIRA VN, SILVA AM, TOLEDO CLB, J´ACOMO MH, ASSIS LM & PIRES ACB
73
Figure 4 – Analytic Signal Amplitude map with an emphasis on digital elevation model and lineaments traced through
derived anomalous magnetic field. Observe that high responses are not always coincident with the Fe mineralized bodies.
For the N4WS body a lithogeophysical map was prepared through non-supervised classification in order to check whether an individualization of the local lithotypes is possible (Fig. 6). The classification was performed for ten classes, a number con-sidered suitable to generate the map, since a lower number does not match the observed variation and a larger number would bring unnecessary complexity to the observation of natural features in the ore body.
Physical Properties of Iron Ore and Host Rocks
The characterization of iron formations and iron ore using geo-physical methods to define their geo-physical properties is still very limited in the world, especially in Brazil (e.g. Zacchi, 2010). Some classical works determine ranges of concentration of radioele-ments. Killeen (1979) classifies chemical sedimentary rocks, in-directly applicable to banded iron formations, with intervals of K, eU and eTh, respectively, between 0.02-8.4%, 0.03-26.7 ppm
and 0.03-132.0 ppm. Boyle (1982) presents average contents of eU and eTh for banded iron formations (2.0 ppm and 3.0 ppm re-spectively). A compilation of data indicates, in summary, ranges of magnetic susceptibility for different types of iron ore and their associated iron formations, studied in Middleback Ranges, Aus-tralia and the Serra do Sapo, Brazil, respectively (Bubner et al., 2003; Zacchi, 2010) (Table 1).
A total of 1791 samples were measured, which generated a database with measurements of magnetic susceptibility and gamma radiation in the K, U and Th channels and total count radioelements. The samples include both iron ore and the sur-rounding rocks described above. Sampling was performed in 11 holes spaced in 3 sections in the N4WS body (Fig. 7).
The data are presented as histograms and box plots for a bet-ter visualization of statistical data in order to facilitate their discus-sion. It was possible to make a classification according to litho-type (Fig. 8).
i i
“main” — 2018/3/1 — 16:48 — page 74 — #10
i i
74
ALTERNATIVE METHODS FOR DIFFERENTIATION OF BANDED IRON FORMATIONS AND IRON OREFigure 5 – RGB Colored composition of radioelements K, eTh and eU highlighted over the DEM. A) Delimitation of main
geological units of the area and identification of a possible fluid percolation zone (red traced line); B) Correlation between the outcropping iron formation (white polygons) and K, eTh and eU low grade.
Table 1 – Physical properties of iron formation in Middleback Ranges, Australia and
Serra do Sapo, Brazil (Bubner et al., 2003; Zacchi, 2010).
Lithology Range× 10–3SI Occurrence
Iron Formation with Magnetite 1634 Middleback Ranges
Itabirite 0.3-10.40 Serra do Sapo
Jaspilite 17.6-2111 Middleback Ranges
Hematitic Jaspilite 6.3-12.6 Middleback Ranges
Iron ore 0.2-42.10 Serra do Sapo
Iron ore (rich magnetite) 4.4-2111 Iron Duke Hematitic iron ore I 30.2-52.8 Middleback Ranges Hematitic iron ore II 1.0-10.0 Middleback Ranges Hematitic Quartzite 1.63-1684 Middleback Ranges
The magnetic susceptibility values show a wide variation in the range examined, from samples with zero values up to the max-imum of 935.33× 10⁻³SI, with an average of 49.02× 10⁻³SI. The jaspilite and friable hematite show high values of suscepti-bility when compared to the surrounding rocks, but proto-ore has much higher values than the ore itself, with averages of 234.37 × 10⁻³SI and 26.17× 10⁻³SI, respectively. Mafic rocks, along with their saprolitizated product have low magnetic susceptibility, especially semi-weathered mafic rocks with average value of 0.39
× 10–3SI. The mafic rock has an average of 3.11× 10⁻³SI. Can-gas derived from both jaspilitos, ore canga, and the mafic rocks, chemical canga, also have low values of magnetic susceptibility, with averages of 6.13× 10⁻³SI and 0.52× 10⁻³SI, respectively. Differentiation through the average values of the magnetic susceptibility is efficient. However, due to local geological fea-tures, such as level of strong weathering caused by the tropical climate and the typical local characteristics, there is a large num-ber variation within the lithotypes. For jaspilites, this variance is
i i
“main” — 2018/3/1 — 16:48 — page 75 — #11
i i
FERREIRA VN, SILVA AM, TOLEDO CLB, J´ACOMO MH, ASSIS LM & PIRES ACB
75
Figure 6 – A) RGB ternary composition (K/eU/eTh) with geological contacts in evidence; B) N4WS Lithogeophysical Map.
Note the regions delineated coincident with indicative iron ore outcrops.
Figure 7 – Location of the drill holes in N4WS body. The highlighted sections were used to help data interpretation.
between 0.51-904.33× 10⁻³SI, where lower values are relative to the partially modified portions, connected to the oxidation of magnetite, and also associated to the interaction with mafic bod-ies (sills) in the package. The same kind of criteria can be applied to the canga ore and mineralized portion. The first has variation between 0.31-25.17 × 10⁻³ SI and the friable hematite shows values between 0.5-111.33× 10⁻³SI. The canga ore is mostly
poor in magnetite, consisting essentially of iron oxides and hy-droxides. The ore is derived from the oxidation of magnetite to hematite. Mafic rocks, semi-weathered mafic rocks and chemi-cal canga have the following range of values: 0-21.27× 10⁻³SI, 0-1.69× 10⁻³SI and 0.14-1,24× 10⁻³SI, respectively. Anoma-lous magnetic susceptibility values for mafic rocks are shown in Figure 9. They are related to the proximity of the jaspilites, which
i i
“main” — 2018/3/1 — 16:48 — page 76 — #12
i i
76
ALTERNATIVE METHODS FOR DIFFERENTIATION OF BANDED IRON FORMATIONS AND IRON OREFigure 8 – Box plot showing the values of magnetic susceptibility and gamma spectrometry (total count, potassium, uranium and thorium) samples
of ore and surrounding rocks.
suggests an interaction between them, as shown at some levels of jaspilites. They are cut by sills in which these fragments are pre-sented with chert and jasper in the matrix and also by alternation of mafic and jasper centimetric bands.
The data obtained using the gamma-ray spectrometer for the lithotypes studied are summarized in Table 2, with the mean and range described. The values of the three radioelements, potas-sium, uranium and thorium, are arranged in cpm (counts per
minute) as opposed to the commonly used concentrations (% and ppm). The standard scale, derived from the processing of raw data is exported in concentrations, but the largest range of values in cpm was more useful for the evaluation and differentiation of the tested lithotypes.
In general, the measured values are very similar showing no remarkable difference between the ore and its surrounding rocks. High values of K for the mafic rocks can be highlighted, with
i i
“main” — 2018/3/1 — 16:48 — page 77 — #13
i i
FERREIRA VN, SILVA AM, TOLEDO CLB, J´ACOMO MH, ASSIS LM & PIRES ACB
77
Figure 9 – Normalized K/eU/eTh ternary diagram. Data from all samples from the N4WS body.
Table 2 – Summary of mean and variation of magnetic susceptibility values, total count, potassium, uranium and thorium
for the described lithotypes.
Magnetic Total
K U Th
Lithology Susceptibility Count
(cpm) (cpm) (cpm) (SI× 10–3) (cpm) Ore Mean 6.15 160.11 5.11 9.41 14.47 Canga (CM) Range 0.31-25.17 118.50-218.60 0.4-13.30 4.90-14.30 9.00-20.3 Chemical Mean 0.52 191.1 6.47 10.29 16.33 Canga (CQ) Range 0.14-1.24 149.60-248.30 0.90-14.10 6.30-14.20 11.30-20.70 Friable Mean 26.17 149.56 4.45 9.10 14.02 Hematite (HF) Range 0.50-111.33 102.20-206.50 0.30-11.10 4.30-13.80 8.70-19.80 Jaspilite Mean 234.37 158.34 4.91 9.26 13.94 (JP) Range 0.51-904.33 109.30-219.00 0.30-13.10 3.20-14.90 7.80-19.70
Mafic Rock Mean 3.11 191.5 11.27 9.88 14.85
(M) Range 0-21.27 117.00-271.60 0.60-29.20 3.80-15.90 9,00-21.60
Semi-weathered Mean 0.39 179.11 5.5 9.93 15.17
Mafic (MS) Range 0-1.69 115.00-250.20 0.20-14.40 3.90-17.10 9.30-21.80
values ranging between 0.60-29.20 cpm and 11.27 cpm average, much higher than other lithologies. Ore and chemical cangas have higher values for thorium as compared to other rocks because of their natural enrichment derived from local weathering processes. Thorium is the focus in this process because it is the least geo-chemically mobile radioelement. Positive anomalies within these variables, when associated, can be interpreted as possible indi-cators of hydrothermal processes linked to various types of
min-eralization (e.g. Pires, 1995; Airo, 2002). A ternary diagram with values of normalized potassium, uranium and thorium radioele-ments was used for comparing the sampled data in the N4WS body (Fig. 9). The sampled lithotypes have high dispersion, thus hindering a classification derived from the radioelements except for the mafic rocks, with a trend indicating enrichment in potas-sium. There is no differentiation between jaspilite and iron ore, indicating possibly that the mineralization is not directly related
i i
“main” — 2018/3/1 — 16:48 — page 78 — #14
i i
78
ALTERNATIVE METHODS FOR DIFFERENTIATION OF BANDED IRON FORMATIONS AND IRON ORE to hydrothermal events or that the chosen parameters are notap-plicable to the mineralization process.
The values observed in the total count channel obtained from the measurement of gamma radiation, show a better differen-tiation between the sampled lithotypes. It is possible to sepa-rate two general classes: jaspilites, together with the ore and the canga, and mafic rocks, with their semi-weathered portion deriv-ing into chemical canga. The second group has higher mean val-ues compared to the first one, while mafic rocks, semi-weathered mafic and chemical cangas have, respectively, mean cpm values of 191.50, 179.11 and 191.10 cpm. The jaspilites together with friable hematite and ore canga, have average values of 158.34, 149.56 and 160.11 cpm, respectively. Despite the difference in values between the friable hematite and jaspilite, it is not possible to distinguish them because their ranges are virtually identical, the same being applicable to ore canga (Table 2 and Fig. 8). This be-havior is compatible with the dispersion observed for potassium, uranium and thorium.
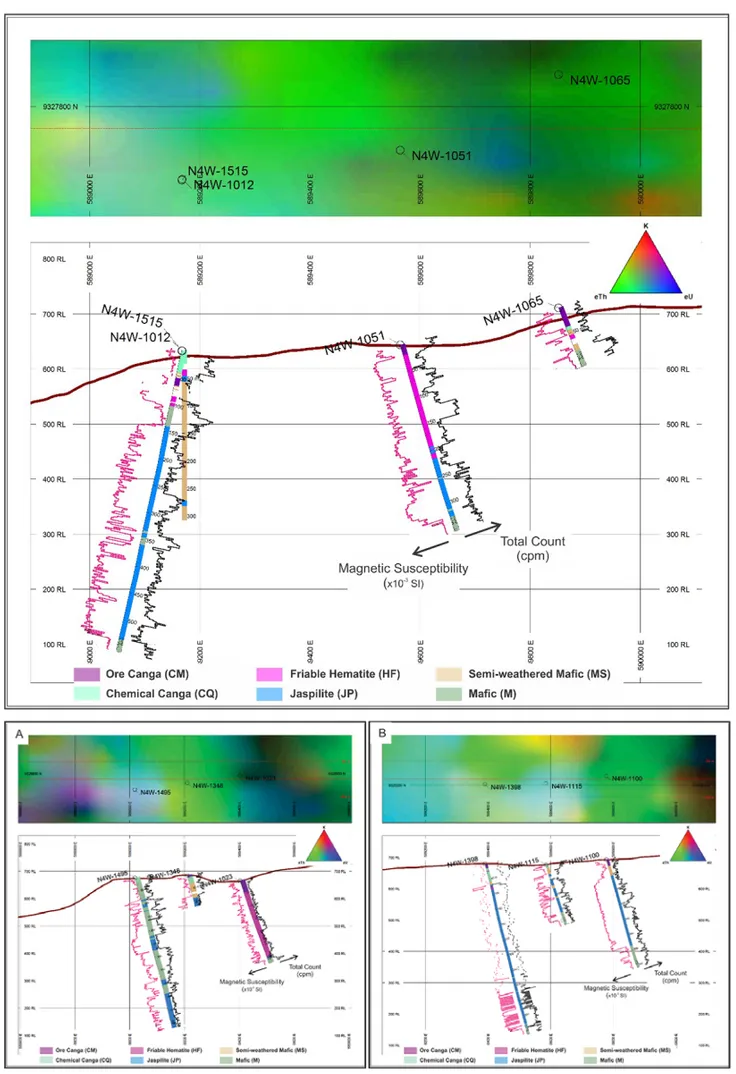
The high amount of data obtained by drilling makes a sin-gle view of each drill hole inadequate. For this reason, the drill holes are arranged in three parallel sections, called sections I, II and III. Figure 10 (A and B) shows the profiles of each drill hole with the profile of the magnetic susceptibility (pink) in logarithmic scale, and total count in linear scale. These parameters were found to be the most useful for the differentiation between the mapped lithologies. Just above the profiles, the image of the airborne sur-vey RGB ternary composition is inserted for comparison between the position of the survey and its respective gamma-spectrometric response in surface.
In order to enhance the interpretation, correlation charts com-paring all the physical parameters analyzed were generated. They allow better visualization and they are also useful in the classifi-cation of lithotypes according to their present features. Figure 11 illustrates an example of the hole F1495/N4WS with the relation-ship between the radiometric channels and their interaction with the magnetic susceptibility. It is noteworthy the use of normalized data for K, U and Th channels, which depicts more accurately the interaction between these radioelements.
From this graph, it is possible to identify the difference in behavior of radioelements between mafic rocks and jaspilite (Fig. 11A, B and C). Figure 11D illustrates how the total count and the magnetic susceptibility are useful in the individualization of the sampled lithologies.
The data sections I, II and III were also analyzed through corre-lation graphics. The sections are presented together in Figure 12. In the potassium and uranium graphic (Fig. 12A) the data from
section I show great dispersion, without any distinction between lithologies, even if some data are far from this “point cloud” which have little representation as a total. Sections II and III illustrate a small negative trend, indicating a tendency of mafic rocks to be richer in potassium and poor in uranium (most notably in sec-tion II). The other lithotypes cannot be distinguished directly, all showing low uranium response.
Figure 12B, which presents the correlation between potas-sium and thorium, is similar to the previous behavior chart, be-ing observable a greater slope in the relationship between the in-crease in potassium and a dein-crease in thorium. There is no dif-ferentiation between the type of iron ore, jaspilites and cangas. Mafic rocks again stand out in their greater potassium response, but still a considerable amount of sample behaves in a similar way as other lithotypes.
The graphic of uranium and thorium correlation (Fig. 12C) depicts well the behavior of the mafic rocks of the study area. They are richer in potassium and impoverished in thorium and uranium when compared to adjacent lithologies. This differenti-ation is more evident in the samples from section II. Jaspilites, friable hematite, ore and chemical cangas, have similar values of normalized uranium and thorium.
When total count and magnetic susceptibility are compared (Fig. 12D), there is a clear differentiation between the main litho-types analyzed. Both sections show that, despite showing simi-lar values for total count, jaspilites and friable hematite are dis-tinguishable by the parameter of magnetic susceptibility. While the values of jaspilite are predominantly above 100 × 10–3 SI (with some exceptions), friable hematite is “confined” below this value. This behavior is clearly observed in sections I and II which have a higher amount of ore samples. The mafic rocks, and their lithologies, have similar behavior for magnetic susceptibility, al-ways restricted to the range of 10× 10–3 SI. Mafic rocks with values above this, can be considered as a product of interaction with nearby jaspilites, the most frequently observed situation in Section II. Such rocks, as expected, stand out by higher values of total count.
From the analysis and visualization of the results of the sec-tions, an individual analysis of the drill holes becomes interesting, in order to identify possible anomalies. The F1495/N4WS drilling sampled almost the entire local stratigraphy and its rocks are the most well preserved, allowing a clearer analysis of the physical properties of these rocks. The log of this drill hole (Fig. 13) shows the three radiometric channels and the total count, their ratios and the “F factor” (‘KU)/Th’). It shows possible areas of potassium enrichment derived from hydrothermalism, suggesting local en-richments, as compared to the magnetic susceptibility.
i i
“main” — 2018/3/1 — 16:48 — page 79 — #15
i i
FERREIRA VN, SILVA AM, TOLEDO CLB, J´ACOMO MH, ASSIS LM & PIRES ACB
79
Figure 10 – Section I (top) illustrating their logs with profiles of magnetic susceptibility and total count of radioelements. RGB ternary composition (K, eU, eTh).
i i
“main” — 2018/3/1 — 16:48 — page 80 — #16
i i
80
ALTERNATIVE METHODS FOR DIFFERENTIATION OF BANDED IRON FORMATIONS AND IRON OREFigure 11 – Graphic of correlation F1495/N4WS hole. A) Correlation between potassium and uranium. B) Correlation between potassium and thorium.
C) Correlation between uranium and thorium. D) Correlation between total count and magnetic susceptibility (logarithmic values). The values of the radioelements are normalized.
In the analysis of the log it is possible to identify variations in physical properties, more precisely the magnetic susceptibility, the total count (TC) and the potassium channel between jaspilites and the mafic rock. Such differentiation within the physical prop-erties allows the automatic classification of the lithotypes. The geophysical data were subjected to a non-supervised classifi-cation, in which the K-means algorithm was used, which pro-vides an image based on analyzes and comparisons between nu-merical values of the data itself, without any supervision or pre-classification rankings. By presenting different magnitudes (cpm, SI), the data were normalized only by their means and standard deviations. The high variance of the lithotypes in the drill holes prevented a standard rating for the entire N4WS body. Thus, a dif-ferent determination of the number of distinct classes was used for each drill hole depending on its geological characteristics. At first, the classification appeared to be satisfactory to determine the lithotypes. Figure 14 illustrates the result of the classifica-tion compared with geological sampled data. Only the magnetic susceptibility, total counting and potassium values were used be-cause these had the most satisfactory results.
The classification results were ambiguous. In the F1495/ N4WS log, the classification of the data separated well the jaspilites from mafic rocks. They also indicate a variation in
the jaspilite itself connected to the magnetic susceptibility vari-ation, indicating that despite the macroscopically homogeneous jaspilite, there is heterogeneity within the rock itself. Results in the semi-weathered mafic (MS) do not differ from the chemical canga (CQ) illustrating that possibly weathering processes do not affect directly the analyzed physical properties. The classification of the F1023/N4WS log was not so satisfactory for differentiat-ing the sampled lithologies. Ore canga (CM), iron ore and fri-able hematite (HF) have the same answers to the classification of two classes being applied to the two lithotypes. Failure to dif-ferentiate between iron ore and canga indicates that weathering processes do not significantly alter the radioelements concentra-tion. The same is applicable for magnetic susceptibility, low in both lithotypes, essential for non-magnetic mineral compounds like hematite (ore constituent) and goethite (canga constituent). The mafic rock (M) of the base of the hole could not be classified, perhaps because of its low representation in the survey.
In summary, the same results are obtained for the other drill holes. The non-supervised classification indicates a partitioning within the jaspilite itself and the generation of the same class for the lithotypes defined as chemical canga (CQ) and semi-weathered mafic (MS); also to define the ore canga (CM) and fri-able hematite (HF).
i i
“main” — 2018/3/1 — 16:48 — page 81 — #17
i i
FERREIRA VN, SILVA AM, TOLEDO CLB, J´ACOMO MH, ASSIS LM & PIRES ACB
81
Figure 12 – The correlation charts of sections I, II and III in N4WS body. A) Correlation between potassium and uranium. B) Correlation between
potassium and thorium. C) Correlation between uranium and thorium. D) Correlation between total count and magnetic susceptibility (logarithmic values). The values of the radioelements are normalized.
i i
“main” — 2018/3/1 — 16:48 — page 82 — #18
i i
82
ALTERNATIVE METHODS FOR DIFFERENTIATION OF BANDED IRON FORMATIONS AND IRON OREFigure 13 – F1495/N4WS drill hole log with the response profiles of the radioelements, their ratios and the magnetic susceptibility.
Integration of rock physical properties, Geology and Airborne Geophysical Data
The analysis of data sampled at different scales through individual drill hole logs and from the correlation charts of the entire pop-ulation of measurements allowed a higher understanding of the behavior of the physical properties of the N4WS body. It allowed a greater integration between the used tools.
First of all, it is necessary to have the knowledge of the geo-logical sections to have an idea of the spatial variation of the physical properties measured. Vale S.A. provided the
lithologi-cal information from the other drill holes presented in sections I, II and III.
Using the Target extension built for, Geosoft Oasis Montaj software, which allows the creation of interactive surfaces, named geostring’s, with information derived from drilling. Platform inter-pretations were generated in profiles of the respective sections, taking into account the geological descriptions conducted in sampled drill holes, dip information on the layers of jaspilites and major structural features provided by Vale S.A. (Figs. 15 and 16). The sections are limited laterally by a 100 m buffer. Above the
i i
“main” — 2018/3/1 — 16:48 — page 83 — #19
i i
FERREIRA VN, SILVA AM, TOLEDO CLB, J´ACOMO MH, ASSIS LM & PIRES ACB
83
Figure 14 – Non-supervised classification of geophysical data from F1495/N4WS hole.
sections, it is presented the RGB ternary composition image from the airborne gamma-ray spectrometric survey with the position of the drill holes and the structural features mapped on surface.
Section I is cut by two normal faults, with the area of high-est mineralization concentrated between them. There is clearly an indication that the “front” of weathering, which advances up to 200 m deep, follows the bedding, advancing in the east – west direction. Section II also features two faults that cut the profile, and similarly the mineralized zone is imposed by both, but such structures have no relation with those presented in Section I. In the upper portion, shear zone was identified and interpreted with the help of the geological descriptions of the F1495/N4WS and F1348/N4WS holes as a thrust. Again, it is important to note the observation of weathered rocks, this time at more than 250 m deep. The high structuring of the area indicates that the mapped structures act as surface conduits for percolation fluid, which would intensify the process of rock alteration. Section III shows
less influence of the structures observed at the local level. The region of highest mineralization is concentrated to the right of normal fault mapped on surface and also cuts to Section II. There is a fault mapped to the left according to the F1115/N4WS hole description. Mineralization and weathering are concordant to lo-cal bedding, naturally, due to easier percolation for fluids and rock leaching.
Interpretations of the physical properties were also generated alongside the geological profiles, not considering relevant the local geology. Thus, only the sampled drill holes were consid-ered for fitting the profiles (Figs. 17 and 18). The magnetic sus-ceptibility and total count profiles are presented along the drill hole profiles in order to facilitate visualization of the different re-sponses within their lithotypes.
The k-means classification was helpful in regard to differen-tiation of jaspilites and weathering processes. Section I follows this proposal, defining the same zone as the chemical canga (CQ)
i i
“main” — 2018/3/1 — 16:48 — page 84 — #20
i i
84
ALTERNATIVE METHODS FOR DIFFERENTIATION OF BANDED IRON FORMATIONS AND IRON OREi i
“main” — 2018/3/1 — 16:48 — page 85 — #21
i i
FERREIRA VN, SILVA AM, TOLEDO CLB, J´ACOMO MH, ASSIS LM & PIRES ACB
85
i i
“main” — 2018/3/1 — 16:48 — page 86 — #22
i i
86
ALTERNATIVE METHODS FOR DIFFERENTIATION OF BANDED IRON FORMATIONS AND IRON OREi i
“main” — 2018/3/1 — 16:48 — page 87 — #23
i i
FERREIRA VN, SILVA AM, TOLEDO CLB, J´ACOMO MH, ASSIS LM & PIRES ACB
87
i i
“main” — 2018/3/1 — 16:48 — page 88 — #24
i i
88
ALTERNATIVE METHODS FOR DIFFERENTIATION OF BANDED IRON FORMATIONS AND IRON ORE and semi-weathered mafic (MS). The jaspilites are differentiatedinto two types: those with low magnetic susceptibility, in the up-per portion of their respective lithotype, limited to 250× 10–3SI. However, in the second type, those with high magnetic suscepti-bility are apparently associated with the base of the section, with mean values higher than 250× 10–3SI and reaching up to 1000 × 10–3SI. Both have radiometric behavior as evidenced by the total count profiles. There is still an area of interface to the mafic rocks located within the jaspilites package. Described as sills, they present higher magnetic susceptibility values and a slight de-crease in the radioelement concentrations compared to the same rock located farther from the contact. A similar behavior, but re-verse, is observed in jaspilites adjacent to the contact. This shows the interaction between rocks during basalt intrusion. As high-lighted before, the variation of physical properties between the ore canga (CM) and friable hematite (HF) is not visible in the au-tomatic classification. However, analyzing the profiles within the sections, it is noted that the radioelement concentration is slightly superior in ore canga. In the ore package in the central portion of the F1051/N4WS drill hole (Fig. 17) there is a positive anomaly in the radioelement concentration, different from the behavior mea-sured. But this anomaly appears in the geological description of the hole, raising doubts concerning its origin.
Section II can be divided by the normal fault mapped at the surface (Fig. 18). In the left portion of the fault we observed once again the individualization of chemical canga (CQ) and semi-weathered mafic (MS) lithotypes. It was not possible to identify the intervals that correspond to the mineralized zones. The jaspilite again shows a dual behavior, with intervals of high and low mag-netic susceptibility. However, unlike the previous section, low susceptibility jaspilites are located at the base of the section. The mafic rocks described as sills show the interaction haloin contact with jaspilite package. It suggests a contemporary interaction at the moment of intrusion. To the right of the normal fault, there is only a single drill hole that was sampled. It is composed basically of iron ore, with a small portion of jaspilite followed by mafic rock at the base. The profile analysis identifies two anomalous zones with high response in the total count channel of gamma spec-trometry. Both are close and have, in part, similar depths to the previously mapped area in Section I. The description, however, does not indicate any particular feature corresponding to these anomalies.
Section III (Fig. 18), like its predecessors, shows similar behavior of the physical properties measured for the respective mapped lithologies. The low magnetic susceptibility jaspilites have a larger range values. Especially in the F1398/N4WS log and
in the F1115/N4WS log, the transition to the high susceptibility jaspilite is marked by a shear zone coincident with the presence of mafic rocks, with a less intense halo as compared to those de-scribed previously. On the bottom of this section, the jaspilite and basalt interface is practically absent. In the geological description it is defined as abrupt. It is noteworthy that an anomalous zone in the total count values was not identified in the sampled jaspilites. Its depth coincides with the anomalies found in the previous sec-tions. However, unlike Section III, the anomalous zones are lo-cated within the iron ore.
The anomalous zones with higher radioelement concentra-tions are relevant because they are located to the right of the normal fault that cuts Sections I and II, and also because there is no corresponding feature in the local geological descriptions. Besides, it is present in both jaspilites and friable hematite. The fact that they are present not only in proto-ore but also in the iron ore itself is indicative that the anomaly is posterior to the miner-alization process, making possible a correlation with the grade of the ore or even the identification of impurities.
Once identified and interpreted, the main characteristics of the iron ore, jaspilites and surrounding rocks as related to their mag-netic susceptibility and K, U and Th radioelement concentration, it is possible to make an integration between the data collected in situ and the other products used in this work. As discussed, there is a clear differentiation between jaspilites and mafic rocks and their alteration products, especially regarding values of ra-dioelement concentration in the total count channel. The mafic rocks, semi-weathered mafics and chemical cangas present val-ues of 191.50 cpm, 179.11 cpm and 191.10 cpm, and jaspilites along with friable hematite and ore canga, have average values of 158.34 cpm, 149.56 cpm and 160.11 cpm, respectively. Thus, the use of airborne gamma spectrometry data becomes relevant for a qualitative comparison between what is measured in surface and their corresponding response to the mapped lithologies.
For validation of this comparison it is interesting to use the geological information derived from other drilling data. The geo-logical sections previously generated have been replaced for a more robust modeling, using the Oasis Montaj software, with the creation of lithology voxels in each section. The lithology voxel is nothing more than a 3D tool for gridding that uniquely integrates data from lithology using the three spatial dimensions. In this specific case, the kriging method was defined as the best con-ditioned statistical algorithm for data interpolation.
The goal here is, besides analyzing the behavior of the di-rect modeling, to visualize possible lateral variations that were mapped by the use of airborne gamma spectrometry survey data.
i i
“main” — 2018/3/1 — 16:48 — page 89 — #25
i i
FERREIRA VN, SILVA AM, TOLEDO CLB, J´ACOMO MH, ASSIS LM & PIRES ACB
89
The following figures show the products of modeling with the RGBternary composition above them. The images are separated by a vertical offset in order to facilitate the visualization of both data.
The Section I voxel (Fig. 19) shows an apparent dip of the rocks to W-SW, in accordance with what has been mapped in the field. In addition, there are mafic rocks on the top, correlated to the Igarap´e Cigarra Formation and mafic rocks at the base, in-terpreted as Paraupebas Formation. The ore is clearly concen-trated at the top of the section and its presence declines as the depth increases. At the top we have the lateral variation from ore to chemical canga. It is worth noting the change in the gamma spectrometry response according to lithology. In areas defined as chemical canga, there is a tendency to have higher concentrations of the three radioelements (marked area), heading west. In the areas where ore canga outcrops there is a decrease in this re-sponse, indicated by dark tones, which are consistent with the low values found for the respective lithotype.
A similar pattern is expected for Section II (Fig. 19), where areas with higher concentrations of K, U and Th in the ternary com-position image are consistent with the mapped chemical canga. Between F1495/N4WS and F1348/N4WS drill holes, there is a region in a more greenish tone of RGB composition, defined in the modeling as outcropping semi-weathered mafic rocks. In fact, statistical data indicate that, both thorium and uranium have a higher concentration within this lithotype when compared to potassium. The ore canga, linked directly to the ore, is indicated by the gamma spectrometry airborne survey data as the darkest area, connected to the low radioelement concentration.
Section III is the one that best reflects the correlation be-tween the responses of the RGB ternary composition and the top of the drill holes data (Fig. 19). The most western portion (marked) shows the high radioelement concentration linked not only to chemical canga but also to semi-weathered mafics. Note the pat-tern of gamma-spectrometric response located at the top of the F1100/N4WS hole, distinct from that found in the previous sec-tions. The RGB composition reflects an area richer in thorium as compared to the other radioelements. As expected the ore canga had a low response from the three radioelements. It is observed that the coverage of the ore canga is thin and followed in depth by semi-weathered mafics, unlike sections I and II. An interaction between the two lithotypes may be indicated by the anomalous behavior observed.
Given the correlation between the surface lithological infor-mation integrated with the gamma spectrometry airborne survey, the same comparison can be made for the petrophysical products
in order to confirm the validity of the methods used for geological characterization of the N4WS body. The following figures illustrate Sections I, II and III with the interpretation of petrophysical zones superimposed by to image of RGB ternary composition, K, U and Th (Fig. 20).
Superficial petrophysical zones are spatially coincident with the patterns defined by the gamma-spectrometric airborne survey for the respective lithotypes. The lateral variation of the radioele-ments concentration in the RGB ternary composition image fol-lows the limits defined by the petrophysical zones of ore canga, with low radioelement concentration, and chemical canga, with high radioelement concentration. The top sections do not differ in relation to the petrophysical areas, in partial compliance with the proposed geological modeling, except for semi-weathered mafics, as previously discussed with respect to its similarity to the chem-ical canga. The absence of jaspilites and mafic rocks on surface, due to the severe weathering in the region, prevents the qualita-tive comparison with the airborne geophysical products for the purpose of confirmation with the data measured in the drill holes. The same situation is also true for the friable hematite, which dis-plays at least its physical parameters correlated to the ore canga, facilitating a possible identification. The highlighted anomalous zones do not have correspondence on surface, which makes the airborne products inefficient for its characterization in the sam-pled area. It is important to note their presence in similar depths and their spatial continuity, regardless of the rock in which they are “hosted”, indicative of a later onset of the diagenetic and min-eralization processes.
CONCLUSIONS
The use of tools that allow the characterization of physical proper-ties of iron formations and their consequent mineralization are still restricted to other mineral resources. However, with the magnetic susceptibility and radiometric signature identified, it was possi-ble to define enough criteria to differentiate jaspilites, iron ore and surrounding mafic rocks. Such evaluation was even further extended, and a variation within jaspilites concerning magnetic susceptibility that hadn’t been described geologically could be identified. The radioelement concentration, using total count, was also interesting for the identification of anomalous zones rich in K, U and Th not only in iron ore but also in local jaspilites.
Both methods are interesting for direct application in the wells. Although it is not a tool for direct exploration, it was used to accurately map the stratigraphy and identify complex structures in a seemingly regular stratigraphy.
i i
“main” — 2018/3/1 — 16:48 — page 90 — #26
i i
90
ALTERNATIVE METHODS FOR DIFFERENTIATION OF BANDED IRON FORMATIONS AND IRON OREi i
“main” — 2018/3/1 — 16:48 — page 91 — #27
i i
FERREIRA VN, SILVA AM, TOLEDO CLB, J´ACOMO MH, ASSIS LM & PIRES ACB