(Annals of the Brazilian Academy of Sciences) ISSN 0001-3765
www.scielo.br/aabc
Evaluating the quality of the Digital Elevation Models produced from ASTER
stereoscopy for topographic mapping in the Brazilian Amazon Region
CLEBER G. DE OLIVEIRA and WALDIR R. PARADELLA
Instituto Nacional de Pesquisas Espaciais (INPE), Divisão de Sensoriamento Remoto (DSR), Av. dos Astronautas, 1758 12227-010 São José dos Campos, SP, Brasil
Manuscript received on January 2, 2008; accepted for publication on September 3, 2008; presented byALCIDESN. SIAL
ABSTRACT
Brazilian Amazon is a vast territory rich in natural renewable and non-renewable resources. Due to the adverse environmental condition (rain, cloud, dense vegetation) and difficult access, topographic information is still poor, and when available needs to be up-dated or re-mapped. In this paper, the feasibility of using elevation generated from orbital ASTER stereo-pairs images for topographic mapping was investigated for the mountainous relief in the Serra dos Carajás, Pará. The quality of information derived from these optical images was evaluated regarding field altimetric measurements. Precise topographic field information acquired from Global Positioning System (GPS) was used as Ground Control Points (GCPs) for the modeling of the stereoscopic Digital Elevation Models (DEMs) and as Independent Check Points (ICPs) for the calculation of elevation accuracies. The analysis was performed following two approaches: (1) the use of Root Mean Square Error (RMSE) and (2) calculations of trend analysis and accuracy. The investigation has shown that the altimetric accuracy from ASTER fulfilled the Brazilian Map Accuracy Standards elevation requirements for 1:100,000 A Class. In addition, ASTER can provide up-dated planimetric information that is also necessary for cartographic production. Thus, when the environment condition allows the acquisition of stereo-pairs, the use of ASTER can be considered an alternative for semi-detailed topographic mapping in similar environments of the Brazilian Amazon.
Key words:topographic mapping, DEM, ASTER, stereoscopy, Amazon Region.
INTRODUCTION
Brazilian Amazon, with almost 5,500,000 km2, presents,
under an apparently homogeneous forest physiognomy, an enormous spatial variability in climate, geology, soils, river systems, plant and animal communities. Due to the adverse environmental condition (rain, cloud, dense vegetation) and difficult access, the usage of remotely sensed optical data for regular airphoto basis coverage is expensive or even not possible. As a consequence, the Brazilian topography is still poorly known, with al-most 25% of the area covered by maps at reconnaissance scale (1:250,000 up to 1:1,000,000). For the
remain-Correspondence to: Cleber Gonzales de Oliveira E-mail: [email protected]
der of the region, the cartography at semi-detailed scale (1:100,000) needs to be up-dated or re-mapped (IBGE 2001).
Digital Elevation Model (DEM) is a primary input for topographic mapping. With the advent of Advanced Spaceborne Thermal Emission and Reflection Radiome-ter (ASTER) sensor, launched in 1999 on board of Terra platform, the generation of optical DEMs from the visible and near infrared (VNIR) band 3 (nadir and backwards) could be generated using orbital stereoscopy.
First results were published in the literature with a general consensus of the elevation accuracy with ASTER stereo-pairs ranging from±7 m to±15 m (Toutin 2002,
vious investigations were mainly concentrated in sites with favorable environmental (low to moderate vegeta-tion cover, well defined ground features within the Re-mote Sensing (RS) images, etc.) and experimental con-ditions (ancillary planialtimetric data with high quality and quantity to derive DEMs and test accuracies). Sec-ondly, GCPs with quality, number and distribution is a critical point for the operational use of the technology in the tropics. In this paper, the altimetric quality of DEMs generated with 30 m from ASTER data was evaluated for a mountainous topographic terrain in the Brazilian Amazon. It is an outgrowth of previous investigations of the authors focusing on the use of orbital stereoscopic to overcome the critical lack of topographic information in the Brazilian Amazon (Paradella et al. 2005).
STUDY SITE
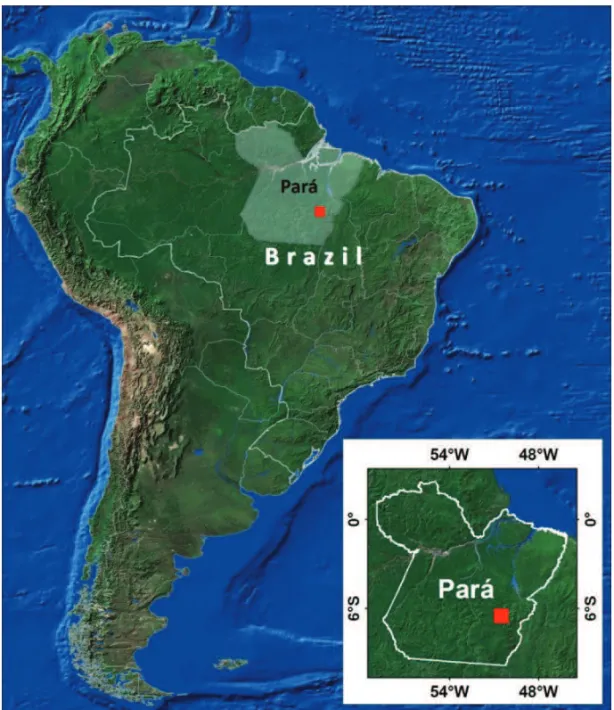
The test-site located in the Serra dos Carajás, eastern-most border of the Brazilian Amazon region, was se-lected for the investigation (Fig. 1). The Carajás Mineral Province, within the domains of the Amazonia rain for-est, is the most important Brazilian mineral province and comprises several mineral deposits, of a diversified va-riety, particularly with the world’s largest iron deposits. The region is characterized by a set of hills and plateaus known as Serra dos Carajás (altitudes from 500 to 900 meters) surrounded by southern and northern lowlands (altitudes around 200 meters), totally covered by Om-brophilous Equatorial forest. The study area comprises part of the Água Fria, Caldeirão, Rio Parauapebas, Rio Verde, Serra dos Carajás and Serra Pelada topographic sheets (1:100,000 scale) produced from black and white
(1.0–2.5μm) with 30 m resolution and TIR, represented
by 5 bands in the thermal infrared spectral range (8–12μm) with 90 m spatial resolution. As shown in
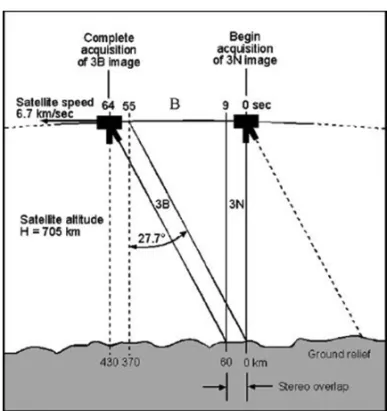
Figure 2, using the VNIR one nadir-looking (3N, 0.76– 0.86μm) and one backward-looking (3B, 27.7 degrees
off-nadir) telescope it is possible to acquire black-and-white stereo-pairs under an along-track stereo configu-ration with a base-to-height ratio of 0.6. An approxi-mately 60 s interval is noted between the time the nadir telescope passes over a ground location and the aft tele-scope records the same point on the ground track of the satellite. An ASTER scene covers an area of 61.5×
63 km and the cross-track pointing out to 136 km allows viewing of any area on Earth at least once every six-teen days. The along-track mode of data acquisition is considered a major advantage as compare to cross-track since the images forming the stereo-pairs are acquired a few seconds apart under similar environmental and light-ing. This favors stereo configuration of consistent qual-ity and well suited for DEM generation by automated stereo-correlation techniques (Hirano et al. 2003, Kamp et al. 2003).
Fig. 1 – Location of the study area in the Pará State.
GPS FIELDMEASUREMENTS
Although the requirements for the maximum GCPs number are not specified, a larger number is recom-mended to improve accuracy for DEM extraction with samples ideally chosen on a variety of locations and ground elevations, at the lowest and highest elevation. On the other hand, ICPs also play a key role in quality control for mapping production. Generally, a balance has to be reached between few ICPs, giving invalid ac-curacy estimation and an excessive number, providing a safe analysis but with unrealistic cost of acquisition in the field. According to Merchant (1987) a minimum of
20 well-distributed ICPs is necessary within a map. It is important to mention that topographic maps in Brazil should be classified according to the National Map Accu-racy Standard (PEC – Padrão de Exatidão Cartográfico in Portuguese), defined by the decree 89,817 of 1984, which classifies map products in relation to geometric quality. PEC is a statistical indicator (90% of probabil-ity) for planialtimetric accuracy, corresponding to 1.6449 times the Standard Error (PEC = 1.6449×SE), and
planial-Fig. 2 – ASTER stereo configuration (source: Toutin 2002).
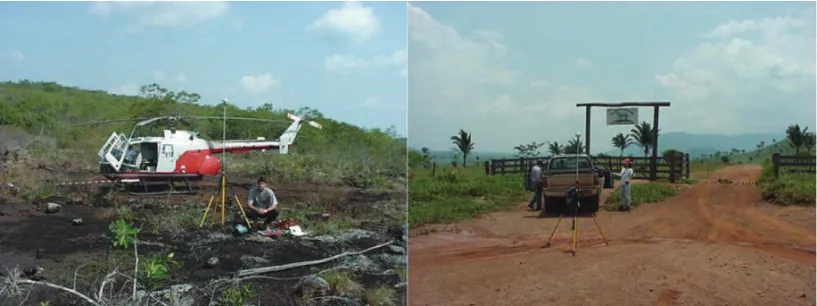
timetric measurements from Global Positioning System (GPS) were acquired in the test-site in September 2002, and used as GCPs for the modeling of the DEMs and as ICPs for the calculation of altimetric accuracies. Two dual frequency receptors were used in the field for static GPS measurements using vehicles and helicopters (Fig. 3). A total of 48 static GPS measurements and 35,000 kinematics GPS measurements were collected. The maximum errors with a probability of 68.3% (1σ )
for the positions estimated were 18 cm (latitude), 75 cm (longitude) and 24 cm (geometric altitude).
MATERIALS AND METHODS
GENERATION OFSTEREOSCOPICDEM
The Toutin’s model based on OrthoEngine package (PCI Geomatics 2003) was used to compute the stereo model geometry and the 3D intersections for the DEMs genera-tions. The model is based on geometric and stereoscopic models equivalent to the co-linearity and co-planarity equations in photogrammetry, which reflect the physi-cal reality of the complete viewing geometry taking into account the distortions of platform, sensor, Earth, pro-jection. If no GCPs are used, the stereo model is based upon the ancillary data exclusively and a relative DEM is produced (Satellite DEM). It is closer to the average forest height rather than the real topography. The
ad-STATISTICALANALYSIS
The accuracy and classification of the products were es-timated by comparison of the DEMs elevation values and the real elevation given by ICPs. The analysis was per-formed following two approaches: (1) the use of RMSE (and LE90, linear error with 90% probability, which is normally used in the international literature) for the over-all classification of the DEMs considering the PEC limits and, (2) calculations of trend analysis and accuracy based on the methodology proposed by Galo and Camargo (1994), which takes into account computed discrepan-cies and standard deviations. The aim of trend analy-sis is to check for the presence of systematic errors and it was based on the hypothesis(H0: 1Zˉ =0;H1:1Zˉ 6=0)whose acceptance or rejection is controlled by the
computed Student t statistics compared with the theoret-icaltn−1;α. Accuracy analysis uses comparison of the
variance of sample deviations(S12x)to their respective
pre-defined (table) values. The test is carried out using a hypothesis about the mean and standard deviation of the sample for each of the altimetric value. Chi-square
(χ2)is the statistical procedure that was applied. The
accuracy of the product can be estimated in the Z
val-ues using standard statistical methodology involving the comparison of a sample value ofχ2and the table value χ(2n−1,α). The values ofχ2are calculated based on the
equations:
χ2Z =(n−1)S 2
1Z
σZ2
whereS1Zis obtained from Table I and vary as a function
of the map scale using the relation:σZ =SE. The value
Fig. 3 – Details of the GPS campaign in Carajás.
TABLE I
Results of the GCPs/ICPs combinations (1Zˉ = Mean of discrepancies, S1Z =Standard Deviation
and RMSE=Root Mean Square Errors).
DEMs GCPs / ICPs 1Zˉ S1Z RMSE (m) (m) (m) 1 6 / 42 6.63 9.34 11.36 2 7 / 41 4.63 9.17 10.17 3 8 / 40 0.55 11.30 11.17 4 9 / 39 –0.17 11.43 11.43 5 10 / 38 1.70 10.15 10.16 6 11 / 37 1.46 10.39 10.35 7 12 / 36 0.19 10.09 9.95 8 13 / 35 0.44 10.12 9.99 9 14 / 34 0.37 10.65 10.50 10 15 / 33 1.33 10.51 10.43 11 16 / 32 0.50 10.01 9.87 12 17 / 31 –0.45 9.66 9.52 13 18 / 30 –1.07 9.89 9.78 14 19 / 29 –1.13 9.90 9.79 15 20 / 28 –0.47 9.46 9.30 16 21 / 27 0.00 9.74 9.56 17 22 / 26 0.10 9.75 9.56 18 23 / 25 0.61 9.12 8.95 19 24 / 24 0.88 9.50 9.34 20 25 / 23 1.48 9.06 8.98 21 26 / 22 0.05 9.79 9.57 22 27 / 21 0.31 9.76 9.53 23 28 / 20 –1.81 8.99 8.94
RESULTS AND DISCUSSION
Since the number of GCPs and ICPs has direct influ-ence on the DEM generation and on the estimation of the elevation accuracy, this issue was also investigated. An empirical approach was applied in order to define the minimum GCPs number required to produce a good product. Starting with 6 GCPs and 42 ICPs, additional GCPs points were gradually added with the correspond-ing DEMs becorrespond-ing analyzed regardcorrespond-ing quality (presence of failed areas, blunders, etc.) and statistics (residual re-port errors on GCPs) up to the final combination using 28 GCPs and 20 ICPs for accuracy estimation from the total of 48 GPS available. Table I and Figure 4 present the statistics of the results for all combinations of stereo-scopic DEMs.
Taking into account the results of Table I, statistical values related to mean, to the minimum and maximum values of Standard Deviation and to RMSE were further obtained considering all the number of produced DEMs (Table II).
TABLE II
Mean, minimum and maximum values of Standard Deviation and RMSE for all extracted DEMs.
Values Standard Deviation (m) RMSE (m)
Minimum 8.99 8.94
Mean 9.90 9.92
Fig. 4 – Distribution of Standard Deviations for ASTER DEMs considering the influence of the numbers of GCPs and ICPs.
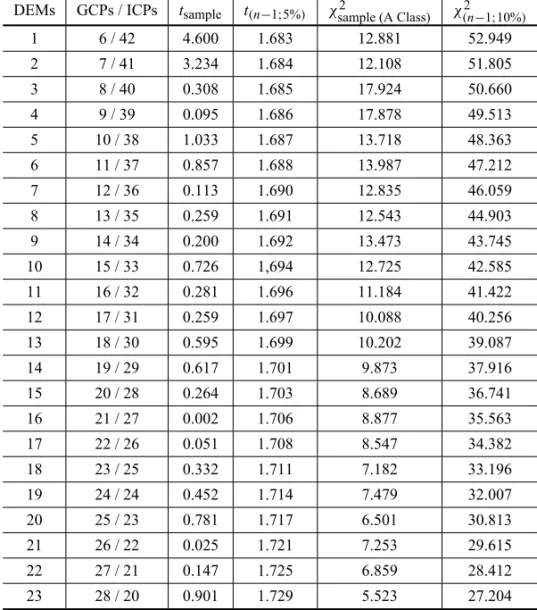
TABLE III
Statistics for Trend Analysis and Accuracy regarding the 23 DEMs produced from distinct combination of GCPs and ICPs.
DEMs GCPs / ICPs tsample t(n−1;5%) χsample (A Class)2 χ(2n−1;10%)
1 6 / 42 4.600 1.683 12.881 52.949
2 7 / 41 3.234 1.684 12.108 51.805
3 8 / 40 0.308 1.685 17.924 50.660
4 9 / 39 0.095 1.686 17.878 49.513
5 10 / 38 1.033 1.687 13.718 48.363
6 11 / 37 0.857 1.688 13.987 47.212
7 12 / 36 0.113 1.690 12.835 46.059
8 13 / 35 0.259 1.691 12.543 44.903
9 14 / 34 0.200 1.692 13.473 43.745
10 15 / 33 0.726 1,694 12.725 42.585 11 16 / 32 0.281 1.696 11.184 41.422 12 17 / 31 0.259 1.697 10.088 40.256 13 18 / 30 0.595 1.699 10.202 39.087
14 19 / 29 0.617 1.701 9.873 37.916
15 20 / 28 0.264 1.703 8.689 36.741
16 21 / 27 0.002 1.706 8.877 35.563
17 22 / 26 0.051 1.708 8.547 34.382
18 23 / 25 0.332 1.711 7.182 33.196
19 24 / 24 0.452 1.714 7.479 32.007
20 25 / 23 0.781 1.717 6.501 30.813
21 26 / 22 0.025 1.721 7.253 29.615
22 27 / 21 0.147 1.725 6.859 28.412
23 28 / 20 0.901 1.729 5.523 27.204
The conclusion to be drawn from the trend analysis and accuracy (Table III) is that only the ASTER DEMs produced from 6 and 7 GCPs did not fulfill the trend re-quirements since thetsamplevalues were larger than the t(n−1,5%)values. In addition, the comparison ofχsample2
andχ(2n−1.10%)values indicated that the DEMs are
com-patible with the Brazilian PEC elevation requirements for a 1:100,000 A Class Map (RMSE≤16.66 m),
inde-pendently of the number of GCPs that was used as input for the DEMs extraction.
Finally, the investigation also pointed out that the combination of 28 GCPs and 20 ICPs (DEM 23) pre-sented the best performance (Fig. 5) with an RMSE=
8.94 m. Finally, it was found a difference of only
2.49 m for DEMs with lower and higher RMSE val-ues, which reveals the consistency and stability of the Toutin’s model.
CONCLUSIONS
planimet-RESUMO
A Amazônia Brasileira é um rico e vasto território em recur-sos naturais renováveis e não-renováveis. Devido às condições ambientais adversas (chuvas, nuvens, vegetação densa) e difí-cil acesso, a informação topográfica ainda é escassa, e quando disponível necessita ser atualizada ou re-mapeada. Neste tra-balho, a viabilidade de usar elevação para mapeamento topo-gráfico por meio de imagens estereoscópicas orbitais ASTER foi investigada para relevo montanhoso na Serra dos Carajás, Pará. A qualidade da informação produzida destas imagens ópticas foi avaliada considerando medidas altimétricas de cam-po. Informações topográficas precisas de campo, adquiridas a partir do Sistema de Posicionamento Global (GPS), foram usadas como Pontos de Controle no Terreno (GCPs) para a modelagem de Modelos Digitais de Elevação (DEMs) este-reoscópicos e como Pontos de Verificação Independentes (ICPs), para o cálculo das precisões em elevação. As análises foram realizadas seguindo duas abordagens: (1) a utilização do Erro Médio Quadrático (RMSE) e (2) cálculo das análises de tendência e precisão. A investigação mostrou que a acurá-cia altimétrica do ASTER atendeu aos requisitos altimétricos para a Classe A 1:100.000 do Padrão de Exatidão Cartográfico. Além disso, dados ASTER podem fornecer informação plani-métrica atualizada que também é necessária para a produção cartográfica. Assim, quando as condições ambientais permitem a obtenção de estéreo-pares, o uso do imageamento ASTER pode ser considerado uma alternativa valiosa para mapea-mento topográfico de semi-detalhe em ambientes similares da Amazônia Brasileira.
Palavras-chave: mapeamento topográfico, DEM, ASTER, estereoscopia, Região Amazônica.
mote Sens 43: 404–407.
ECKERTS, KELLENBERGERTANDITTENK. 2005. Accu-racy assessment of automatically derived digital elevation models from ASTER data in mountainous terrain. Int J Remote Sens 26: 1943–1957.
ERSDAC. 2001. Earth Remote Sensing Data Analysis Center, ASTER user’s guide part-I. General (Ver.3.1), Japan. FUJISADA H, BAILEY GB, KELLY GG, HARA S AND
ABRAMSMJ. 2005. ASTER DEM Performance. IEEE T Geosci and Remote Sens 43: 2707–2713.
GALO M ANDCAMARGO PO. 1994. O uso do GPS no controle de qualidade de cartas. In: CONGRESSO BRA-SILEIRO DE CADASTROTÉCNICO MULTIFINALITÁRIO (COBRAC-1994), 1, ANAIS. UFSC, Florianópolis, SC, Brasil.
HIRANOA, WELCHRANDLANGH. 2003. Mapping from ASTER stereo image data: DEM validation and accuracy assessment. ISPRS J Photogram Eng Rem Sens 57: 356– 370.
HUGGELC, SCHNEIDERD, MIRANDAPJ, GRANADOSDD ANDKÄÄBA. 2008. Evaluation of ASTER and SRTM DEM data for lahar modeling: A case study on lahars from Popocatepetl Volcano, Mexico. J Volcanol Geotherm Res 170: 99–110.
IBGE. 2001. Brazilian Institute of Geography and Statis-tics. Mapa Índice Digital – Mapeamento Geral do Brasil. 1aed., CD-ROM.
KAMPU, BOLCH T AND OLSENHOLLER J. 2003. DEM Generation from ASTER Satellite Data for Geomor-phometric Analysis of Cerro Sillajhuay, Chile/Bolivia. – ASPRS Annual Proceedings, 5, Anchorage, Alaska, USA, 9 p.
American Congress on Surveying and Mapping annual meeting, 42nd, Denver, CO, p. 222–231.
PARADELLA WR, OLIVEIRA CG, CECARELLI ICF, COTTINI CP AND OKIDA R. 2005. Operational Use of RADARSAT-1 Fine Stereoscopy Integrated with TM-Landsat 5 Data for Cartographic Application in the Brazilian Amazon. Can J Remote Sens 31: 139–148. PCI GEOMATICS. 2003. Geomatica OrthoEngine User
Guide, version 9.0, Ontario, Richmond Hill, Canadá, 168 p.
SAN BTAND SÜZENML. 2005. Digital elevation model (DEM) generation and accuracy assessment from ASTER stereo data. Int J Remote Sens 26: 5013–5027.
TOUTINT. 2002. Three-Dimensional Topographic Mapping with ASTER Stereo Data in Rugged Topography. IEEE T Geosci and Remote Sens 40: 2241–2247.
TOUTINT. 2008. ASTER DEMs for geomatic and geoscien-tific applications: a review. Int J Remote Sens 29: 1855– 1875.
TOUTINTANDCHENGP. 2001. DEM generation with AS-TER stereo data. Earth Observation Magazine (EOM) 10(6): 10–13.