EVALUATION OF ASTER GDEM VER2 USING GPS MEASUREMENTS AND SRTM
VER4.1 IN CHINA
Peng Lia, Chuang Shia,b, Zhenhong Lic,*, Jan-Peter Mullerd, Jane Drummondc, Xiuyang Lie, Tao Lia, Yingbing Lif and Jingnan Liua
a
GNSS Research Center, Wuhan University, Wuhan, China – (lipeng, shi, taoli, liu)@whu.edu.cn b
State Key Laboratory of Information Engineering in Surveying, Mapping and Remote Sensing, Wuhan University, Wuhan, China
c
COMET+, School of Geographical and Earth Sciences, University of Glasgow, Glasgow, UK - [email protected]
d
Mullard Space Science Laboratory, Department of Space and Climate Physics, University College London, UK - [email protected]
e
Zhejiang University, Zhejiang, China - [email protected] f
School of Geodesy and Geomatics, Wuhan University, Wuhan, China - [email protected]
Commission IV, Working Group IV/6
KEY WORDS: Mapping, Interoperability, Comparison, ASTER GDEM, DEM
ABSTRACT:
The freely available ASTER GDEM ver2 was released by NASA and METI on October 17, 2011. As one of the most complete high resolution digital topographic data sets of the world to date, the ASTER GDEM covers land surfaces between 83°N and 83°S at a spatial resolution of 1 arc-second and will be a useful product for many applications, such as relief analysis, hydrological studies and radar interferometry. The stated improvements in the second version of ASTER GDEM benefit from finer horizontal resolution, offset adjustment and water body detection in addition to new observed ASTER scenes. This study investigates the absolute vertical accuracy of the ASTER GDEM ver2 at five study sites in China using ground control points (GCPs) from high accuracy GPS benchmarks, and also using a DEM-to-DEM comparison with the Consultative Group for International Agriculture Research Consortium for Spatial Information (CGIAR-CSI) SRTM DEM (Version 4.1). And then, the results are separated into GlobCover land cover classes to derive the spatial pattern of error. It is demonstrated that the RMSE (19m) and mean (-13m) values of ASTER GDEM ver2 against GPS-GCPs in the five study areas is lower than its first version ASTER GDEM ver1 (26m and -21m) as a result of the adjustment of the elevation offsets in the new version. It should be noted that the five study areas in this study are representative in terms of terrain types and land covers in China, and even for most of mid-latitude zones. It is believed that the ASTER GDEM offers a major alternative in accessibility to high quality elevation data.
1. INTRODUCTION
The ASTER GDEM version 2 (GDEM2) was released for free by NASA and METI (the Ministry of Economy, Trade and Industry of Japan) on October 17, 2011. As one of the most complete high resolution digital topographic data sets of the world so far, the ASTER GDEM covers land surfaces between 83°N and 83°S at a spatial resolution of 1 arc-second (approximately 30m at the equator), available for high latitude and steep mountainous areas not covered by Shuttle Radar Topography Mission (Farr et al. 2007). So it will be a useful product for many applications, such as radar interferometry, relief analysis, hydrological studies, disaster and environmental monitoring.
The joint US-Japan ASTER GDEM validation team (2011) has demonstrated an overall improvement in the production quality for GDEM2 by comparison with that of the ASTER GDEM version 1 released in June 29, 2009. It is reported that GDEM2 benefits from the refinements to the production algorithms, including elevation offset adjustment of -5m observed in the GDEM1, improved water masking to detect lakes with 1km2 and a smaller correlation kernel size of 5×5 pixels to yield higher spatial resolution, as well as new observed ASTER data (260,000 scenes) after September 2008 (Carabajal 2011, Gesch et al. 2011, Tachikawa et al. 2011a, 2011b).
Many published studies concerning the quality of SRTM and ASTER elevation data have focused largely on their preliminary or other releases, covering miscellaneous areas but not exclusively referring to China (Welch et al. 1998, Langand Welch 1999, Hirano et al. 2003, Carabajal and Harding 2006, Gorokhovich and Voustianiouk 2006, Guth 2006, Hofton et al. 2006, Nikolakopoulos et al. 2006, Rodriguez et al. 2006, Hayakawa et al. 2008, Oliveira and Paradelia 2009, Slater et al. 2009, Tadono et al. 2009, Abrams et al. 2010, Guth 2010, Hirt et al. 2010, Mouratidis et al. 2010, Sertel 2010, Chrysoulakis et al. 2011, Miliaresis and Paraschou 2011). As with the validation of GDEM1 in China (Li et al. 2012), the accuracy of GDEM2 is evaluated over five study areas in China against GPS survey benchmarks/Ground Control Points (GCPs) in addition to a pixel-to-pixel comparison with the CGIAR-CSI SRTM Version 4.1 (Jarvis et al. 2008) in this paper.
2. METHODS AND REFERENCE DATA
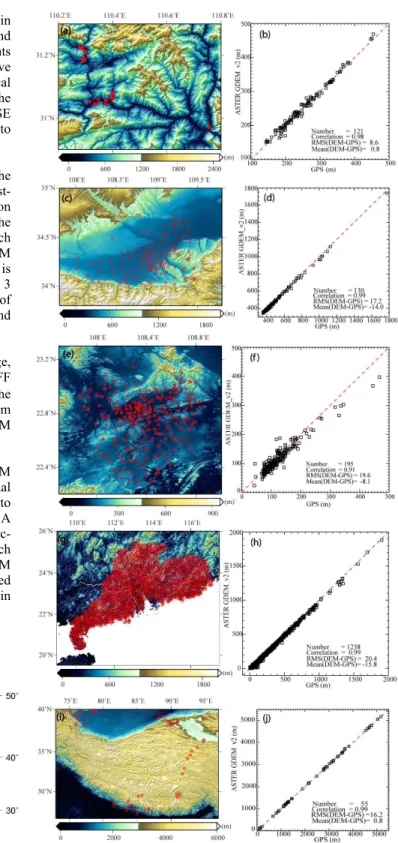
shown in Figure 1 that the five areas are separately located in different geographical locations, spatial independent and comprised of diverse topographies. The GPS points demonstrated in the left column of Figure 2 (a, c, e, g, i) have centimetre-level accuracies in their horizontal and vertical coordinates (Wang et al. 2001, Li et al. 2012). Therefore, the uncertainties in the GPS datasets can be neglected, and RMSE values can be used to represent the DEM errors, in addition to mean error.
Another reference data used for raster-based comparison is the freely available SRTM version 4.1 which is the updated post-processed SRTM release after using sophisticated interpolation and hole-patching methods and being also called the Consultative Group for International Agriculture Research Consortium for Spatial Information (CGIAR-CSI) SRTM (Jarvis et al. 2008, Hirt et al. 2010). The SRTM v4.1 is distributed in 5°×5° tiles containing 6001×6001 pixels with 3 arc-second spatial resolution and the absolute height error of better than 10m (Rodriguez et al. 2006, Gorokhovich and Voustianiouk 2006).
As the first global 1 arc-second elevation dataset free of charge, the ASTER GDEM is packaged in 1°×1° tiles in GeoTIFF format with geographic coordinates. The overall accuracy of the GDEM1 is around 20m at the 95% confidence level, while 17m for that of the GDEM2 evaluated by the ASTER GDEM validation team (2009, 2011).
Before comparing with elevation values of the ASTER GDEM and SRTM, GPS data should be converted from ellipsoidal elevations regarding to World Geodetic System (WGS84) to orthometric elevations with the EGM96 geopotential model. A resampled ASTER GDEM with a spatial resolution of 3 arc-seconds was generated by directly reading the elevation each three columns and rows to derive height differences with SRTM v4.1 (Hayakawa et al. 2008). Note that only one resampled ASTER GDEM tile was used to compare with SRTM v4.1 in each test site.
Figure 1. Locations of the study areas over China, plotted on a shaded relief map from GTOPO30 data (copyright by USGS: www1.gsi.go.jp/geowww/globalmap-gsi/gtopo30/gtopo30.html). A=Three Gorges area; B=Xi’an area; C=Nanning area; D= Guangdong area; E=Tibetan plateau.
3. RESULTS
3.1 Comparison against GPS points
3.1.1 Three Gorges Area: The longest river in China, that is Yangtze River, flows through the world famous Three Gorges Reservoir Region where it is full of steep mountains and forests. The GPS measurements (121 GCPs) conducted for landslide deformation monitoring in Badong and Zigui city were located on banks along the rivers in Figure 2a.
3.1.2 Xi’an Area: With a great variation of heights, Xi’an city is located in the Guanzhong Plain in central China. It borders the northern foot-hills of the Qinling Mountain to the south, and the banks of the Wei River to the north. Most of the 130 GCPs are located on the flood plain and others on the rugged relief (Figure 2c).
3.1.3 Nanning Area: 195 GCPs are evenly distributed in a hilly basin in the Nanning area with elevations between 70 and 500 m above the mean sea-level on the north bank of the Yong River in southern China (Figure 2e). The landscapes are composed of river plain, low hills, rocky mountains, undulating terrain and bench terraces.
3.1.4 Guangdong Area: Guangdong Province is close to the South China Sea and geographically separated from the north by a few mountain ranges, namely the Southern Mountain Range, where the Leizhou Peninsula is located in the southwest and the convergence of three upstream rivers forms the Pearl River Delta. Although there are four landscapes (rocky mountains, undulating terrain, bench terraces and coastal plains), the relief is more complex than that of Nanning area apparently. It is shown that the densest GCPs (1238 points) are filled in the Guangdong area in Figure 2g.
3.1.5 Tibetan Plateau Area: The Tibetan Plateau between the Himalayan range to the south and the Tarim Basin to the north is the largest and highest plateau in the world, with respect to averaging elevations more than 5000 m and 3500 km by 1500 km in size in Figure 2(i). A total of 55 high accuracy GCPs were spread in and around the plateau.
Table 1. Statistics of absolute vertical accuracies for ASTER GDEM v1, v2 and CSI SRTM by comparison with GPS benchmarks. The study region names are abbreviated in the first
column, which stand for Three Gorges, Xi’an, Nanning, Guangdong and Tibetan Plateau respectively. The correlation,
minimum, maximum, mean and RMS values of DEMs-GPS errors are computed. Unit is metres.
Figure 3. Histograms of the elevation differences among GDEM1, GDEM2 and CSI SRTM against overall GPS points (a, c, e) and raster-based comparisons between GDEM and SRTM over all of the five study areas (g, h). Elevation differences distribution of GDEM-GPS and SRTM-GPS over all of the five study areas (b, d, f). Corresponding GPS elevation is shown in the horizontal axis.
3.1.6 Absolute Vertical Accuracy: The results of the elevation differences between ASTER GDEM and GPS points in each of the five test areas are shown in the right column of Figure 2. The statistics of absolute vertical accuracies of GDEM2, as well as that of GDEM1 and SRTM v4.1 are listed in Table 1.
Note that the strategy of gross error elimination was employed in the previous accuracy validation of GDEM1 and SRTM-v4.1 (Li et al. 2012) and improved the RMS values by 1.1m and 2.4m respectively, while not for GDEM2 in order to statistically derive its original error characteristics. Compared to the GDEM1-GPS after gross error removal, RMS values of GDEM2-GPS in the four study areas reduce 1~9m, except for a 1.9m rise in Tibet. Therefore, there is a great improvement (7m) in the overall RMS value from 26.3m to 19.3m (Table 1 and Figure 3a).
As far as the mean error is concerned, it is near zero (0.8m) in Three Gorges area and Tibetan Plateau area (Table 1). However, Name DEM
vs. GPS Corr Min Max Mean RMS GDEM1 0.97 -32.3 24.7 -5.9 12.1 GDEM2 0.98 -29.5 20.7 0.8 8.6 3G
SRTM 0.92 -51.4 37.5 -10.5 24.5 GDEM1 0.99 -58.2 10.5 -18.9 21.6 GDEM2 0.99 -50.9 13.9 -14.0 17.2 XA
SRTM 0.99 -50.6 0.2 -12.8 16.9 GDEM1 0.94 -56.8 36.6 -14.9 20.0 GDEM2 0.91 -71.1 57.1 -8.4 19.1 NN
SRTM 0.98 -21.1 15.5 -2.4 7.6 GDEM1 0.99 -86.3 43.9 -24.9 29.0 GDEM2 0.99 -104 23.8 -15.8 20.4 GD
SRTM 0.99 -73.3 34.2 -20.8 25.0 GDEM1 0.99 -42.3 25.7 -5.9 14.1 GDEM2 0.99 -45.3 61.2 0.8 16.2 TP
SRTM 0.99 -22.0 13.4 0.9 8.6 GDEM1 0.99 -86.3 43.9 -21.4 26.3 GDEM2 0.99 -104 61.2 -13.1 19.3 Overall
there are still large negative mean values in Xi’an area (-14.0m), Nanning area (-8.4m) and Guangdong area (-15.8m). It is stated by the ASTER GDEM validation team (2011) that an elevation bias (-5m) observed in the GDEM1 was removed in the GDEM2. So it has a great impact on the overall mean error which decreased by 8.3m to -13.1m (Table 1 and Figure 3a).
As with GDEM1 and GDEM2 against GPS height, strong correlations (>0.9) also existed between SRTM v4.1 and GPS. It should be noted that the mean errors and RMS values of SRTM-GPS in Xi’an, Naning and Tibet areas were lower than those of both GDEM1-GPS and GDEM2-GPS. It is clearly indicated that the overall RMS value (22.8m) of SRTM is a bit larger compared with that of GDEM2, whereas it is better than GDEM1 (Table 1 and Figure 3a, 3c,3e).
On the whole, it is shown that there is a general underestimation of terrain elevation by the GDEM2, GDEM1 and SRTM from the negative mean error by comparing GCPs (Figure 3a, 3c and 3e). Slater et al. (2009) and Hirt et al. (2010) also reported that there was a clear negative bias (-5.2m and -8.2m) for GDEM1-GCPs, however, a positive bias (1.3m) for SRTM found by Hirt et al. (2010) in Australia. In the report of Gesch et al. (2011) the negative mean error of GDEM2GPS decreased from 3.7m to -0.2m compared to GDEM1-GPS, which was also smaller than that in this study.
Figures 3b, 3d and 3f show a density distribution of the elevation differences derived from GDEM2-GPS, GDEM1-GPS and SRTM-GPS respectively over the overall GPS points. There is an evident negative bias between the elevation differences for them, while it gets somewhat convergent within ±50 metres for GDEM2 versus GPS.
Table 2. Statistics of DEM inter-comparisons with CSI SRTM for ASTER GDEM v1 and v2. In each study area, there are two
ASTER GDEM tiles used for comparison with SRTM. In each GDEM tile, the first row is GDEM1-SRTM and the second
bolded row is GDEM2-SRTM. Unit is metres.
3.2 Comparison between GDEM2 vs. SRTM v4.1
Perfect positive correlations (>0.98) in the comparisons between ASTER GDEM and SRTM can be observed in Table 2, indicating the extent that they correlate with each other in the specified areas. In the Three Gorges area, the RMS value (26.2m) of GDEM2-SRTM was a little lower than that of GDEM1-SRTM, whereas a larger positive mean error (7.4m). It should be noted that dense trees and steep slope dominate in this area, which is consistent with the explanation that ASTER is measuring elevations at or near the top of the forest canopy while SRTM is recording elevations penetrating into the canopy (Gesch et al. 2011). Nanning, Guangdong and Tibet areas had a bit larger RMS values, while it decreased drastically in Xi’an
area. The negative mean errors in Xi’an 6.1m) and Nanning (-7.4m) areas become smaller than previous ones, while they changed to be positive in Guangdong (3.2m) and Tibetan Plateau (3.9m) areas. It is obvious that the overall mean error of GDEM2 versus SRTM approached to zero (0.2m) and the RMS value fall off from 22.0m to 20.6m (Table 2, Figures 3g and 3h).
3.3 Land Cover Analysis
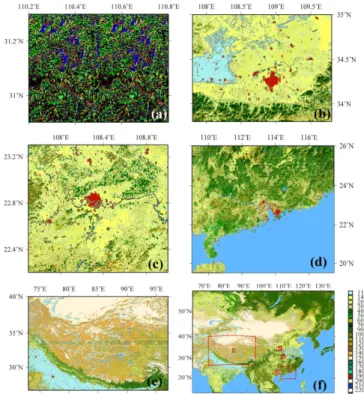
GlobCover land cover product v2.2 is derived from a time series (December 2004 - June 2006) of full resolution MERIS mosaics, including 22 land cover global classes which are defined using the UN Land Cover Classification System (LCCS) (Bicheron et al. 2008). Figure 4 presents the five study areas over China covered by the 22 global classes.
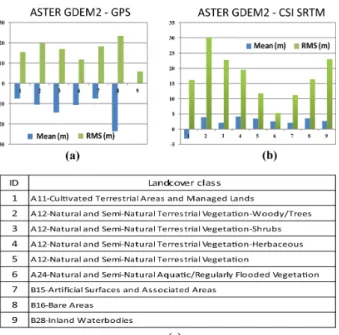
For simplicity to analysis, 22 land cover global classes of the GlobCover v2.2 were aggregated into 9 generalized LCCS land cover classes in Figure 5c. Each land cover class was resampled to accord with the 30m or 90m DEM by using a nearest neighbour scheme.
Figure 4. Land cover map with geographical distribution of the 22 classes over the five test areas (a, b, c, d, e) and China (f) plotted on GlobCover v2.2 product (copyright by ESA GlobCover Project). The GlobCover global legend on the right of Figure 4(e) contains 22 classes extracted from Table 2 reported by Bicheron et al. 2008.
It is demonstrated that negative mean biases of GDEM2-GPS dominate in vegetation-covered (cultivated lands, artificial surfaces and terrestrial vegetation areas with trees, shrubs and herbaceous) areas, while the RMS values are no less than 10 metres in Figure 5a and Table 3. It indicates that ASTER GDEM appears to underestimate heights independent of vegetation cover partly because the ‘first return’ ASTER data is being over corrected for vegetation. As a result of no GPS points lying in areas with terrestrial vegetation and flooded vegetation, two landcover classes (ID=5 and 6) are not delineated in Figure 5a. Also note that only one GCP locating in bare areas (ID=8) brings large uncertainty. Inland waterbodies Name
GDEM(1, 2) tiles vs.
SRTM
Corr. Min Max Mean RMS
0.997 -514 581 1.7 27.5 3G N31E110
0.997 -523 545 7.4 26.2 0.991 -256 -202 -9.4 22.6 XA N34E108
0.997 -225 156 -6.1 14.2 0.984 -200 1003 -13.4 17.1 NN N22E108
0.965 -220 214 -7.4 18.1 0.982 -163 329 -2.2 8.9 GD N23E113
0.980 -154 321 3.2 9.1 0.995 -357 161 -0.68 15.6 TP N35E093
0.994 -248 157 3.9 17.3 0.99 -514 1003 -4.8 22.0 Overall 5 tiles
areas have the smallest RMSE value (5.8m) and near zero mean bias (0.1m), which benefits a lot from the improved water body masking. It has been noted that errors are low close to water bodies (presumably not on the water bodies as they are masked). Perhaps this is due to good matching wherever there is either a water body with very distinct and monotone feature or its mask. As a result of the identified issues in GlobCover v2.2, including inconsistencies due the lack of data, forest estimation, lakes and rivers, thematic errors etc., this analysis depends largely on how homogeneous the land cover is at the 30~300m scale in China with intensive agriculture (Li et al. 2012, Bicheron et al. 2008).
In Figure 5b and Table 4, the results of ASTER GDEM2-SRTM were separated into GlobCover land cover classes. There were positive mean biases (<4m) in all of the land cover classes except for the cultivated lands (-3.2m), and larger RMSE values in terrestrial vegetation areas with trees, shrubs and herbaceous areas, which reflects the fact that ASTER is a “first return” system, while SRTM gave the elevations within the vegetation canopy rather than at the top (Carabajal and Harding 2006, Hofton et al. 2006, Gesch et al. 2011).
Figure 5. a and b show the landcover class assessment for the elevation differences (GDEM-GPS and GDEM-SRTM, respectively) over the five study areas. (c) The UN Land Cover Classification System (LCCS) landcover classes used as a mask for elevation comparison and ID corresponding to the value of horizontal axis in (a) and (b).
Table 3. Statistics of the elevation difference between ASTER GDEM2 and GPS/GCPs separating into GlobCover land cover
classes. Unit is metres.
Table 4. Statistics of the elevation difference between ASTER GDEM2 and CSI SRTM separating into Globcover land cover
classes. Unit is metres.
4. CONCLUSIONS
By comparing with precise GPS measurements, the overall absolute vertical accuracy (19m) of ASTER GDEM2 was evaluated in five study areas in China, which was better than that of the GDEM1 due to the elevation bias removal of -5 metres. At the same time, pixel-to-pixel comparison between GDEM2 and SRTM was investigated and then separated into ESA GlobCover land cover to analyse the relationship between error and land cover type. It is indicated that GDEM2 still exhibits negative elevation bias of about 10m through the land cover analysis. It is of great help to employ the improved water body detection for the quality of GDEM2. However, it is also reported that a smaller stereo correlation kernel has improved horizontal resolution at the expense of the increased high frequency noise (Tachikawa et al 2011b), which is not covered in this paper and needs to be further tested.
5. REFERENCES
Abrams, M., Bailey, B., Tsu, H. and Hato, M., 2010,The ASTER Global DEM. Photogrammetric Engineering and Remote Sensing, 76(4), pp: 344-348.
ASTER GDEM Validation Team, 2009, ASTER Global DEM validation summary report, Prepared by ASTER GDEM Validation Team: METI/ERSDAC, NASA/LPDAAC and USGS/EROS, in cooperation with NGA and other collaborators. http://www.ersdac.or.jp /GDEM/E/image/ASTERGDEM_ValidationSummaryReport_Ver1.pdf (accessed 29 June 2009).
ASTER GDEM Validation Team (Tachikawa, T., Kaku, M., Iwasaki, A., Gesch, D., Oimoen, M., Zhang, Z., Danielson, J., Krieger, T., Curtis, B., Hasse, J., Abrams, M., Crippen, R., Carabajal, C. and Meyer D.), 2011. ASTER Global Digital Elevation Model Version 2-Summary of Validation Results. http://www.ersdac.or.jp/GDEM/ver2Validation/ Summary_GDEG2 _validation_report_final.pdf (accessed 20 October 2011).
Bicheron, P., Defourny, P., Brockmann, C., Schouten, L., Vancutsem, C., Huc, M., Bontemps, S., Leroy, M., Achard, F., Herold, M., Ranera, F. and Arino, O., 2008, GLOBCOVER Products Description and Validation Report. http://ionia1.esrin. esa. int/docs/GLOBCOVER_Pro ducts_Description_Validation_Report_I2.1.pdf(accessed 3 November 2010).
Carabajal, C.C., and Harding, D.J., 2006. SRTM C-band and ICESat laser altimetry elevation comparisons as a function of tree cover and relief. Photogrammetric Engineering & Remote Sensing, 72(3), pp. 287-298.
ID Min Max Mean RMS Points Percent (%) 1 -57.8 57.1 -7.4 15.4 310 69.20 2 -71.1 14.8 -10.4 19.8 67 14.96
3 -35.3 -0.8 -14.3 16.9 14 3.13
4 -17.1 -7.0 -10.7 11.7 2 0.45
7 -38.8 52.7 -7.4 18.3 46 10.27 8 -23.5 -23.5 -23.5 23.5 1 0.22
9 -10.5 5.9 0.1 5.8 8 1.79
ID Min Max Mean RMS Points Percent (%) 1 -459 509 -3.2 16.2 3676389 51.700
2 -523 545 3.9 30.2 1565498 22.015
3 -424 456 2.1 22.7 422538 5.942
4 -227 169 4.1 19.4 630523 8.867
5 -103 87 3.4 11.7 28434 0.400
6 -11 13 2.6 5.3 210 0.003
7 -167 190 2.1 11.2 199405 2.804 8 -248 157 3.6 16.4 495186 6.964
Carabajal, C., 2011. ASTER Global DEM Version 2.0 Evaluation Using ICESat Geodetic Ground Control (ICESat/GSFC Validation Report). http://www.ersdac.or.jp/GDEM/ver2Validation/Appendix_D_IIIICE_ GDEM2_validation_report.pdf (accessed 20 October 2011).
CGIAR-CSI, 2009, SRTM 90m Digital Elevation Data. http://srtm.csi. cgiar.org/ (accessed 20 August 2009).
Chrysoulakis, N., Abrams, M., Kamarianakis, Y. and Stanisławski M., 2011, Validation of the ASTER GDEM for the area of Greece.
Photogrammetric Engineering and Remote Sensing, 77(2), pp. 157-165. Farr, T.G., Rosen, P.A., Caro, E., Crippen, R., Duren, R., Hensley, S., Kobrick, M., Paller, M., Rodriguez, E., Roth, L., Seal, D., Shaffer, S., Shimada, J., Umland, J., Werner, M., Oskin, M., Burbank, D. and Alsdorf, D., 2007, The Shuttle Radar Topography Mission. Reviews of Geophysics, 45, RG2004, doi: 10.1029/ 2005RG000183.
Gesch, D., Oimoen, M., Zhang, Z., Danielson, J. and Meyer, D., 2011. Validation of the ASTER Global Digital Elevation Model (GDEM) Version 2 over the Conterminous United States (USGS Validation Report), http://www.ersdac.or.jp/GDEM/ver2Validation/Appendix_B_ CONUS%20_GDEMv2_validation_report.pdf (accessed 20 October 2011).
Gorokhovich, Y. and Voustianiouk, A., 2006, Accuracy assessment of the processed SRTM-based elevation data by CGIAR using fielding data from USA and Thailand and its relation to the terrain characteristics. Remote Sensing of Environment, 104, pp. 409−415.
Guth, P.L., 2006, Geomorphometry from SRTM: Comparison to NED.
Photogrammetric Engineering & Remote Sensing, 72, pp. 269−277.
Guth, P.L., 2010, Geomorphometric comparison of ASTER GDEM and SRTM. Special joint symposium of ISPRS Technical Commission IV & AutoCarto in conjunction with ASPRS/CaGIS 2010 Fall Specialty Conference, November 15-19, 2010 Orlando, Florida.
Hayakawa Y.S., Oguchi T. and Lin Z., 2008, Comparison of new and existing global digital elevation models: ASTER G-DEM and SRTM-3.
Geophysical Research Letters, 35, L17404, doi: 10.1029/2008GL 035036.
Hirano, A., Welch, R. and Lang, H., 2003, Mapping from ASTER stereo image data: DEM validation and accuracy assessment. ISPRS Journal of Photogrammetry and Remote Sensing, 57, pp. 356−370.
Hirt, C., Filmer, M.S., and Featherstone, W.E., 2010, Comparison and validation of the recent freely available ASTER-GDEM ver1, SRTM ver4.1 and GEODATA DEM-9S ver3 digital elevation models over Australia. Australian Journal of Earth Sciences, 57, pp. 337 – 347.
Hofton, M., Dubayah, R., Blair, J.B. and Rabine, D., 2006, Validation of SRTM elevations over vegetated and non-vegetated terrain using medium footprint lidar. Photogrammetric Engineering & Remote Sensing, 72, pp. 279−285.
Jarvis, A., Reuter, H.I., Nelson, A. and Guevara, E., 2008, Hole-filled SRTM for the globe Version 4, available from the CGIAR-CSI SRTM 90m Database (http://srtm.csi.cgiar.org).
Lang, H. and Welch, R., 1999, Algorithm Theoretical Basis Document for ASTER Digital Elevation Models. Jet Propulsion Laboratory, Pasadena, CA. Available online at: http://eospso.gsfc.nasa.gov/eos_ homepage/for_scientists/atbd/docs/ASTER/atbd-ast-14.pdf (accessed 28 October 2009).
Li, P., Shi, C., Li, Z.H., Muller, J.P., Drummond, J., Li, X.Y., Li, T., Li Y.B. and Liu, J.N., 2012. Evaluation of ASTER GDEM Using GPS Benchmarks and SRTM over China. International Journal of Remote Sensing, in press.
Miliaresis, G.Ch. and Paraschou, C.V.E., 2011, An evaluation of the accuracy of the ASTER GDEM and the roleof stack number: a case study of Nisiros Island, Greece. Remote Sensing Letters, 2, pp. 127–135.
Mouratidis, A., Briole, P. and Katsambalos, K., 2010, SRTM 3'' DEM (versions 1, 2, 3, 4) validation by means of extensive kinematic GPS
measurements: a case study from North Greece, International Journal of Remote Sensing, 31(23), pp. 6205-6222.
Rodriguez, E., Morris, C.S. and Belz, J.E., 2006, A global assessment of the SRTM performance. Photogrammetric Engineering & Remote Sensing, 72, pp. 249−260.
Sertel, E., 2010, Accuracy assessment of ASTER Global DEM over Turkey. Special joint symposium of ISPRS Technical Commission IV & AutoCarto in conjunction with ASPRS/CaGIS 2010 Fall Specialty Conference, November 15-19, 2010 Orlando, Florida.
Slater, J.A., Heady, B., Kroenung, G., Curtis, W., Haase, J., Hoegemann, D. Schockley, C. and Tracy, K., 2009, Evaluation of the new ASTER Global Digital Elevation Model, National Geospatial-Intelligence Agency. http://www.ersdac.or.jp/GDEM/E/image/ASTERGDEM_ ValidationSummaryReport_Ver1.pdf (accessed 29 June 2009).
Tadono, T., Shimada, M. and Takaku, J., 2009, Validation of precise digital surface model generated by PRISM onboard ALOS. In
Proceedings of SPIE: Sensors, Systems, and Next-Generation Satellites XIII, Berlin, Germany, 31 August−3 September 2009, 7474, pp. 74740H-1−74740H -12.
Tachikawa, T., Hato, M., Kaku, M. and Iwasaki, A., 2011a, The characteristics of ASTER GDEM version 2, In IGARSS 2011, Vancouver, Canada, July 2011 (Oral presentation).
Tachikawa, T., Kaku, M. and Iwasaki, A., 2011b. ASTER GDEM Version 2 Validation Report (Japan’s ERSDAC Validation Report). http://www.ersdac.or.jp/GDEM/ver2Vali-dation/Appendix_A_ERS DAC_GDEM2_validation_report.pdf (accessed 20 October 2011).
Wang, Q., Zhang, P., Freymueller, J.T., Bilham, R., Larson, K.M., Lai, X., You, X., Niu, Z., Wu, J., Li, Y., Liu, J., Yang, Z. and Chen, Q., 2001, Present-day crustal deformation in China constrained by Global Positioning System measurements. Science, 294.
Welch, R., Jordan, T., Lang, H. and Murakami, H., 1998, ASTER as a source for topographic data in the late 1990s. IEEE Transactions on Geoscience and Remote Sensing, 36(4), pp. 1282-1289.
Wessel, P. and Smith, W.H.F., 1998, New, improved version of the Generic Mapping Tools released. EOS, Transactions, American Geophysical Union, 79, pp. 579.
6. ACKNOWLEDGEMENTS
Part of this work was carried out in the University of Glasgow, which was supported by the Natural Environmental Research Council (NERC) through the GAS project (Ref: NE/H001085/1) and was also supported by a China NSFC Project (No. 41074005) and a China 973 Project (2006CB701301). This work was also supported in part by the ESA-MOST DRAGON-2 project (ID: 5343). Most figures were prepared using the public domain Generic Mapping Tools (Wessel and Smith 1998). The original data of ASTER GDEM are the property of METI and NASA and freely available from EROS DAC and NASA’s LPDAAC, and the hole-filled SRTM for globe Version 4 are available at no charge from CGIAR-CSI SRTM 90m Database. The GlobCover products are made available to the public by the European Space Agency and products covering the period Dec.2004-Jun.2006: © ESA GlobCover Project, led by MEDIAS-France.