Adsorption studies of etherdiamine onto modi
fi
ed sugarcane bagasses
in aqueous solution
Karla Aparecida Guimarães Gusmão, Leandro Vinícius Alves Gurgel,
Tânia Márcia Sacramento Melo, Cornélio de Freitas Carvalho, Laurent Frédéric Gil
*Departamento de Química, Instituto de Ciências Exatas e Biológicas, Universidade Federal de Ouro Preto, Campus Universitário Morro do Cruzeiro, 35400-000 Ouro Preto, Minas Gerais, Brazil
a r t i c l e
i n f o
Article history:
Received 12 February 2013 Received in revised form 13 November 2013 Accepted 20 November 2013 Available online 9 January 2014
Keywords: Adsorption
Etherdiamine Flotigam 2835 Modified sugarcane bagasse Iron oreflotation
a b s t r a c t
In this study sugarcane bagasse was modified with succinic anhydride and EDTA dianhydride to obtain SCB 2 and EB adsorbents, respectively. These adsorbents were used to remove etherdiamine, which is used for iron oreflotation from single aqueous solutions. The removal and recovery of etherdiamine is important for environmental and economic reasons due to its toxicity and high cost. The results demonstrated that adsorption of etherdiamine by SCB 2 and EB was betterfitted by a pseudo-second-order kinetic model than pseudo-first-order and Elovich models. Adsorption isotherms were better fitted by the Langmuir model rather than the Freundlich, Sips, and Temkin models. The maximum adsorption capacities (Qmax) of SCB 2 and EB for etherdiamine adsorption were found to be 869.6 and
1203.5 mg/g, respectively. The calculatedDGvalues for adsorption of etherdiamine on SCB 2 ( 22.70 kJ/ mol) and EB ( 19.10 kJ/mol) suggested that chemisorption is the main mechanism by which etherdi-amine is removed from the aqueous solution for both adsorbents. The highQmaxvalues showed that SCB
2 and EB are potential adsorbents for recovering the etherdiamine and treating effluents produced from iron oreflotation.
Ó2013 Elsevier Ltd. All rights reserved.
1. Introduction
Brazil has thefifth largest reserve of iron ore in the world. With a high percentage of iron in iron ores, Brazil is among the largest producers and exporters of iron in the world (Alves, 2006). With the reduction in reserves of high-grade iron ore, concentration processes have become indispensable for mining companies that commercialize iron ore as a raw material to make steel (Filippov et al., 2010; Magriotis et al., 2010). Froth flotation is the most effective method from both the technological and economical points of view for iron ore beneficiation (Lima et al., 2005) and to upgrade the iron concentration (Filippov et al., 2010; Pearse, 2005). Although differentflotation methods are available, reverse cationic flotation of quartz is by far the most widely used method to sepa-rate this major contaminant from iron ore (Araujo et al., 2005). Reverse cationic flotation of quartz is accomplished using fatty primary alkylamines partially neutralized with acetic acid, and basically consists of the selective separation of quartz particles from
iron oxides (Lima et al., 2005). For this purpose, commercial organic amine salts, known as etheramines, are commonly used (Araujo et al., 2005). These compounds may have one or two amine groups and the overall chemical structure of such organic com-pounds is: [ReOe(CH2)3eNHe(CH2)3eNH3]þCH3COO for
ether-diamine and [ReOe(CH2)3eNH3]þCH3COO for etheramine
(R¼alkyl group with carbon number>10), respectively (Araujo et al., 2010).
The presence of an ether group in the etheramine chain also increases its solubility in water (Lima et al., 2005). In theflotation process, the fatty amine is added to the system and is adsorbed on the quartz surface, and both are removed from the system as an aqueous pulp. However, at the pH at which this process occurs (close to 10), both quartz (SiO2) and hematite (Fe2O3) surfaces are
positively charged, and therefore they can adsorb the amine despite its preferential attraction for quartz. In order to avoid competitive iron oxideflotation, starch is used as a depressing agent (Araujo et al., 2010).
Globally, iron ore processing consumes 15,000e20,000 tons of etheramine, representing approximately 85 million US dollars (Magriotis et al., 2010). Due to its toxicity to aquatic organisms, high chemical oxygen demand (COD) value, corrosive proprieties and *Corresponding author. Tel.:þ55 31 3559 1717; fax:þ55 31 3559 1707.
E-mail address:laurent@iceb.ufop.br(L.F. Gil).
Contents lists available atScienceDirect
Journal of Environmental Management
j o u r n a l h o m e p a g e : w w w . e l s e v i e r . c o m / l o c a t e / j e n v m a n
high cost, the removal and the possible reuse of this compound is important. The adsorption of etheramine onto efficient and low cost supports enables water recycling and the recovery of amines from the effluent, which could result in a considerable reduction in operating costs (Magriotis et al., 2010). In addition, the adsorption process could also help to decrease the amount of toxic ether-amines discharged without any treatment into the environment (Magriotis et al., 2010).
Among the various methods available for water treatment, adsorption has received much attention since it not only reduces environmental contamination but also allows for water recycling and chemical recovery, which increases the feasibility of the pro-cess. At the present moment, few studies in the literature have investigated the adsorption of etheramines (Magriotis et al., 2010; Safa and Bhatti, 2011; Teodoro and Leão, 2004), and in both studies, clays were used as the solid support. No study of ether-amine recovery has been performed yet.
Sugarcane bagasse is a residue from the sugarcane crushing process. It is composed of lignin (20e25%), polyoses (25e30%), cellulose (40e50%); the minor components are extractives and ash (Caraschi et al., 1996). In the Brazilian scenario, the use of agri-cultural residues for novel applications is particularly attractive and a promising source of new materials, given that the in-vestments made by local industries in recent years for the pro-duction of renewable fuels continue to grow. According to the Brazilian Ministry of Agriculture, the sugarcane harvest in the 2011/2012 season is expected to reach 571.4 million tons, which will generate about 142.9 million tons of bagasse and 116.6 million tons of straw (CONAB, 2011). The macromolecules present in sugarcane bagasse, through their hydroxyl groups, are able to chemically react to produce new materials with new properties (Navarro et al., 1996; Xiao et al., 2001). Various studies on the use of bagasse as adsorbent for the removal of various pollutants can be found in the literature (Crini, 2006; Gupta and Suhas, 2009; Gurgel and Gil, 2009; Ho et al., 2005; Karnitz et al., 2007; Kumar, 2006; Ngah and Hanafiah, 2008; Xing and Deng, 2009); however, at the present moment, none have investigated ether-amine adsorption.
In our previous studies (Gurgel et al., 2008; Gusmao et al., 2012; Karnitz et al., 2009, 2010; Pereira et al., 2009; Pereira et al., 2010), sugarcane bagasse modified with succinic anhy-dride (SCB 2) and with EDTAD (EB) were used as adsorbent ma-terials for heavy metal and cationic dye adsorption. Both adsorbent materials (SCB 2 and EB) present a negatively charged surface due to the presence of carboxylate groups that are released after modification with succinic and EDTAD anhydrides and treatment with sodium bicarbonate solution. These charges are able to interact with cationic species such as dyes and heavy metals among others. At pH 10, about 50% of etheramine is in the ionized form and 50% is in the non-ionized form (Leja, 1982). Thus, at pH levels lower than 10, etheramines are positively charged (protonated) and can interact with negatively charged solid supports as SCB 2 and EB.
In the present study, the removal of the etherdiamine Floti-gam 2835 by adsorption from aqueous solution using SCB 2 and EB was extensively investigated with the aim of evaluating the possibility of applying SCB 2 and EB to the treatment of effluents containing etheramines from iron ore mining. SCB 2 and EB were chosen as the adsorbents due to their vast range of possible industrial applications including the treatment of effluents from textile and plating industries and from acid mine drainage. The adsorption studies were carried out using different contact times, pH values, and initial etherdiamine concentrations. The results were evaluated by different kinetic and adsorption models.
2. Materials and methods
2.1. Materials
Sugarcane bagasse was collected from a local alcohol and sugar plant in the city of Ouro Preto, Minas Gerais, Brazil. Succinic an-hydride and pyridine were purchased from Vetec (Brazil). Pyridine was left under reflux overnight with NaOH and then distilled.N,N -Dimethylformamide (DMF) was purchased from Synth (Brazil) and distilled under reduced pressure before use. EDTA (disodium salt) and acetic anhydride were purchased from Synth (Brazil) and used without further purification. Etherdiamine Flotigam 2835 ([ReOe (CH2)3eNHe(CH2)3eNH3]þCH3COO with R ¼ alkyl chain with
carbon numbers of 12 (20%) and 13 (80%), respectively) was pro-duced and distributed by the ClariantÒ
company (São Paulo, SP, Brazil).
2.2. Sugarcane bagasse preparation
First, sugarcane bagasse was dried in sunlight. The bagasse stalks were manually broken to reduce their length and then dried in an oven at 90 C for 24 h. After that, it was pulverized in a vibratory disc mill equipped with tungsten carbide. The powder was sifted in a four-sieve system composed of screens of 10 (1.68 mm), 60 (0.251 mm), 100 (0.152 mm) and 200 (0.075 mm) mesh. The fraction between 100 and 200 mesh was collected and washed at first with hot distilled water at 60e70 C for 1 h to eliminate the residual sugars and then washed with 95% EtOH and dried at 90 C in an oven. Finally, this fraction was washed in a Soxhlet apparatus with hexane-ethanol (1:1, v:v) for 4 h and then dried at 90C in an oven to remove the organic solvents and stored in a desiccator prior to use.
2.3. Preparation of SCB 2
SCB 2 was prepared and characterized according to the meth-odology described byGurgel et al. (2008). Sugarcane bagasse (5 g), succinic anhydride (15 g), and anhydrous pyridine (50 mL) were added to a round-bottomflask equipped with a reflux condenser. The mixture was heated under pyridine reflux for 24 h. At the end of the succinylation reaction, modified bagasse was separated by filtration using a sintered glass funnel (porosity 3), washed with a solution of acetic acid in methylene chloride (1 mol/L), ethanol (95%), distilled water, saturated sodium bicarbonate solution, distilled water, andfinally with acetone. SCB 2 was dried in an oven at 90C for 1 h.
2.4. Preparation of EB
EDTA dianhydride was prepared using the methodology described byKarnitz et al. (2009)using EDTA disodium salt and acetic anhydride. EDTA disodium (50.0 g) was dissolved in a 1000 mL beaker containing 500 mL of distilled water. Concentrated HCl was added drop by drop until the precipitation of H4EDTA
occurred. The precipitate was vacuumfiltered and rinsed in 95% EtOH, diethyl ether and subsequently dried in an oven for 2 h at 105C and cooled in a desiccator prior to use. For the preparation of EDTA dianhydride, 18.0 g of H4EDTA was suspended in 31 mL of
The functionalization of sugarcane bagasse with EDTA dianhy-dride was performed according to the method described byKarnitz et al. (2009). Sugarcane bagasse (B) (1 g) and EDTA dianhydride (3 g) were added to a 250 mL round-bottomflask with 42 mL of anhydrous DMF. The suspension was heated at 75 C and soft stirred for 24 h. At the end of the reaction, the suspension was vacuum filtered using a sintered glass funnel (porosity 3) and rinsed in DMF, distilled water, saturated solution of sodium bicar-bonate, distilled water, andfinally with 95% EtOH. After that, the modified sugarcane bagasse (EB) was dried in an oven at 100C for 1 h and stored in a desiccator prior to use.
2.5. Characterization of the SCB 2 and EB
2.5.1. Weight percent gain (wpg)
The weight percent gain (wpg) was calculated according to Eq.
(1):
wpg;% ¼
w
mod wunmod
wunmod
100 (1)
wherewmodis the weight of modified bagasse andwunmodis the
weight of unmodified bagasse.
2.5.2. Number of free carboxylic acid groups (nCOOH)
The number of free carboxylic acid groups (nCOOH) in SCB 2 (in acid form) was determined by acid-base back titration of the car-boxylic acid functions released after the succinylation reaction of B (Karnitz et al., 2007). The number of free carboxylic functionsper
gram of adsorbent material was calculated using Eq.(2)as follows.
nCOOH;mmol=g ¼ C
NaOHVNaOH 4CHClVHCl
mads
100 (2)
whereCNaOH(mmol/L) is the concentration of the NaOH solution,
CHCl(mmol/L) is the concentration of the HCl solution,VNaOH(L) is
the volume of the NaOH solution,VHCl(L) is the volume of HCl spent
in the titration of excessive non-reacted NaOH, andmads(g) is the
weight of adsorbent material.
2.5.3. FTIR analysis
The samples were prepared by mixing 1 mg of each material with 100 mg of spectroscopy grade KBr. The FTIR spectra were recorded using Nicolet Impact 410 equipment with the detector at a resolution of 4 cm 1 from 400 to 4000 cm 1 and 32 scans per
sample.
2.5.4. Elemental analysis
The adsorbent materials were previously washed with acetone and dried at 90C for 1 h before analysis. The elemental analyses were accomplished using a Perkin Elmer Series II CHNS/O Model 2400 analyzer.
2.5.5. Determination of the point of zero charge (pHPZC)
The pH of the point of zero charge (pHPZC) of SCB 2 and EB were determined using the mass titration (MT) method described by Noh and Schwarz (Noh and Schwarz, 1990). Sodium nitrate (NaNO3)
solutions with pH values of 3, 6, and 9 were prepared using 0.1 mol/ L HNO3and 0.1 mol/L NaOH. From each solution of pH 3, 6, and 9,
six aliquots of 20 mL were taken and transferred to 50 mL Erlen-meyerflasks. Then, different amounts of SCB 2 and EB were added to Erlenmeyerflasks to give suspensions of 0.05, 0.1, 0.5, 1.5, and 10%. The equilibrium pH was measured using a pH meter after 4 h of shaking at 25C.
2.5.6. BET surface area and pore size
The experiments to obtain the surface area, volume and width of the micropores of SCB 2 and EB were carried out using a NOVAÒ
Surface Area Analyzer model 1000 (Quantachrome Instruments).
2.5.7. Scanning electron microscopy (SEM)
The morphology of the SCB 2 and EB adsorbents before and after adsorption of etherdiamine (Flotigam 2835) was examined with a Vega3 SB (Tescan/Oxford Instruments) scanning electron micro-scope, using afilament voltage of 20 keV. The samples of SCB 2 and EB containing etherdiamine adsorbed were dried in an oven at 45C for 8 h in order to avoid the degradation of etherdiamine. Dry powder samples were dispersed on a graphite ribbonfixed on an aluminum sample holder. The powders were sputter-coated with gold in a modular high-vacuum coating system Q150R ES (Quorum Technologies).
2.6. Characterization of etherdiamine
The structural characterization of etherdiamine was performed using an electrospray ionization mass spectrometer (model IT-TOF, Shimadzu, Tokyo, Japan) with two analyzers in tandem: ion trap (IT) and time-of-flight (TOF). The mass spectrometer operating at high resolution and mass accuracy (<5 ppm) was optimized under the following conditions: ESI voltage at þ4.5 kV (positive ion mode); nebulizer gas (nitrogen) flow rate at 1.5 L/min; curved desorption line (CDL) interface temperature at 200C; drying gas (nitrogen) pressure at 100 kPa; octapole ion accumulation time of 10 ms. Mass spectra were obtained in the full scan mode within an
m/zrange from 100 to 1000.
2.7. Adsorption experiments
The adsorbent materials SCB 2 and EB were used for etherdi-amine (Flotigam 2835) adsorption in aqueous solutions in batch adsorption mode. All the adsorption experiments were performed at 25C. The adsorption data were modeled by several kinetic and isotherm models.
2.7.1. Kinetic study of adsorption of etherdiamine onto SCB 2 and EB
Samples of 25.0 mg of SCB 2 or EB were weighed and added to 250 mL Erlenmeyerflasks containing 50.0 mL of etherdiamine so-lution of a known concentration (450.0 mg/L) (pH 8). After the contact of the adsorbent with etherdiamine solution the pH of the suspensions was measured during the experiment and no signifi -cant changes in pH were noticed. The Erlenmeyer flasks were shaken at a constant speed (150 rpm) at 25C for different time intervals (10, 20, 30, 45, 60, 90, 120, 150, and 200 min). At the end of each experiment, the sample was subjected to centrifugation (ExcelsaÒII centrifuge, Model 206 BL) at 3600 rpm for 20 min to
separate the solid and liquid phases. The residual concentration of etherdiamine in the supernatant phase was determined by chem-ical oxygen demand (COD) (Clesceri et al., 1995). This procedure was based on the same reaction used for determination of COD. Such procedure consists in the oxidation of organic compounds with K2Cr2O7in sulfuric acid medium at high temperature (148C)
using Ag2SO4as a catalyst. The concentration of etherdiamine is
The amount of etherdiamine adsorbed on SCB 2 or EB in each period of time was calculated using Eq.(3).
qt;mg=g ¼ ðCi CtÞV
wads (3)
where qt (mg/g) is the amount of etherdiamine adsorbed per weight of SCB 2 or EB at a timet,V(L) is the volume of the ether-diamine solution,Ci(mg/L) is the initial concentration of etherdi-amine,Ct(mg/L) is the concentration of etherdiamine at timet, and
wads(g) is the weight of the adsorbent material.
2.7.2. Adsorption as a function of pH
In order to evaluate the effect of pH on the adsorption of etherdiamine on modified adsorbents, samples of 25.0 mg of SCB 2 or EB were weighed and added to 250 mL Erlenmeyerflasks con-taining 50.0 mL of etherdiamine solution of a known concentration (450.0 mg/L). The pH of the suspensions was adjusted to values between 2 and 10 by adding few drops of aqueous HCl and NaOH solutions (0.01e0.1 mol/L). The pH of the suspensions was measured during the experiment and no significant changes in pH were noticed. If small changes in pH occurred they were immedi-ately corrected. The Erlenmeyerflaks were shaken at a constant speed (150 rpm) until the equilibrium time was reached (180 min). After shaking, the samples were subjected to centrifugation at 3600 rpm for 20 min to separate the solid and liquid phases. The final concentration of the etherdiamine solution in the supernatant was determined by COD (see Section2.7.1). The amount of ether-diamine adsorbed on SCB 2 or EB at each pH was calculated ac-cording to Eq.(3).
2.7.3. Adsorption isotherms
Adsorption experiments as a function of the initial concentra-tion of etherdiamine on SCB 2 or EB were performed to determine the adsorption isotherms. Samples of SCB 2 or EB (25.0 mg) were weighed and added to 250 mL Erlenmeyer flasks containing 50.0 mL of etherdiamine solution of a known concentration in the range of 250e650 mg/L. The experiments were performed at pH 10 during the time required to reach equilibrium (180 min). The Erlenmeyerflaks were also shaken at a constant speed (150 rpm). The pH was adjusted to the optimum value for adsorption by adding few drops of aqueous HCl and NaOH solutions ranging from 0.01 to 0.1 mol/L. The pH of the suspensions was measured during the experiment and no significant changes in pH were noticed. If small changes in pH occurred they were immediately corrected. The etherdiamine concentration was determined as described in the Section2.7.1. The amount of etherdiamine adsorbed on SCB 2 or EB was calculated according to Eq.(3).
2.8. Extraction process of etherdiamine
SCB 2 and EB containing adsorbed etherdiamine were recovered by a singlefiltration after adsorption experiments. These materials were used to evaluate the extraction process in order to recovery both etherdiamine and adsorbent materials. For this, the materials were separately treated three times with chloroform as the extrac-tion solvent for 15 min and then the organic solvent was evaporated using a rotary evaporator. The extracted etherdiamine was weighed and the percentage of extraction was calculated using Eq.(4):
Extraction;% ¼
w extracted
Qmaxwads
100 (4)
whereQmax is the maximum adsorption capacity determined by
the Langmuir isotherm model (mg/g),wads(g) is the weight of the
adsorbent (SCB 2 or EB) containing adsorbed etherdiamine, and
wextractedis the weight of etherdiamine extracted (mg) from SCB 2
or EB.
2.9. Free energy of adsorption
According to Liu (2009), the Gibbs free energy change (
D
G) indicates the degree of spontaneity of an adsorption process.D
Gof adsorption is calculated using Eq.(5):D
G ¼ RTlnKa (5)where Ris the gas constant 8.314 J/K mol, T (K) is the absolute temperature, andKais the thermodynamic equilibrium constant without units.Liu (2009)demonstrated that the relationship be-tween the Langmuir equilibrium constant,KL, and the thermody-namic equilibrium constant,Ka, can be given by Eq.(6):
Ka ¼
K
L
g
e ð1mol=LÞ
(6)
g
eis a function of the ionic strength (Ie) of the solute at adsorption equilibrium and the charge carried by the solute (z) (Debye-Hückel law). According to theLiu (2009)approach for neutral adsorbates or adsorbates with weak charges, Eq.(6)turns into Eq.(7):D
Gz RTln½KL ð1 mol=LÞ ¼ RTlnKL (7) This approach implies that for adsorbates with a weak charge, e.g. organic compounds such as dye molecules, the Langmuir equilibrium constant with units of L/mol can be reasonably used for the determination ofD
G. A detailed reading of Liu’s discussion is strongly recommended by the authors to avoid erroneous use of this approach in the calculation ofD
G.3. Results and discussion
3.1. Preparation and characterization of SCB 2 and EB
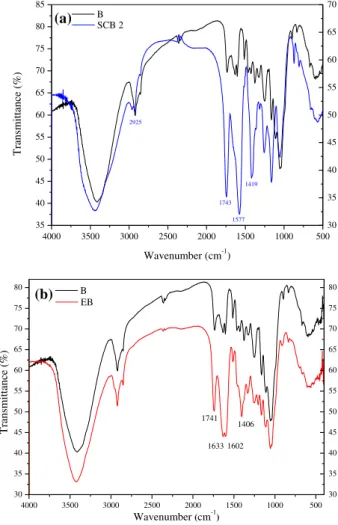
The succinylation reaction of B (Fig. 1a) allowed the introduction of chelating functions to sugarcane bagasse by the esterification of hydroxyl groups with succinic anhydride. The weight gain and number of free carboxylic acid groupspergram of SCB 2 were found to be 80.5% and 6.0 mmol/g, respectively. SCB 2 was also charac-terized by FTIR spectroscopy (Fig. 2). The most important changes that could be noted were the newly arising band at 2925 cm 1, corresponding to asymmetric stretching of CH2due to the
intro-duction of the succinyl group, at 1577 and 1419 cm 1, corre-sponding to asymmetric and symmetric stretching owing to the presence of carboxylate functions (eCOO Naþ), and at 1743 cm 1, corresponding to asymmetric and symmetric stretching of ester groups (eCeOeC]O) owing to the introduction of the succinyl group by esterification.
0.13%) with a significant weight gain, which proves the success of the reaction and the incorporation of amine functions in the modified sugarcane bagasse (EB). The FTIR spectra of bagasse before (B) and after modification with EDTA dianhydride are shown in
Fig. 2. The two major changes noted in the FTIR spectra for EB in comparison with the unmodified starting material (B) were (1) a strong band at 1741 cm 1, corresponding to asymmetric and sym-metric stretching of CeO from ester groups and (2) strong bands at 1633, 1602, and 1406 cm 1, corresponding to asymmetric and symmetric stretching due to presence of the carboxylate ion. The ester and carboxylate bands indicate that EDTAD was introducedvia
the formation of ester linkages with the consequent release of car-boxylic functional groups (Karnitz et al., 2009; Pereira et al., 2010). By modeling the adsorption of gases in the porous materials, it was possible to evaluate various characteristics of porous solids such as surface area, pore volume, and pore width. Obtaining these parameters is important since they are related to the sites available for adsorption.Table 1summarizes the textural properties of SCB 2 and EB before the adsorption experiments. Their BET surface areas were very small in comparison with other adsorbents such as activated carbons, but with large total pore volume values indi-cating that functionalization of the sugarcane bagasse for the pur-poses of chemical adsorption experiments was effective.
The experimental titration curves (Figures not shown) for evaluation of point of zero charge (pHPZC) for SCB 2 and EB converged to pHPZCvalues of 5.3 and 7.5, respectively. Therefore pH values over 5.3 and 7.5 should ensure a predominantly negatively charged surface for SCB 2 and EB, respectively. These results suggest that when the pH of the etherdiamine solution is higher than pHPZC of SCB 2 and EB, these adsorbents have a negatively charged surface that can attract positively charged etherdiamine more efficiently as suggested inFig. 1b. The adsorption of etherdiamine Flotigan 2835 was indeed favored at pH values higher than pHPZCof SCB 2 (5.3) and EB (7.5) as will be discussed in Section3.3.2(seeFig. 4).
3.2. Characterization of etherdiamine
The obtained mass spectra (Supplementary Fig. 1) for etherdi-amine Flotigam 2835 (F 2835) showed peaks withm/zratios of 301 and 315, respectively. According toSupplementary Fig. 1, it was possible to conclude that F 2835 is composed of a mixture of etherdiamines (ReOe(CH2)3eNHe(CH2)3eNH2) with alkyl groups
(R) containing 12 (20%) or 13 (80%) carbon atoms (Araujo et al., 2008).
4000 3500 3000 2500 2000 1500 1000 500 35
40 45 50 55 60 65 70 75 80 85
30 35 40 45 50 55 60 65 70
Transmittance (%)
Wavenumber (cm-1)
B
1419
1577 1743 2925
SCB 2
(a)
4000 3500 3000 2500 2000 1500 1000 500 30
35 40 45 50 55 60 65 70 75 80
1633
Transmittance (%)
Wavenumber(cm-1)
(b)
B1741
1602 1406
30 35 40 45 50 55 60 65 70 75 80
EB
Fig. 2.FTIR spectra of SCB 2 (a) and EB (b).
Table 1
Textural properties of SCB 2 and EB materials.
Material BET surface area (m2g 1)
Total pore volume (cm3g 1)
Average pore diameter (A)
SCB 2 2.7 10.0 155.0
EB 1.5 4.0 108.0
3.3. Adsorption studies
The adsorption properties of SCB 2 and EB were investigated by measuring the amount of adsorbed etherdiamine at different con-tact times, pH values, and etherdiamine initial concentrations.
3.3.1. Effect of contact time
Experiments to investigate the effect of contact time on the adsorption of etherdiamine on SCB2 and EB were carried out to determine the adsorption equilibrium time (te). The effect of con-tact time on the adsorption of etherdiamine on SCB 2 and EB for a known initial etherdiamine concentration (450 mg/L) at a pH equal to 8 at 25C is shown in Fig. 3. As can be seen inFig. 3,t
ewas attained after 90 min for both adsorbent materials.Magriotis et al. (2010) found equilibrium times of 30 min for the adsorption of etheramine Flotigam EDA (Clariant, São Paulo, SP, Brazil) on pink kaolinite.
3.3.2. Effect of pH
One of the most important parameters that directly affect the adsorption of etherdiamine on ionized superficies is the pH. The dependence of etherdiamine uptake on pH is related to thepKaof
functional groups on the surface of the adsorbent material and the protonated forms of the nitrogen species (etherdiamine) in the solution. The adsorption of etherdiamine on SCB 2 and EB as function of pH is shown inFig. 4.
The determination of thepKa of N-alkyl-1,3-diaminopropane with 12 carbon atoms in the aliphatic chain has done byScott and Smith (1991). These authors found values of pKa1 andpKa2
equal to 6.8 and 9.3, respectively. The difference between etherdi-amine Flotigam 2835 (ReOe(CH2)3eNHe(CH2)3eNHþ3) and N
-alkyl-1,3-diaminopropane (CH3e(CH2)11eNHe(CH2)3eNHþ3) is the
presence of an oxygen as a heteroatom in the chemical structure of etherdiamine. However, the oxygen atom is three methylene groups away from the first amine group. At this distance, the electron withdrawing effect of the oxygen atom should not cause any pronounced effect on the basicity of the amine group. There-fore, it is possible to make an analogy between thepKavalues ofN -alkyl-1,3-diaminopropane determined byScott and Smith (1991)
with etherdiamine Flotigam 2835 in order to improve the discussion.
At pH lower than 9.3, at least one amine group is protonated and therefore positively charged and consequently negatively charged supports are able to interact with them. As can be seen inFig. 4, the
adsorption of etherdiamine on both materials increased as the pH increased. By increasing the pH, the carboxylic acid groups from both materials become deprotonated and the adsorption capacity of positively charged etherdiamine is consequently increased. A similar tendency was noted by Magriotis et al. (2010) for the adsorption of etheramine on kaolinites. At lower pH values, the adsorption capacity of SCB 2 decreased following a linear tendency until it reached a very low value. In the case of EB, the adsorption capacity reached a minimum plateau at approximately pH 6. The greater adsorption capacity of EB in relation to SCB 2 at low pH values was attributed to the chemical properties of iminoacetate groups from EDTA (pKavalues of 0.0, 1.5, 2.0, and 2.69) (Dean and Lange, 1999), which have lower pKavalues than succinyl groups (pKavalues of 3.5 and 4.5) (Dean and Lange, 1999). The lowpKa
values of the iminoacetate groups make it possible for EB to adsorb protonated etherdiamine at low pH values, which gives the EB adsorbent material special adsorption properties.Fig. 1b shows the suggested mechanism for etherdiamine adsorption on SCB 2 and EB. Based on the results for the adsorption of etherdiamine on SCB 2 and EB as a function of pH, a pH value of 10.0 was selected for both adsorbent materials to perform adsorption studies as a function of the initial etherdiamine concentration and to build the adsorption isotherms.
3.4. Adsorption isotherms
The adsorption isotherms of SCB 2 and EB were obtained by using etherdiamine in a concentration range of 250.0e650.0 mg/L. The equilibrium time and pH value used in these studies were 180 min and 10, respectively.
Various isotherm models are available in the literature. Four of the most widely used isotherms were chosen to evaluate the equilibrium adsorption data: the Langmuir (1918), Freundlich (1906), Langmuir-Freundlich (Sips) (Do, 1998), and Temkin and Pyzhev (1940)isotherms.
Eq.(8)is the general form of the Langmuir equation and Eq.(9)
is a linearized and rearranged form of the general form of Eq.(8)
(Ho et al., 2005).
qe ¼ Q1maxbCe
þbCe (8)
Ce
qe ¼
1
Qmaxbþ
Ce
Qmax
(9)
0 20 40 60 80 100 120 140 160 180 200 220 100
125 150 175 200 225 250 275 300 325 350 375 400 425 450 475 500 525 550
SCB 2 EB
Pseudo-first-order model Pseudo-second-order model qt
(mg/
g)
Time (min)
Fig. 3.Effect of contact time on the adsorption of etherdiamine on SCB 2 and EB.
1 2 3 4 5 6 7 8 9 10 11
0 50 100 150 200 250 300 350 400 450 500 550 600 650 700
SCB 2 EB qe
(mg/
g)
pH
whereqe(mg/g) is the equilibrium adsorption capacity,Qmax(mg/g)
is the maximum adsorption capacity of etherdiamine per unit weight of SCB 2 or EB to form complete monolayer coverage on the surface bound at a high equilibrium etherdiamine concentrationCe (mg/L), andb(L/mg) is the Langmuir constant related to the affinity of binding sites.Qmaxrepresents the practical limiting adsorption
capacity when the surface is fully covered with etherdiamine. Linearized plots ofCe/qeversusCewere obtained from the model and are shown inFig. 5.Qmaxandbwere computed from the slopes
and intercepts of the straight lines. Table 2 lists the calculated results.
One of the essential characteristics of the Langmuir isotherm can be expressed by a separation factor,RL; which is defined using Eq.(10):
RL ¼
1 1þbCi
(10)
whereCiis the initial concentration of the etherdiamine (mg/L). The value ofRLindicates whether an isotherm is irreversible (RL¼0), favorable (0<RL<1), linear (RL¼1), or unfavorable (RL>1). The calculated values ofRLfor SCB 2 and EB are shown inTable 2. These
RL values showed that the adsorption of etherdiamine on both materials was favorable.
The general form of the Freundlich equation can be expressed by Eq.(11). Eq.(12)is the linearized form of Eq.(11):
qe ¼ KC
1. n
e (11)
lnqe ¼ lnKþ1nlnCe (12)
whereK(mg/g (L/mg)1/n) andnare the Freundlich constants. The term 1/nindicates the intensity of adsorption; in other words, the effectiveness of adsorption. Thus, when 1/n is less than unity, adsorption is favorable. Values ofKandnare calculated from the intercepts and slopes of the plots of lnqeversus lnCeand are also listed inTable 2.
The Temkin isotherm is generally used in the linearized and rearranged form of Eq.(13), as shown in Eq.(14):
qe ¼ BlnACe (13)
qe ¼ BlnAþBlnCe (14)
whereAis the equilibrium constant of binding corresponding to the maximum energy of binding (mg/L) and the constantBis related to the heat of adsorption (L/mg). A plot ofqeversus lnCeenables the determination of the isotherm constantsAandB. The values ofA
andBobtained in this study are shown inTable 2.
The non-linear form of Langmuir-Freundlich isotherm (Sips isotherm) can be written as Eq.(15):
0 50 100 150 200 250 300 350 400 450 500 0.05
0.10 0.15 0.20 0.25 0.30 0.35 0.40 0.45 0.50
SCB 2 EB
Langmuir model Ce
/qe
(g/
L
)
C e (mg/L)
3.00 3.25 3.50 3.75 4.00 4.25 4.50 4.75 5.00 5.25 5.50 5.75 6.00 6.25 6.50 5.6
5.7 5.8 5.9 6.0 6.1 6.2 6.3 6.4 6.5 6.6 6.7 6.8 6.9
SCB 2 EB
Freundlich model
ln
qe
ln C e
3.00 3.25 3.50 3.75 4.00 4.25 4.50 4.75 5.00 5.25 5.50 5.75 6.00 6.25 6.50 250
300 350 400 450 500 550 600 650 700 750 800 850 900 950
SCB 2 EB
Tempkin and Pyzhev model qe
(mg/
g)
ln C e
3.50 3.75 4.00 4.25 4.50 4.75 5.00 5.25 5.50 5.75 6.00 6.25 -1.50
-1.25 -1.00 -0.75 -0.50 -0.25 0.00 0.25 0.50 0.75 1.00 1.25 1.50 1.75 2.00 2.25 2.50
SCB 2 EB
Langmuir-Freundlich (Sips) model
ln
[
qe
/(
Qmax
- q
e
)]
ln C e
qe ¼ Qmax ðbCeÞ 1
.
n
1þ ðbCeÞ 1
.
n
(15)
Eq.(15)can be rearranged and written as follows in linearized form as Eq.(16):
ln
q
e
Qmax qe
¼ 1
nlnCeþ
1
nlnb (16)
whereQmaxis the total number of binding sites (mg/g),bis a Sips
constant related to the energy of adsorption (L/mg), andnis the heterogeneity factor. If the parameter n is unity, the Langmuir equation is applicable for ideal surfaces. Hence, the parametern
could be regarded as the parameter characterizing system hetero-geneity. System heterogeneity could stem from the adsorbent or the adsorbate or a combination of both. The parameternis usually greater than unity, and larger value for this parameter indicates a more heterogeneous system. A plot of ln[(qe/(Qmax qe)] versus ln
Ceyields bandn from the intercept and slope, respectively. The value ofQmaxused in the plot of ln[(qe/(Qmax qe)] versus lnCecan be obtained from the Langmuir model. The values ofQmax,b, andn
obtained in this study are shown inTable 2.
The results for each model are presented in Table 2. The determination coefficients, R2, were used to compare the four isotherm models. As can be seen fromTable 2, the Langmuir model showed a higher determination coefficient than the Freundlich, Sips, and Temkin models. The Langmuir-Freundlich (Sips) model revealed, through n values, that the system composed of etherdiamine-EB was less heterogeneous than etherdiamine-SCB 2. Furthermore, thenvalues from the Sips model also suggested that the Langmuir model can describe the adsorption of etherdi-amine on SCB 2 and EB very well. Similar results were reported by
Magriotis et al. (2010)for the adsorption of etheramine on kao-linites. TheQmaxof SCB 2 and EB for etherdiamine adsorption using
the Langmuir model were found to be 869.6 and 1203.5 mg/g, respectively. These results are much higher in comparison with
Qmaxfor other adsorbents reported in the literature. For example,
the study of adsorption of etheramine Flotigam EDA on kaolinite carried out byMagriotis et al. (2010) revealed Qmax values
ob-tained by the Langmuir model of 33.03, 34.32, and 23.11 mg/g for white, pink, and yellow kaolinites, respectively. Safa and Bhatti (2011) also studied the adsorption of etheramine Flotigam EDA on kaolinite subjected to acid, thermal, and peroxide treatments and foundQmaxvalues obtained by the Langmuir model of 27, 29,
and 59 mg/g, respectively. In addition, the higher adsorption ca-pacity for EB in relation to SCB 2 may be attributed to the presence of amine groups in the EDTA moiety that can probably interact with the amine groups of etherdiamine via the formation of hydrogen bonds. The suggested mechanism of interaction of partially protonated etherdiamine with SCB 2 and EB is shown in
Fig. 1b. The calculated free energy (Table 2) for the adsorption of etherdiamine on SCB 2 ( 22.70 kJ/mol) and EB ( 19.10 kJ/mol)
suggests that chemisorption is the main mechanism whereby etherdiamine is removed from the aqueous solution for both adsorbents.
3.5. Adsorption kinetics
Kinetic models were used to determine the rate of the adsorp-tion process and how this rate controls the equilibrium time. The adsorption of a solute by a solid support in aqueous solution is a phenomenon with often complex kinetics. The mechanism of adsorption depends on the physical and/or chemical characteristics of the adsorbent as well as on the mass-transport process. In order to investigate the mechanism of etherdiamine adsorption on SCB 2 and EB, three kinetic models were investigated: pseudo-first-order, pseudo-second-order, and Elovich.
The pseudo-first-order kinetic model ofLagergren (1898)shown in Eq.(17)is more suitable for lower concentrations of the solute. Its linear form is shown in Eq.(18):
qt ¼ qe
1 exp k1t (17)
logðqe qtÞ ¼ logqe 2:303k1 t (18)
where qt (mg/g) is the amount of adsorbate adsorbed at time t (min), qe (mg/g) is the equilibrium adsorption capacity, and k1
(min 1) is the pseudo-first-order rate constant.
The values ofk1andqefor the adsorption of etherdiamine on SCB 2 and EB were determined from the plot of log (qe qt) versust. The obtained straight line yieldsk1as the slope and lnqeas the intercept.
The pseudo-second-order model ofHo and McKay (1998)based on adsorption capacity can be represented as Eq.(19)and in the linear form in Eq.(20):
qt ¼ k2q
2 et
1þk2qet (19)
t
qt ¼
1
k2q2e
þ 1
qet (20)
whereqe(mg/g) andqt(mg/g) are the solute amounts adsorbedper unit weight of the adsorbent at equilibrium time and at timet(min) andk2is the pseudo-second-order rate constant (g mg 1min 1).
The parameters from the pseudo-second-order model,k2andqe, can be obtained from the slope and intercept of the plot oft/qt versust(Fig. 6).
The Elovich model suggests that chemisorption, i.e. a chemical reaction, is probably the mechanism that controls the rate of adsorption (Crini and Badot, 2008). This model can be applied with success in liquid solution. The linear form of the Elovich equation is shown in Eq.(21):
Table 2
Isotherm parameters for the adsorption of etherdiamine on SCB 2 and EB obtained from linearized models.
Langmuir Freundlich Temkin Langmuir-Freundlich (Sips)
SCB 2 EB SCB 2 EB SCB 2 EB SCB 2 EB
Qmax(mg/g) 869.6 1203.5 K(mg/g (L/mg)1/n) 156.5 57.0 A(mg/L) 0.37 0.065 Qmax(mg/g) 869.6 1203.5
b(L/mg) 0.030 0.007 n 3.34 2.12 B(L/mg) 175.94 272.63 b(L/mg) 0.018 0.009
R2 0.9951 0.9919 R2 0.8849 0.9158 R2 0.9085 0.9757 n 0.94 1.02
RL 0.448e0.107 0.768e0.247 e e e e e e R2 0.9224 0.9788
DGo(kJ/mol)a 22.70 19.10
e e e e e e e e e
qt ¼ 1
b
lnab
þ1
b
lnt (21)where
a
(mg/g min) is the initial sorption rate andb
(g/mg) is the desorption constant.The values of
a
andb
can be calculated from the slope and intercept of the plot ofqt versus lnt that yields a straight line. Table 3lists the calculated results for the three models.As can be seen inTable 3, the values ofR2are closer to unity for the pseudo-second-order model than the pseudo-first-order model and Elovich model. Thus, the pseudo-second-order model can describe etherdiamine adsorption by both materials very well. Furthermore, values ofqe,cal calculated from the
pseudo-second-order model were in good agreement with the experimental values,qe,exp, compared to those calculated from the pseudo-fi
rst-order model. The adsorption phenomenon followed the pseudo-second-order model during the entire period of adsorption and thus supports the model presupposition that adsorption is controlled by a chemical process, i.e. chemisorption (Crini and Badot, 2008). Similar results were reported for the adsorption of etheramine on kaolinites byMagriotis et al. (2010).
3.6. Extraction process of etherdiamine
The high adsorption capacity values found for SCB 2 and EB exemplify the great potential of these adsorbent materials to treat effluents from the flotation of iron ore. Due to the high cost of etherdiamine, the recovery of such important chemical compound is economically important. The percentages of etherdiamine extracted and recovered from SCB 2 and EB were 63% and 65%, respectively. These results revealed that there is the possibility of recycling SCB 2 and EB for subsequent adsorption experiments even though the adsorption capacity is lower than in thefirst cycle of adsorption.
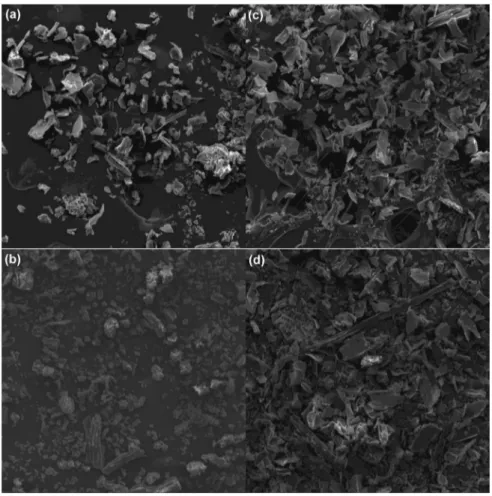
3.7. Scanning electron microscopy
SEM is widely used to study the morphological features and surface characteristics of various adsorbent materials (Namasivayam and Kavitha, 2006). SEM micrographs can also used to assess morphological changes in thefiber surfaces following the adsorption of etherdiamine (Flotigam 2835) on SCB 2 and EB adsorbents.
3.7.1. Morphology of unloaded adsorbents
Fig. 7a and b shows SEM micrographs of SCB 2 and EB adsor-bents before adsorption of etherdiamine at 300 times of magnifi -cation, respectively. The adsorbents have a great variety of shapes and sizes, characterizing the great heterogeneity of the sugarcane bagasse after the milling process. Supplementary Fig. 3a and b
shows micrographs of SCB 2 and EB adsorbents with magnifi ca-tion of 2000 times. In these micrographs is possible to see that both adsorbentfibers present pores and cracks on their surfaces.
3.7.2. Morphology of loaded adsorbents
Fig. 7c and d shows SEM micrographs of SCB 2 and EB adsor-bents after adsorption of etherdiamine at 300 times of magnifi ca-tion, respectively. The morphology of the loaded adsorbents showed some important observations. The surface coverage of the adsorbents due to adsorption of etherdiamine molecules led to the formation of a monolayer of etherdiamine molecules over the surface of SCB 2 and EB. SEM micrographs of SCB 2 and EB surfaces covered with etherdiamine were found to be smooth in relation to unloaded adsorbent materials due to formation of a layer (molec-ular cloud) of uniform thickness (Safa and Bhatti, 2011) (seeFig. 7). Other differences in morphology can also be examined in
supplementary Fig. 3c and dthat shows micrographs of SCB 2 and EB adsorbents after adsorption with magnification of 2000 times.
3.8. Advantages and disadvantages of the proposed method
Etherdiamine is an expensive chemical of great importance in iron oreflotation and concentration processes. It is estimated that approximately 6000 tons of fatty amines derivatives are used annually in Brazil for iron ore flotation processes (Rocha et al., 2013). According to Rocha et al. (2013), the Samarco company mining plant uses about 1500 tons of etherdiamine peryear in order to produce 16 million tons of concentrateperyear, repre-senting close to 50% of the overall costs in 2006 (Rocha et al., 2013). Therefore, a process for the recovery and reuse of the etherdiamine is strongly desired. Biodegradation of fatty amines as an alternative process to eliminate these compounds from the effluent once they become very toxic was proposed by Araujo et al. (2010). This method has great advantages for eliminating the problem of toxicity of fatty amines through their degradation to non-toxic compounds. However, the drawback in this case is the fact that once the amines are degraded, there arises the need for addition of more fatty amines to the flotation process, which increases the overall costs. The method proposed in this study avoids this limi-tation by removing large amounts of etherdiamine and further-more the etherdiamine adsorbed on SCB 2 and EB can be extracted, recovered, and reused in the flotation process. The major 0 20 40 60 80 100 120 140 160 180 200 220 240
0.00 0.05 0.10 0.15 0.20 0.25 0.30 0.35 0.40 0.45 0.50 0.55 0.60 0.65 0.70
SCB 2 EB
Pseudo-second-order model
t/q
t
(min.g
.mg
-1 )
Time (min)
Fig. 6.Linearized pseudo-second-order kinetic plot for the adsorption of etherdiamine on SCB 2 and EB.
Table 3
Kinetic parameters for the adsorption of etherdiamine on SCB 2 and EB.
SCB 2 EB
qe.exp(mg/g) 509.47 qe.exp(mg/g) 320.90 Pseudo-first-order
k1(min1) 0.026 0.031
qe,calc(mg/g) 66.35 281.16
R2 0.8405 0.8991
Pseudo-second-order
k2(g/mg min) 0.00086 0.00017
qe,calc(mg/g) 515.46 348.43
R2 0.9998 0.9966
Elovich equation
a(mg/g min) 8.42106 90.11
b(g/mg) 0.034 0.017
disadvantage of the proposed method is that only 63e65% of etherdiamine can extracted and recovered from SCB 2 and EB, respectively.
4. Conclusion
The materials modified with succinic anhydride (SCB 2) and EDTA dianhydride (EB), prepared from sugarcane bagasse, an important agricultural waste, were shown to be very efficient in removing, by adsorption, etherdiamine Flotigam 2835, used in the reverseflotation of iron ore from aqueous solutions. The adsorption of etherdiamine attained equilibrium after 90 min and it was favored at pH 10.0. The results of equilibrium adsorption were evaluated by four adsorption models and the experimental data fitted very well to the Langmuir model.Qmaxof SCB 2 and EB for
etherdiamine adsorption using the Langmuir model were found to be 869.6 and 1203.5 mg/g, respectively. TheseQmaxvalues are much
higher in comparison with other results reported in the literature. Three kinetic models were used to model the kinetics of adsorption. The adsorption process was well-described by the pseudo-second-order model. Extraction process showed that the percentages of etherdiamine recovered from SCB 2 and EB were 63% and 65%, respectively.
Acknowledgments
The authors are grateful to Universidade Federal de Ouro Preto (UFOP), FAPEMIG, CNPq and CAPES for funding this research. Au-thors would also like to thank Dr. Jason G. Taylor (UFOP) for reviewing the manuscript for its English usage. The authors are also
grateful to Laboratório de Microscopia Eletrônica, microanálises e caracterização de materiais (NanoLab/FINEPeRedemat, Escola de Minas, UFOP) and B.S. Ney P. Sampaio for SEM analyses.
Appendix A. Supplementary data
Supplementary data related to this article can be found athttp:// dx.doi.org/10.1016/j.jenvman.2013.11.040.
References
Alves, F., 2006. Minério de ferro. Rev. Brasil Miner. 255, 14e20.
Araujo, A.C., Viana, P.R.M., Peres, A.E.C., 2005. Reagents in iron oresflotation. Miner. Eng. 18, 219e224.
Araujo, D.M., Yoshida, M.I., Carvalho, C.F., Stapelfeldt, F., 2008. Recycling of amines present in the residues from the reverseflotation of iron ore. Rem.-Rev. Esc. Minas. 61, 455e460.
Araujo, D.M., Yoshida, M.I., Takahashi, J.A., Carvalho, C.F., Stapelfeldt, F., 2010. Biodegradation studies on fatty amines used for reverseflotation of iron ore. Int. Biodeterior. Biodegrad. 64, 151e155.
Caraschi, J.C., Filho, S.P.C., Curvelo, A.A.S., 1996. Preparação e caracterização de polpas para dissolução obtidas a partir de bagaço de cana-de-açúcar. Polímer. Ciênc. Tecnol. 6, 24e29.
Clesceri, L.S., Eaton, A.D., Greenberg, A.E., Franson, M.A.H., Association, A.P.H., Association, A.W.W., Federation, W.E., 1995. Standard Methods for the Exami-nation of Water and Wastewater, nineteenth ed. American Public Health As-sociation, Washington.
CONAB, 2011. Companhia Nacional de Abastecimento. Avaliação da safra agrícola brasileira de cana-de-açúcar. Safra 2011/2012, terceiro levantamento, Dezembro (in Portuguese).
Crini, G., 2006. Non-conventional low-cost adsorbents for dye removal: a review. Bioresour. Technol. 97, 1061e1085.
Crini, G., Badot, P.M., 2008. Application of chitosan, a natural aminopolysaccharide, for dye removal from aqueous solutions by adsorption processes using batch studies: a review of recent literature. Prog. Polym. Sci. 33, 399e447. Dean, J.A., Lange, N.A., 1999. Handbook of Chemistry. McGraw-Hill.
Do, D., 1998. Adsorption Analysis: Equilibria and Kinetics. Imperial College Press. Filippov, L.O., Filippova, I.V., Severov, V.V., 2010. The use of collectors mixture in the
reverse cationicflotation of magnetite ore: the role of Fe-bearing silicates. Miner. Eng. 23, 91e98.
Freundlich, H.M.F., 1906. Over the adsorption in solution. Z. Physikal. Chem. 57A, 385e470.
Gupta, V.K., Suhas, 2009. Application of low-cost adsorbents for dye removalea review. J. Environ. Manage. 90, 2313e2342.
Gurgel, L.V.A., de Freitas, R.P., Gil, L.F., 2008. Adsorption of Cu(II), Cd(II), and Pb(II) from aqueous single metal solutions by sugarcane bagasse and mercerized sugarcane bagasse chemically modified with succinic anhydride. Carbohyd. Polym. 74, 922e929.
Gurgel, L.V.A., Gil, L.F., 2009. Adsorption of Cu(II), Cd(II) and Pb(II) from aqueous single metal solutions by succinylated twice-mercerized sugarcane bagasse functionalized with triethylenetetramine. Water Res. 43, 4479e4488. Gusmao, K.A.G., Gurgel, L.V.A., Melo, T.M.S., Gil, L.F., 2012. Application of
succiny-lated sugarcane bagasse as adsorbent to remove methylene blue and gentian violet from aqueous solutionsekinetic and equilibrium studies. Dyes Pigm. 92, 967e974.
Ho, Y.S., Chiu, W.T., Wang, C.C., 2005. Regression analysis for the sorption isotherms of basic dyes on sugarcane dust. Bioresour. Technol. 96, 1285e1291. Ho, Y.S., McKay, G., 1998. Kinetic models for the sorption of dye from aqueous
so-lution by wood. Process. Saf. Environ. 76, 183e191.
Karnitz, O., Gurgel, L.V.A., de Freitas, R.P., Gil, L.F., 2009. Adsorption of Cu(II), Cd(II), and Pb(II) from aqueous single metal solutions by mercerized cellulose and mercerized sugarcane bagasse chemically modified with EDTA dianhydride (EDTAD). Carbohyd. Polym. 77, 643e650.
Karnitz, O., Gurgel, L.V.A., de Melo, J.C.P., Botaro, V.R., Melo, T.M.S., Gil, R.P.D.F., Gil, L.F., 2007. Adsorption of heavy metal ion from aqueous single metal solution by chemically modified sugarcane bagasse. Bioresour. Technol. 98, 1291e1297.
Karnitz, O., Gurgel, L.V.A., Gil, L.F., 2010. Removal of Ca(II) and Mg(II) from aqueous single metal solutions by mercerized cellulose and mercerized sugarcane bagasse grafted with EDTA dianhydride (EDTAD). Carbohydr. Polym. 79, 184e 191.
Kumar, U., 2006. Agricultural products and by-products as a low cost adsorbent for heavy metal removal from water and wastewater: a review. Sci. Res. Essays 1, 33e37.
Lagergren, S., 1898. Zur Theorie der sogenannten adsorption gelöster stoffe. K. Svenska Vetenskapsakad. Handl. 24, 1e39.
Langmuir, I., 1918. The adsorption of gases on plane surfaces of glass, mica and platinum. J. Am. Chem. Soc. 40, 1361e1403.
Leja, J., 1982. Surface Chemistry of Froth Flotation, second ed. Plenum Press, New York.
Lima, R.M.F., Brandao, P.R.G., Peres, A.E.C., 2005. The infrared spectra of amine collectors used in theflotation of iron ores. Miner. Eng. 18, 267e273. Liu, Y., 2009. Is the free energy change of adsorption correctly calculated? J. Chem.
Eng. Data. 54, 1981e1985.
Magriotis, Z.M., Leal, P.V.B., Sales, P.F., Papini, R.M., Viana, P.R.M., 2010. Adsorption of etheramine on kaolinite: a cheap alternative for the treatment of mining
ef-fluents. J. Hazard. Mater. 184, 465e471.
Namasivayam, C., Kavitha, D., 2006. IR, XRD and SEM studies on the mechanism of adsorption of dyes and phenols by coir pith carbon from aqueous phase. Microchem. J. 82, 43e48.
Navarro, R.R., Sumi, K., Fujii, N., Matsumura, M., 1996. Mercury removal from wastewater using porous cellulose carrier modified with polyethyleneimine. Water Res. 30, 2488e2494.
Ngah, W.S.W., Hanafiah, M.A.K.M., 2008. Removal of heavy metal ions from wastewater by chemically modified plant wastes as adsorbents: a review. Bioresour. Technol. 99, 3935e3948.
Noh, J.S., Schwarz, J.A., 1990. Effect of HNO3treatment on the surface-acidity of activated carbons. Carbon 28, 675e682.
Pearse, M.J., 2005. An overview of the use of chemical reagents in mineral pro-cessing. Miner. Eng. 18, 139e149.
Pereira, F.V., Gurgel, L.V.A., de Aquino, S.F., Gil, L.F., 2009. Removal of Zn2þfrom electroplating wastewater using modified wood sawdust and sugarcane bagasse. J. Environ. Eng.-ASCE 135, 341e350.
Pereira, F.V., Gurgel, L.V.A., Gil, L.F., 2010. Removal of Zn2þfrom aqueous single metal solutions and electroplating wastewater with wood sawdust and sugar-cane bagasse modified with EDTA dianhydride (EDTAD). J. Hazard. Mater. 176, 856e863.
Rocha, G.M., Silva, V.N., Martín, C., Gonçalves, A., Nascimento, V., Souto-Maior, A., 2013. Effect of xylan and lignin removal by hydrothermal pretreatment on enzymatic conversion of sugarcane bagasse cellulose for second generation ethanol production. Sugar Tech., 1e9.
Safa, Y., Bhatti, H.N., 2011. Kinetic and thermodynamic modeling for the removal of Direct Red-31 and Direct Orange-26 dyes from aqueous solutions by rice husk. Desalination 272, 313e322.
Scott, J.L., Smith, R.W., 1991. Diamineflotation of quartz. Miner. Eng. 4, 141e150. Temkin, M.J., Pyzhev, V., 1940. Kinetics of ammonia synthesis on promoted iron
catalysts. Acta Physiochim. U.R.S.S 12, 217e222.
Teodoro, A.L., Leão, V.A., 2004. Recuperação de aminas, utilizadas naflotação de minério de ferro, utilizando-se zeólitas naturais. Rev. Escola Minas. 57, 197e201. Xiao, B., Sun, X.F., Sun, R.C., 2001. The chemical modification of lignins with succinic
anhydride in aqueous systems. Polym. Degrad. Stabil. 71, 223e231.