CHARACTERIZATION OF PHYSICAL PROPERTIES OF AEROSOLS ATMOSPHERIC ON REGIONS AFFECTED BY BURNING BIOMASS IN BRAZIL
CARACTERIZAÇÃO DAS PROPRIEDADES FÍSICAS DE AEROSSÓIS ATMOSFÉRICOS EM REGIÕES AFETADAS POR QUEIMA DE BIOAMASSA NO BRASIL
Lucas Douglas Rothmund1, Rafael da Silva Palácios1, João Basso Marques1, Lúcio Gonçalves Barbosa Oliveira1, Thiago Rangel Rodrigues2,
Leone Francisco Amorim Curado1, José de Souza Nogueira1 Artigo recebido em: 24/10/2017 e aceito para publicação em: 06/03/2018.
DOI: http://dx.doi.org/10.14295/holos.v18i1.12248
Abstract: This study aimed to characterize the physical properties of aerosols on the north and west-central
Brazil. These regions are strongly impacted by seasonality of physical and chemical properties of aerosols, due mainly to the high levels of biomass burning during the dry season. The analysis was performed on four sites in the network AERONET, two in the Amazon biome and two in the savanna (locally known as Cerrado) in order to verify the possible difference between the properties of aerosols from the burning of forest and pasture in the Brazilian Cerrado. We used data from a u-level 1.5 from January 2000 to July 2015.There was a seasonal variation on the depth perspective of aerosols in the range of 675 nm (AOD 675 nm) on all sites examined, with the peaks reached in the dry season due the great contribution of particles from biomass burning. The values of single scattering albedo in the range of 675 nm (SSA 675 nm) showed little variation, including between wet and dry seasons. It was noted that the values of SSA for the regions located in the Cerrado biome were slightly smaller than the values obtained for the depots located in the Amazon biome. The contributions of particulate matter from biomass burning during the dry season about the Amazon region substantially increase the properties of scattering of radiation in the atmosphere. About Cuiabá and Campo Grande (Cerrado) it was noted that in the wet season there is predominance of urban emissions and dust from the ground and in the dry season particles of biomass burning. However, for the dry season it was verified that the particulate material on these regions is more fuel than the aerosols present in the regions of the Amazon biome.
Keyword: Aerosol optical depth. Single scattering albedo. Matrix of Angstrom.
Resumo: Este estudo teve como objetivo caracterizar as propriedades físicas dos aerossóis no norte e
centro-oeste do Brasil. Estas regiões são fortemente impactadas pela sazonalidade das propriedades físicas e químicas dos aerossóis, devido principalmente aos altos níveis de queima de biomassa durante a estação seca. A análise foi realizada em quatro sites da rede AERONET, dois no bioma amazônico e dois na savana (conhecida localmente como cerrado) para verificar a possível diferença entre as propriedades dos aerossóis da queima de floresta e pastagem no cerrado brasileiro. Foram utilizados dados de nível 1.5 de janeiro de 2000 a julho de 2015. Houve variação sazonal da profundidade ótica de aerossóis na faixa de 675 nm (AOD 675 nm) em todos os locais estudados, com os picos alcançados na estação seca devido à grande 1 Universidade Federal de Mato Grosso (UFMT), Cuiabá, MT. Emails: (lucasdouglasrothmund@gmail.com,
rafael.pgfa@gmail.com, jbassofisico@gmail.com, luciogboliveira@gmail.com, leonecurado@gmail.com,
nogueira@ufmt.br)
2Universidade Federal de Mato Grosso do Sul (UFMS), Campo Grande, MS. Email: (thiagorangel@pgfa.ufmt.br)
contribuição de partículas provenientes da queima de biomassa. Os valores de albedo de espalhamento simples na faixa de 675 nm (SSA 675 nm) mostraram pouca variação, mesmo da mudança da estação chuvosa para seca. Observou-se que os valores de SSA para as regiões localizadas no bioma do cerrado foram ligeiramente menores do que os valores obtidos para os demais sites localizados no bioma amazônico. As contribuições de partículas provenientes da queima de biomassa durante a estação seca sobre a região amazônica aumentam substancialmente as propriedades da dispersão da radiação na atmosfera. Sobre Cuiabá e Campo Grande (cerrado) observou-se que na estação chuvosa há predominância de emissões urbanas e poeira do solo e na estação seca partículas de queima de biomassa. No entanto, para a estação seca verificou-se que o material particulado nessas regiões é mais absorvedor que os aerossóis presentes nas regiões do bioma amazônico.
Palavras-chave: Profundidade ótica do aerossol. Albedo de espalhamento simples. Matrix de Angstrom.
1 INTRODUCTION
The characterization of the properties of atmospheric aerosols at regional scale, especially to near their sources, has proven a valuable tool in atmospheric sciences (GUIRADO et al., 2014), once these results help to reduce uncertainty caused by aerosols in radiative forcing (FOSTER et al., 2007). The spatio-temporal variations of the chemical composition and optical properties of aerosols are unique in the central region of South America (HOELZEMANN et al., 2009). The central region of South America is strongly influenced by varying the chemical composition and therefore the physical properties of aerosols due to the high amount of particles emitted by the burning of biomass, especially during the dry season (ARTAXO et al., 2005). The band formed in the south east of the Amazon, known locally as "arc of deforestation", presents numerous fires records during the dry season, which provides high loads of aerosols in almost all northern and central-western Brazil in August and September (SENA et al., 2013; ARTAXO et al., 2013). This region is constitute by the biomes Amazon and Cerrado (Brazilian savanna), a vegetation composed by a xenomorphic vegetation and distinct climate characterization (IBGE, 2012). The Amazon rainforest has a length of approximately 7 million km2, of which 5.5 km2 are located in Brazil and has about 39 billion tons of carbon (CCAL, 2017; AZEVEDO-RAMOS, 2018). The Cerrado is the second largest biome in South America, with nearly 2 million km2, characterized by typical Cerrado vegetation, forest and trees with twisted branches (RODRIGUES et al., 2014).
Agricultural expansion in the central Brazil began in the mid-twentieth century with the replacement of Amazon forest and native areas of Cerrado by extensive agricultural areas and cattle production (DAVIDSON et al., 2012). Thus, large amounts of aerosols has
been emitted and added to the emissions of biogenic disasters in this region, which has directly affected the radiation flux in the Earth-atmosphere system (PROCOPIO et al., 2004; RIBEIRO et al., 2011; SENA et al., 2013; RIZZO et al., 2013). The occurrence of natural fires in the Cerrado due to prolonged dry period between August and November also causes high emission of aerosols into the atmosphere (SCHAFER et al., 2008). Besides making the area a potential transmitter of aerosols, the conversion of land use influences significantly in the change of energy and mass exchange in the soil-plant-atmosphere system (BATLE-BAYER et al., 2010).
The Amazon deforestation rates after 2015, reached around 6200 km²/year, if compared with previous measures, accomplished a 66% reduction (ARAGÃO et al., 2018). However, there was no reduction in optical depth values of aerosols in the same proportion (SENA et al., 2013). Thus, the objective of this study was to characterize and analyze the aerosol’s physical properties in the north and center-west of Brazil. The performed analysis was conducted with data obtained from AERONET network (HOLBEN et al. 1998) during the wet and dry seasons to identify possible differences between the optical properties of aerosols between the regions directly affected by deforestation ("arc of deforestation").
2 METHODOLOGY
2.1 Study Area
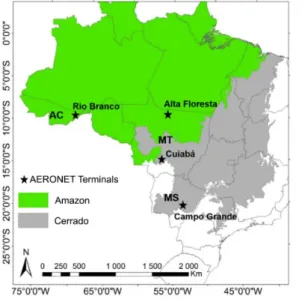
Four AERONET network of sites located in Brazil were addressed in this study, of which two are located in the Amazon and two in the Cerrado. The Alta Floresta and Cuiabá stations are located in the state of Mato Grosso (MT), but in different biomes (Figure 1). Rio Branco station is located in the state of Acre (AC) and the Campo Grande station in Mato Grosso do Sul.
Figure 1 - Location of AERONET network terminals used in this study
2.2 AERONET Inversion Products
The AERONET (AErosol RObotic NETwork) program is a federation of ground-based remote sensing aerosol networks established by NASA and PHOTONS (PHOtométrie pour le Traitement Opérationnel de Normalisation Satellitaire; Univ. of Lille 1, CNES, and CNRS-INSU) and is greatly expanded by networks (e.g., RIMA, AeroSpan, AEROCAN, and CARSNET) and collaborators from national agencies, institutes, universities, individual scientists, and partners. The AERONET provides globally observations of the spectral distribution of the aerosols, such as aerosols optical depth (AOD) and inversion for several schemes of data (HOLBEN et al., 1998). The level 1.0 data represent raw data measured directly by radiometers network. The level 1.5 are preprocessed data without possible contamination by clouds and level 2.0 data is calibrated and have an own network quality certificate (HOLBEN et al., 1998).
Spectral measurements are made by a spectral radiometer (Electronic CIMEL 318A) which is electrically powered by a system of solar panels. The sensor is aligned systematically to the sun according to a pre-programmed pattern and its measurements are transmitted via satellite. The radiometer performs a directly from the sun and other sky on direct measurements of the eight spectral bands every 10 seconds.
The optical depth is calculated from the extinction of the spectral beam of each wavelength based on the Beer-Bouguer law. The product also provides the sky radiation
spectra of four spectral bands (440, 670, 870 and 1020 nm), which allow to estimate the size distribution and the single scattering albedo (SSA) (HOLBEN et al., 1998, DUBOVIK et al., 2002). In this study, we used the u-level 1.5 data, since the amount of level 2,0 data of some study areas was very low, which has failed to generate statistically significant results. Products used in this study were: AOD 675 nm, 675 nm SSA, Angstrom 440-870 nm scattering, Angstrom 440-870 nm absorption and size distribution of the particulate material from January 2000 to July 2015.
A qualitative analysis of the aerosol properties in the dry and wet seasons was the performed for the account of drought and precipitation extremes. According to the properties of pollutants from aerosols, the wet season occurs from January to June and the dry season from July to December (ARTAXO et al., 2013). However, the wet season in this study was considered from February to May and the dry season from August to October in order to assess the impacts caused mainly due to biomass burning in the study area.
The level 2.0 (quality certified by the network) provide measure of AOD at 440 nm greater than 0.4, while AOD values 0.01 and 0.02 are defined as uncertainties, depending on the wavelength (HOLBEN et al. 1998). This uncertainty results in a range from 0.03 to 0.04 of the Angstrom exponent (SCHUSTER et al., 2006) and 0.03 to 0.07 of the SSA values (DUBOVIK et al., 2002). However, the limit of AOD at 440 nm is much higher than found in the Amazon basin during the wet season (around 0.15) (SCHAFER et al., 2008). The lower limit of AOD at 440 nm adopted in this study was 0.2 as the work of Sayer et al. (2014). These authors had results similar to the limit of 0.4 in the evaluation of the size distribution.
3 RESULTS AND DISCUSSION
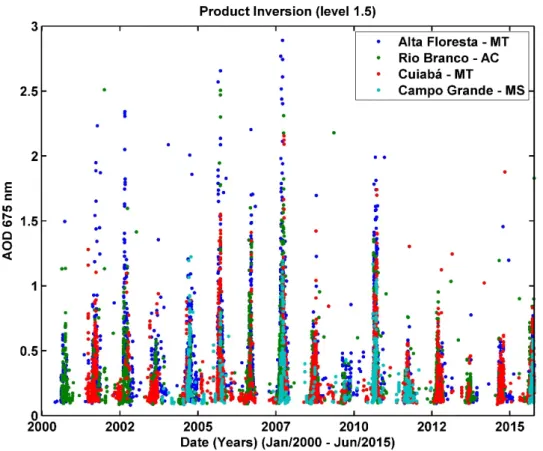
The time series of AOD 675 nm (Figure 2) shows the characteristic variation of the aerosol optical depths in all areas of study. This pattern of time series shows the seasonality of the AOD 675 nm, which is due to the high number of fire occurrence during the dry season from southern Amazonas to the Midwest region of Brazil (SENA et al., 2013; ARTAXO et al., 2013). Fuzzi et al. (2007) report the large variability in the chemical composition of aerosols on the southern Amazon region during the dry season due to biomass burning in the region "arc of deforestation", which is completely related to the pattern of AOD in this region. The years 2005 and 2010 are reported by Marengo et al. (2008) Marengo et al.
(2011), respectively, as years with great amount of carbon released into the atmosphere due to the prolonged drought.
Figure 2 - Distribution of the time series of AOD 675 nm on the sites under study
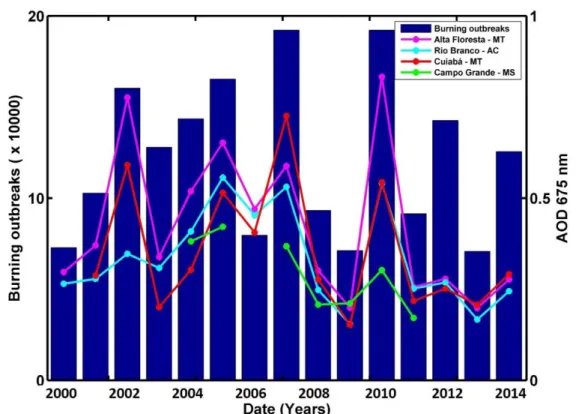
The relationship between fire records in Brazil and the values of the AOD 675 nm (Figure 3) highlight that both the Amazon and the Cerrado are directly affected by biomass burning. In Figure 3 the sum of fire records in August, September and October are related to the average of AOD 675 nm in the dry season. Unlike the relationship with the rates of deforestation in the Amazon, quoted by Sena et al. (2013), the burned records explain with high efficiency the annual pattern of AOD in northern Brazil.
As previously noted, the years 2005, 2007 and 2010 recorded outbreaks of fires that exceeded 150 thousand during the three months of the dry season due to prolonged drought. The values of the AOD 675 nm of this study are consistent with the values of AOD 550 nm in Alta Floresta, Rio Branco and Cuiabá during the period 2001-2007 (HOELZEMANN et al., 2009).
The descriptive statistic of the AOD 675 nm in each study area during the year, and during the wet and dry seasons is shown in Table 1. The mean values, median and mode
of AOD 675 nm throughout the study period are extremely low (Table 1). The values AOD 675 nm and the amount measures decrease during the wet season.
Figure 3 - Sum of fire records in Brazil in August, September and October and average
of AOD 675 nm in the study areas during the dry season
The high standard deviation values in all areas of study emphasize the high variability of AOD in the north and Midwest of Brazil throughout the year. The largest variations of AOD 675 nm occurred in Alta Floresta, averaging 2.8 during the dry season of 2007 (Figure 2). The average values of AOD 675 nm in Alta Floresta, Rio Branco and Cuiabá during the study period were above the global average (0.13) estimated for the spectrum range of 550 nm 2003-2012 (MAO et al., 2014).
The average AOD 675 nm in Campo Grande was lower than in other areas of study throughout the study period. This suggests that the magnitude of impacts caused by particle transport through the atmosphere can be relatively lower if compared to other areas in the north of Brazil, although this region is also affected by biomass burning. The AOD 675 nm in Alta Floresta had greater difference between the dry and wet season (47%), followed by Rio Branco (34%), Cuiabá (35%) and Campo Grande (30%).
Table 1- Descriptive statistic of the AOD 675 nm in Alta Floresta, Rio Branco, Cuiabá and Campo Grande
during the annual, wet and dry period from January 2000 to July 2015
Statistics Alta Floresta Rio Branco
Annual Wet Dry Annual Wet Dry
Mean 0.4427 0.3763 0.4769 0.3172 0.3338 0.3457 Median 0.2945a 0.2509a 0.3286a 0.2150a 0.2085a 0.2443a Mode 0.1429b 0.1593b 0.1604b 0.1000b 0.0947b 0.0920b Std. Deviation 0.3999 0.4647 0.4095 0.2850 0.2674 0.2918 Variance 0.1600 0.2160 0.1677 0.0812 0.0715 0.0851 Minimum 0.0808 0.1593 0.0928 0.0869 0.0947 0.0920 Maximum 2.8905 2.4868 2.8905 2.5102 1.0341 2.5054 Number of records 2354 25 1971 2247 13 1846
Cuiabá Campo Grande
Annual Wet Dry Annual Wet Dry
Mean 0,3251 0,2567 0,3546 0,1223 0,1223 0,3083 Median 0,2276a 0,2076a 0,2689a 0,1087a 0,1087a 0,2169a Mode 0,1022b 0,1166b 0,1168b 0,0933b 0,0933b 0,1301 Std. Deviation 0,2660 0,2027 0,2761 0,0463 0,0463 0,2257 Variance 0,0707 0,0411 0,0762 0,0021 0,0021 0,0509 Minimum 0,0956 0,1166 0,0966 0,0933 0,0933 0,0941 Maximum 2,1535 1,2449 2,1535 0,3510 0,3510 1,2230 Number of records 2009 49 1627 748 35 619
a. Calculated from grouped data.
b. Multiple modes exist. The smallest value is shown
Sena et al. (2013) found mean AOD 550 nm of 0.31 in the forest region of the Amazon basin from 2000 to 2009. This value is less than 0.44 in this study in Alta Floresta and 0.31 and 0.32 in Rio Branco and Cuiabá, respectively. However, Hoelzemann et al. (2009) reported higher values from 2001 to 2007 in all areas of the study. This difference is due to the period of analysis to be distinguished between studies. There were two major dried in 2005 and 2007 (HOELZEMANN et al., 2009), while the low fire numbers 2008 and 2009 (SENA et al., 2013) decreased the AOD in the region.
The analysis of the AOD 675 nm results was complemented with SSA 675 nm in the same circumstances. SSA values, unlike the AOD 675 nm showed a not well-defined seasonal pattern. However, there is little variation between the dry and wet seasons, also due to the high variability of the chemical properties of aerosols in the dry season. The descriptive statistic of the SSA 675 nm in each study area during the year, and during the wet and dry seasons is shown in Table 2.
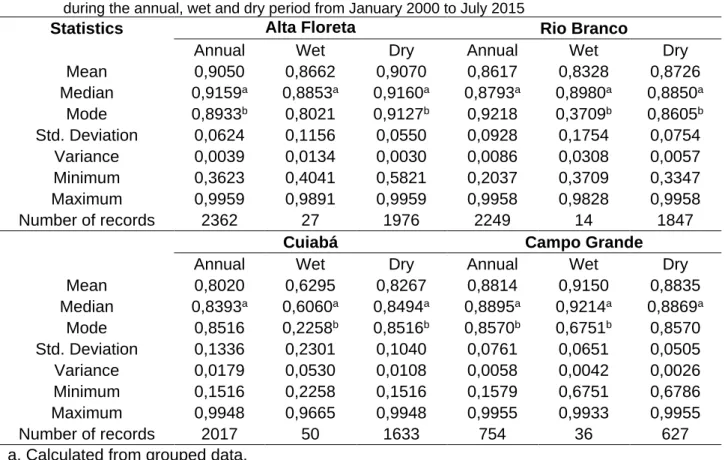
Table 2- Descriptive statistic of the SSA 675 nm in Alta Floresta, Rio Branco, Cuiabá and Campo Grande
during the annual, wet and dry period from January 2000 to July 2015
Statistics Alta Floreta Rio Branco
Annual Wet Dry Annual Wet Dry
Mean 0,9050 0,8662 0,9070 0,8617 0,8328 0,8726 Median 0,9159a 0,8853a 0,9160a 0,8793a 0,8980a 0,8850a Mode 0,8933b 0,8021 0,9127b 0,9218 0,3709b 0,8605b Std. Deviation 0,0624 0,1156 0,0550 0,0928 0,1754 0,0754 Variance 0,0039 0,0134 0,0030 0,0086 0,0308 0,0057 Minimum 0,3623 0,4041 0,5821 0,2037 0,3709 0,3347 Maximum 0,9959 0,9891 0,9959 0,9958 0,9828 0,9958 Number of records 2362 27 1976 2249 14 1847
Cuiabá Campo Grande
Annual Wet Dry Annual Wet Dry
Mean 0,8020 0,6295 0,8267 0,8814 0,9150 0,8835 Median 0,8393a 0,6060a 0,8494a 0,8895a 0,9214a 0,8869a Mode 0,8516 0,2258b 0,8516b 0,8570b 0,6751b 0,8570 Std. Deviation 0,1336 0,2301 0,1040 0,0761 0,0651 0,0505 Variance 0,0179 0,0530 0,0108 0,0058 0,0042 0,0026 Minimum 0,1516 0,2258 0,1516 0,1579 0,6751 0,6786 Maximum 0,9948 0,9665 0,9948 0,9955 0,9933 0,9955 Number of records 2017 50 1633 754 36 627
a. Calculated from grouped data.
b. Multiple modes exist. The smallest value is shown
The average of the SSA 675 nm for Alta Floresta for the whole period analyzed was 0.90 ± 0.06, and 0.86 ± 0.11 in the wet season and 0.90 ± 0.05 in the dry season, already for Rio Branco the average for the whole period analyzed was 0.86 ± 0.09, and 0.83 ± 0.17 in the wet season and 0.87 ± 0.07 in the dry season.
The low number of data for rainy season due to the process of filtering data, the value of depth perspective of 0.2 for the spectrum from 440 nm has limited much of the data for all sites in the analysis. In the wet season the mean value observed for AOD at 440 nm is 0.15 for the region of the Amazon Basin (SCHAFER et al., 2008).
For the site of Cuiabá, the average SSA 675 nm for the whole period analyzed was 0.80 ± 0.13, and 0.62 ± 0.23 in the wet season and 0.82 ± 0.10 in the dry season, while for Campo Grande to average for the whole period analyzed was 0.88 ± 0.07, and 0.91 ± 0.06 in the wet season and 0.88 ± 0.05 in the dry season.
In general, the average of SSA 675 nm during the wet season were lower than in the dry season, except in Campo Grande where they had lower average during the wet season. SSA 675 nm records had greater variability during the wet season due to lower number of
records.
Rizzo et al. (2013) showed the existence of a seasonal variation in SSA over the Amazon basin when the region is not influenced by dust particles and burned from Africa. However, SSA values can be significantly reduced to less than 0.55 when it receives particles from Africa. In this study, a small difference in SSA values between the wet and dry season was detected, indicating a small decrease in SSA average during wet and dry seasons in long-term (15). Once the atmosphere has physical and chemical properties that are different between the wet and dry seasons.
The great contribution of emissions from biomass burning is completely variable to size distribution of the aerosol particles over the entire study area. Figure 4 represents the size distribution of the particulate material on the set of study during the wet season dry seasons.
Figure 4 - Average of size distribution as function of the particle’s radius during the wet and dry season in Alta Floresta, Rio Branco, Cuiabá and Campo Grande 2000-2014
A bimodal distribution of the size distribution was observed in all study areas, with little difference between the distributions obtained in the north and center-west of Brazil. The
Northern region has presented the clear evidences of the highest concentration of particulate matter in the fashion coat of aerosols in the dry season so that the contributions of particles emitted by the burning of forest characterize the size distribution.
Still on the north region, Alta Floresta and Rio Branco, notes the high distribution of particles of coarse fashion on the rainy season. For the sites located on the center-west region, Cuiabá and Campo Grande, there was a parity between the distributions of fine fashion and fashion bead of aerosols in the dry season, which may be directly related to the type of burning characteristic of the region. The lower incidence of flames and consequently a greater amount of smoke causes a preponderant competition between fine material and thick.
Data collection sites in Cuiabá and Campo Grande are close to urban areas, which explains the distribution of aerosols to be characteristic of urban sources. Although there are cities with a strong industrial potential, the emission of particles of the type "soot" and dust that are produced by intense processes of construction may be responsible, in principle, by this behavior.
The additional analysis of the size distribution was carried out through the relationship between the Scattering Angstrom Exponent (SAE) and Exponent Angstrom Absorption (SEA) 440-870 nm. The SAE by AAE results in the matrix of Angstrom (RUSSELL et al., 2010). Thus, AAE is an indicator of the chemical composition of the aerosol and the SAE provides information about the particle size, which allows an analysis of different types of absorption due to the size and allows inferring possible sources of particulate matter (CAZORLA et al., 2013).
Figure 5 shows the matrix of Angstrom of study areas. The SAE and SEA dataset were separated into wet and dry seasons. Types of aerosol based on the spectral properties show a predominance of mixing elements (CAZORLA et al., 2013). This makes the detection of elemental carbon (EC) be underestimated, since the classification can be given as a mixture with organic carbon (OC). This fact is expected due to the integration of aerosol properties in the atmospheric column.
Figure 5 - Matrix of Angstrom in Alta Floresta, Rio Branco, Cuiabá and Campo
Grande from January 2000 to July 2015
The identification of the type of aerosol can be made not only by absorption wavelength, but also by scattering wavelength. For example, dust radiation spectra have positive slope and have negative curvature, while radiation spectra on urban pollution as industrial smoke and biomass burning have an inclination in its curve (RUSSELL et al., 2010).
Figure 5 shows that for the region of Alta Floresta the few points representative of the rainy season are in one quadrant of the matrix of Angstrom units where the maximum values of SAE and AAE reach 1.5 and 1.0 respectively. The low values of SAE indicate large particles, and AAE below 1.0 indicate low absorption suggesting the predominance of biogenic emissions with potential urban mixtures, possibly from industrial and vehicular sources. Alta Floresta has a large dispersion along the Angstrom matrix during the dry season, more than 2.2 SAE values and SEA greater than 2.5. This characterizes the particle emission from biomass burning due to a high distribution of small particles that are able to strongly absorb the radiation.
(Figure 5) with large distributions of fractions of EC and OC. This is due to the addition of particles of forest biomass burning and also the burning of pasture and cerrado that are brought by the atmosphere. The radiation scattering in the Amazon basin is substantially influenced by the abrupt change of atmospheric composition during the wet season due to removal of particulate material in the atmosphere by precipitation Rizzo et al. (2013).
The pattern of distribution of SAE and SEA in Rio Branco was similar to Alta Floresta. The matrix of Angstrom showed predominance of large and paver particles during the wet season and small and any impact absorber during the dry season due to the chemical pattern resulting from the addition of emissions from biomass burning in the Amazon Basin (ARTAXO et al., 2013; BRITO et al., 214). Variations in take-overs and spreading are complemented through the Figure 5.
The distribution of Cuiabá had similar pattern to study areas in the Amazon, with a predominance of larger particles in the wet season. This may be associated with urban and dust emissions in the region, since the study area is close to the urban area of Cuiabá, the capital of Mato Grosso, Brazil. The vegetation on the site where the CIMEL radiometer was installed is sparse and typical of the Cerrado, which makes limited biogenic contributions in this region. The influence of biomass burning was clearly detected during the dry season due to the large distribution points in matrix of Angstrom (Figure 5) in the fraction of OC and EC, as well as the mixture of these two classifications. There has been a small reduction in Cuiabá when compared to Alta Floresta and Rio Branco, this reduction suggests a slight increase of particles in the dry season when compared to sites located to the north in the Amazon Biome. The small difference detected in particle size between Cuiabá and Alta Floresta and Rio Branco can be linked to the transport process these particles burning in the study areas located in the Cerrado, besides the way the plants are burned.
The influence of urban industrial area in Campo Grande prevails during the wet season, but the largest contributions in the dry season are due to biomass burning (HOELZEMANN et al., 2009). The dispersion fraction of the Campo Grande Angstrom matrix during the wet season (Figure 5) is in a transitional area between OC and EC, which strongly characterizes the issue of burning fossil fuels, emissions from vehicles and urban.
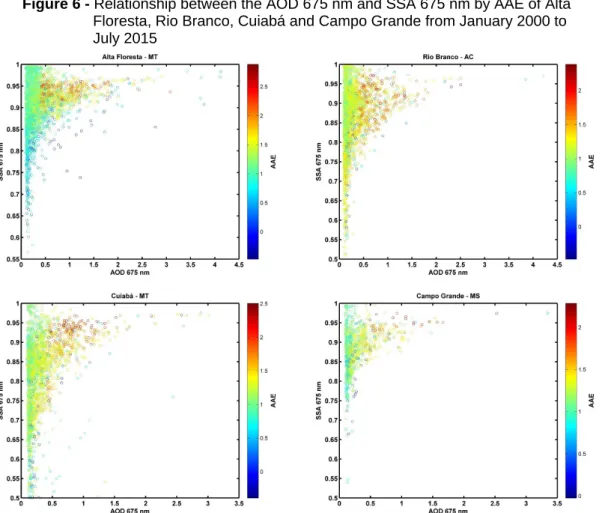
The relations between AOD and SSA 675 nm by AAE (Figure 6) are the main variations of AOD 675 nm depending on the physical and chemical properties of the atmosphere, as well as the radiation dispersion and absorption properties of the study areas.
Figure 6 - Relationship between the AOD 675 nm and SSA 675 nm by AAE of Alta Floresta, Rio Branco, Cuiabá and Campo Grande from January 2000 to
July 2015
Relations between the AOD 675 nm and 657 nm SSA in all areas of study highlights two main trends, the first shows that for low values of AOD the albedo decreases significantly reaching values below 0.6 in the wet season where the values of AAE reach 1.0. Low values for the exponent of Angstrom in the wet season are due to the large change in the particle size of the profile and possibly due to the elimination of volatile organic compounds in precipitation (RIZZO et al., 2011). It is also observed that the large-scale distribution points for EFA in Alta Floresta (90% of points) has values below 1.5, as noted by Rizzo et al. (2011) the particles in the biogenic Amazon may have a weak dependence on spectral absorption. The pattern of AOD 675 nm and SSA 675 nm in Rio Branco was similar to Alta Floresta (Figure 6). The AAE values above 2.0 occurred when AOD from 1.0 to 2.5, ie during the dry season. Rizzo et al. (2011) reported that values of Angstrom absorption exponents by approximately 2.0 are associated with biomass-burning aerosols due to the efficient absorption of radiation at wavelengths shorter than 600 nm. Changes in the chemical composition of the particles may make the absorption weaker due to the low spectral dependence of the aerosols due to the conditions of different types of combustion of fossil
fuels or even of different types of biomass (MOOSMÜLLER et al., 2011).
Although the pattern of SSA values in Cuiabá is similar to those measured in Alta Floresta and Rio Branco, there is a greater amount of SSA values below 0.6. This study suggests that radiation absorption is higher in Cuiabá in both the dry season and the wet season, possibly due to the characteristic of the material burned in this region. The burning occurring in the Cerrado usually spread under vegetation and the burning processes are incomplete. The low temperature can produce aerosols with high power to absorb the radiation compared to the particulate materials from the biomass burning in high temperatures, as they occur in forests in the dry season.
Even though the number of samples is extremely small in Campo Grande, the data pattern is similar to those in Cuiabá. In general, the highest values of SSA at all study sites were recorded in the dry season. Substantial increases in scattering coefficients occur due to the addition of fine particles, which are influenced by burning, which spread the radiation much more efficiently when compared to the coarse particles, which are the biogenic particles in the Amazon region in the wet season (RIZZO et al., 2013).
4 CONCLUSIONS
The values of AOD 675 nm varied seasonally on all sites examined, being that the highest values were obtained in the dry season due the great contribution of particles from biomass burning. The averages of AOD 675 nm for the depots located in the Amazonian biome, Alta Floresta and Rio Branco for the entire period were 0.44 ± 0.39 and 0.31 ± 0.28 respectively, and for the dry season, means were 0.47 ± 0.40 and 0.34 ± 0.29 respectively. As for the rooms located in the Cerrado biome, Cuiabá and Campo Grande, the averages for the entire period were 0.32 ± 0.26 and 0.10 ± 0.04 respectively, and for the dry season, means were 0.35 ± 0.27 and 0.30 ± 0.22 respectively. The high values obtained for the standard deviation showed great variability in the values of AOD for all sites.
With regard to the values of SSA 675 nm the medium to Alta Floresta and Rio Branco for the entire period were 0.90 ± 0.06 and 0.86 ± 0.07 respectively, and for the dry season means were 0.90 ± 0.05 and 0.87 ± 0.07 respectively. As for the set of Cuiabá and Campo Grande, the averages for the entire period were 0.80 ± 0.13 and 0.88 ± 0.07 respectively, and for the dry season, means were 0.82 ± 0.10 and 0.88 ± 0.05 respectively. Unlike the
values of AOD, the values of SSA showed little variation, including between rainy and dry seasons. It was noted that the values of SSA for the regions located in the cerrado biome were slightly smaller than the values obtained for the depots located in the Amazon Biome. The analysis of the distribution of size in conjunction with the analysis of possible classifications of aerosols, the matrix of Angstrom, suggests a small difference between physical properties and chemistry between regions influenced by the burning of forests and regions affected by the burning of pasture and cerrado. For the sites of Alta Floresta and Rio Branco has been observed that during the wet season there is predominance of biogenic particles with mixtures of urban emissions while in the dry season the emission of Biomass burning is predominant. The contributions of particles of biomass burning during the dry season about the Amazon region substantially increase the properties of scattering of radiation in the atmosphere, this fact was not observed with the same intensity on the depots located in the cerrado.
About Cuiabá and Campo Grande was observed that in the wet season the predominance of urban emissions and dust from the ground and in the dry season particles of biomass burning. However, for the dry season it was noted that the particulate material on Cuiabá is Campo Grande is more fuel when compared to sites located in the Amazonian biome, justified by the type characteristic of burns that occurs on the cerrado, incomplete burning at low temperature, which imitate particles, strongly any impact absorber.
ACKNOWLEDGEMENTS
The authors thank CAPES for the financial support (process n° 01439213127) and the research group of the Graduate Program in Environmental Physics (project of 457824/2013-1 approved process in call n° 68/2013 MCTI/CNPq/FNDCT-Cross action/LBA). The research group of the Institute of Physics of the University of São Paulo (USP) for the availability of the AERONET network data.
REFERENCES
ARAGÃO, L.E.O.C. et al. 21st Century drought-related fires counteract the decline of Amazon deforestation carbon emissions. Nature communications, v. 9, n.1, p. 536, 2018.
controlando a composição da atmosfera amazônica, Acta Amazonica, v. 35, n. 2, p. 191-208, 2005.doi: 10.1590/S0044-59672005000200008.
ARTAXO, P. et al. Atmospheric aerossol in Amazonia and land use change: from natural biogenic to biomass burning conditions. Faraday Discussions, n. 13, p. 203-235, 2013. doi:
10.1039/c3fd00052d.
AZEVEDO-RAMOS, C., & MOUTINHO, P. No man’s land in the Brazilian Amazon: Could undesignated public forests slow Amazon deforestation?. Land Use Policy, n. 73, p. 125-127, 2018.
BATLLE-BAYER, L., BATJES, N.H., AND BINDRABAN, P.S. Changes in organic carbon stocks upon land use conversion in the Brazilian Cerrado: A review. Agriculture, Ecosystems and Environment, n. 137, p. 47-58, 2010. doi:10.1016/j.agee.2010.02.003.
BRITO, J. et al. Ground-based aerosol characterization during the South American Biomass Burning Analysis (SAMBBA) field experiment, Atmospheric Chemistry and Physics, n. 14, p. 12069-12083, 2014. doi: 10.5194/acp-14-12069-2014.
CAZORLA, A. et al. Relating aerosol absorption due to soot, organic carbon, and dust to emission sources determined from in-situ chemical measurements. Atmospheric Chemistry and Physics, n. 13, p. 9337-9350, 2013. doi: 10.5194/acp-13-9337-2013.
CCAL. Carbon Calculator Amazon Environmental Research Institute (IPAM). 2017. (Accessed on 27th February 2018) Available at http://www.carboncal.org.br/view/brasil/.
DAVIDSON, E. A.et al. The Amazon basin in transition. Nature, n. 481, p. 321-328, 2012. doi:10.1038/nature10717.
DUBOVIK, O.et al. Variability of absorption and optical properties of key aerosol types observed in worldwide locations. Journal of the Atmospheric Sciences, n. 59, p. 590 - 608, 2002.
doi:10.1175/1520-0469 (2002)059<0590:VOAAOP>2.0.CO;2.
FORSTER, P. et al.. Changes in atmospheric constituents and in radiative forcing. in: SOLOMON, S. et al. Climate Change 2007: the physical science basis, contribution of working group i to the fourth assessment report of the intergovernmental panel on climate change. Cambridge University Press, Cambridge, UK and New York, NY, USA, p.129-234, 2007.
FUZZI, S. et al. Overview of the inorganic and organic composition of size-segregated aerosol in Rondônia, Brazil, from the biomass-burning period to the onset of the wet season. Journal of Geophysical Research, n. 112, 2007. D01201, doi: 10.1029/2005JD006741.
GUIRADO, C. et al. Aerosol characterization at the Saharan AERONET site Tamanrasset.
Atmospheric Chemistry and Physics, n. 14, p. 11753-11773, 2014. doi: 10.5194/acp-14-11753-2014.
HOELZEMANN, J.J. et al. Regional representativity of AERONET observation sites during the biomass burning season in South America determined by correlation studies with MODIS Aerosol Optical Depth. Journal of Geophysical Research, n. 114, D13301, 2009. doi:
10.1029/2008JD010369.
HOLBEN, B.N. et al. AERONET – a federated instrument network and data archive for aerosol characterization. Remote Sensing of the Environment, n. 66, p. 1-16, 1998. doi:
10.1016/S0034-4257(98)00031-5.
IBGE (Brazilian Institute of Geography and Statistics). Manual técnico da vegetação brasileira. Rio de Janeiro: IBGE, 2012. 274 p.
MAO, K.B. et al. Global aerosol change in the last decade: An analysis based on MODIS data. Atmospheric Environment, n. 94, p. 680-686, 2014. doi: 10.1016/j.atmosenv.2014.04.053. MARENGO, J.A. et al.Hydro-climatic and ecological behaviour of the drought of Amazonia in 2005. Philosophical Transactions of the Royal Society B, n. 363, p. 1773-1778,
2008.doi:10.1098/rstb.2007.0015.
MARENGO, J.A. et al. The drought of 2010 in the context of historical droughts in the Amazon region. Geophysical Research Letter, 38, L12703, 2011. doi: 10.1029/2011GL047436. MOOSMÜLLER, H. et al. Absorption Angström coefficient, brown carbon, and aerosols: basic concepts, bulk matter, and spherical particles. Atmospheric Chemistry and Physics, n. 11, p. 1217-1225, 2011. doi: 10.5194/acp-11-1217-2011.
PROCOPIO, A.S. et al. Multiyear analysis of amazonian biomass burning smoke radiative forcing of climate. Geophysical Research Letter, n. 31, L03108, 2004. doi: 10.1029/2003GL018646. RIBEIRO, S.C. et al. Above- and belowground biomass in a Brazilian Cerrado. Forest Ecology and Management, n. 262, p. 491-499, 2011. doi:10.1016/j.foreco.2011.04.017.
RIZZO, L.V. et al. Long term measurements of aerosol optical properties at a primary forest site in Amazonia. Atmospheric Chemistry and Physics, n. 13, p. 2391-2413, 2013. doi: 10.5194/acp-13-2391-2013.
RIZZO, L.V. et al. Spectral dependence of aerosol light absorption over the Amazon Basin. Atmospheric Chemistry and Physics, n. 11, p. 8899-8912, 2011. doi: 10.5194/acp-11-8899-2011.
RODRIGUES, T.R. (2014). Seasonal variation in energy balance and canopy condutance for a tropical savana ecosystem of South central Mato Grosso, Brazil. Journal of Geophysical Research: Biogeosciences, n. 119, p. 1-13, 2014. doi: 10.1002/2013JG002472.
RUSSELL, P.B.et al. Absorption Angstrom Exponent in AERONET and related data as an indicator of aerosol composition. Atmospheric Chemistry and Physics, n. 10, p. 1155-1169, 2010. doi: 10.5194/acp-10-1155-2010.
SAYER, A.M. et al. AERONET-based models of smoke-dominated aerosol near source regions and transported over oceans, and implications for satellite retrievals of aerosol optical depth. Atmospheric Chemistry and Physics, n. 14, p. 11493-11523, 2014. doi: 10.5194/acp-14-11493-2014.
SCHAFER, J.S. et al. Characterization of the optical properties of atmospheric aerosols in Amazônia from long-term AERONET monitoring (1993–1995 and 1999–2006. Journal of Geophysical Research, n. 113, p. 1-16, 2008. doi: 10.1029/2007JD009319.
SCHUSTER, G.L.; DUBOVIK, O. ; HOLBEN, B.N. Angstrom exponent and bimodal aerosol size distributions. Journal of Geophysical Research, n. 111, D07207, 2006. doi:
SENA, E.T., ARTAXO, P. AND CORREIA, A.L. Spatial variability of the direct radiative forcing of biomass burning aerosol and the effects of land use change in Amazonia. Atmospheric