1
Using Binary Logistic Regression to Explain the Impact of Accident Factors on Work Zone
Crashes
Bertha Santos1, Luís Picado-Santos2, Valdemiro Trindade3
1CERIS-CESUR, Department of Civil Engineering and Architecture, University of Beira Interior, Covilhã,
Portugal, [email protected]
2CERIS-CESUR, Department of Civil Engineering, Architecture and Georesources, Instituto Superior
Técnico, Universidade de Lisboa, Lisbon, Portugal, [email protected] 3Department of Civil Engineering and Architecture, University of Beira Interior, Covilhã, Portugal,
Abstract
For consolidated road networks, the identification, programming, and implementation of maintenance actions enables addressing the deficiencies identified in the infrastructure, ensuring the provision of an adequate service to users. The performance of such actions along the infrastructure lifetime makes it necessary to study the impact that road work zones may have on road crashes since these areas change locally and temporarily the traffic conditions offered to users (lower speeds, the presence of work equipment and workers, narrow lanes, changes in vertical and horizontal signs, etc.).
This study aims to analyze the Portuguese official road work zones crash data from 2013-2015 period by using binary logistic regression models to identify the most significant factors influencing work zone crashes. Official data was processed in order to be used in a statistical analysis software and the binary logistic regressions were performed for the analysis of Portuguese work zone crashes by the type of crash (pedestrian, angle, rear-end and run-off-road), driver age groups (under 25 years, 25 to 64 and over 65 years) and a predominant contributing factor as speeding, unexpected obstacle on the road and the disregard for vertical road signs and safety distance (main contributing factors identified in this study).
Results obtained shows that factors as “urban environment”, “one driver involved is running straightly”, “clean and dry pavement” and “daylight” have positive impact in a large number of models.
The identification of these factors allows supporting the definition of strategies aimed at the reduction of the number and severity of crashes in road work areas.
Keywords
Road Safety, Work Zone Safety, Work Zone Crashes, Binary Logistic Regression.
1. Introduction
Maintenance and reconstruction actions are needed on the road network in order to overcome degradation and deficiencies, ensuring the provision of an adequate infrastructure service to users. Such actions modify the traffic and road environment conditions offered to users on a specific part of the network even if on a temporary basis (lower speeds, the presence of work equipment and workers, narrow lanes, changes in vertical and horizontal signs, etc.), creating the so call “work zones”. These changes in traffic and road environment conditions may cause the occurrence of serious traffic accidents and casualties.
The research of Ullman et al. (2006) (1), Meng et al. (2010) (2) and Silverstein et al. (2016) (3) shows that the probability of occurrence of serious accidents at road work zones is higher than outside these areas.
European data used in the FORMAT project (2005) (4), which counted with the participation of 20 organizations of 14 European countries and also having the participation of USA representatives, indicate that work zone accidents represent less than 2% of all road accidents (3 to 5% for freeway networks). Similar values (2-3%) were presented at the ARROWS project (1998) (5). Both projects found that the data stored by the participating countries presents varying degrees of inconsistency and most do not include important information needed for adequate analysis and prediction models support.
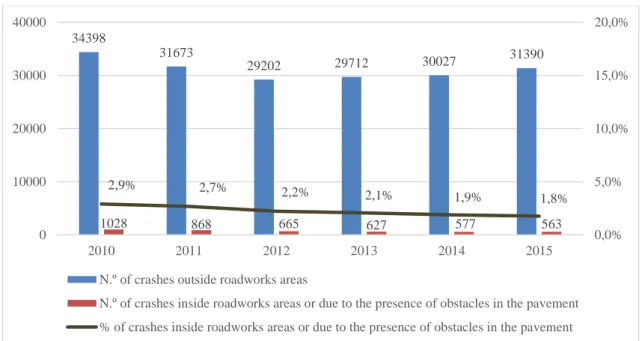
Figure 1 shows the evolution of the number of accidents in road work areas for Portugal from 2010 to 2015.
2
Figure 1: Evolution of the number of crashes in Portuguese road work areas
Although the fact that in Portugal the road accident statistical bulletin in use collects information on crashes occurring at roadwork areas, it does not provide an estimation of the increased risk. This is due to the fact that it does not include any measure of exposure such as the number, length and duration of road works or flow through these areas. However, the risk associated with work zones can be minimized by intervening in aspects related to critical variables identified in a logistic regression analysis.
2. Methodology
The present study is a detailed approach to Portuguese official work zones crash data and it focuses on the information provided by the Portuguese Authority for Road Safety (ANSR – Autoridade Nacional de Segurança Rodoviária) of events recorded in Portugal (not considering the Atlantic archipelagos of Azores and of Madeira) between the years 2013 and 2015.
The research methodology requires selecting relevant data from the Portuguese official road crash records and compiling two databases, in order to analyze the information in a statistical analysis software and obtain a more complete understanding of the impact of factors involved in work zone crashes.
For that purpose, a set of explanatory variables are selected from the available data and a binary logistic regression is adopted to develop models to predict the probability of the occurrence of work zone crashes by the type of crash , main contributing factors, and drivers age group.
3. Analysis and Results 3.1. Selection of data
In Portugal, the report of work zone incidents is made in the field "Obstacles or roadworks" of the "External circumstances – Road pavement" section of the Road Accident Statistical Report (BEAV – Boletim Estatístico de Acidentes de Viação). This information is reported together with the crashes due to obstacles on the pavement, with the following field options available: non-existent, not flagged, poorly flagged and properly flagged. The selection of one of these options should be made for all the reported crashes (the field must be filled in).
Once, it was found that the indication "Not Set" for this field appears in the ANSR records for a significant number of reports, corresponding to a non-filled situation (23,4% over the analysis period), the analysis and modeling performed focused on the reports with the field filled. The lack of fulfillment of this field does not allow to assign the crash occurrence to the presence of an obstacle on the pavement or to a road section under construction/maintenance.
This decision allowed to select the reports where it is, in fact, possible to identify where a crash has occurred on a road section under construction/maintenance or due to the presence of obstacles on the pavement.
With this information, it was possible to structure two work zone crash databases and identify the factors that are responsible for a high proportion of crashes.
34398 31673 29202 29712 30027 31390 1028 868 665 627 577 563 2,9% 2,7% 2,2% 2,1% 1,9% 1,8% 0,0% 5,0% 10,0% 15,0% 20,0% 0 10000 20000 30000 40000 2010 2011 2012 2013 2014 2015
N.º of crashes outside roadworks areas
N.º of crashes inside roadworks areas or due to the presence of obstacles in the pavement % of crashes inside roadworks areas or due to the presence of obstacles in the pavement
3
In the first database, the information was organized by crash and used for the modeling of the type of crash and contributing factors (1767 crashes). The second one, with information organized by report (a crash may have more than one report associated), was used for the age group modeling since the official data does not permit to identify the responsible driver for the crash occurrence (2668 reports related to the 1767 crashes).
3.2. Logistic regression approach
The logit transformation offers greater facilities, both from a mathematical point of view and in terms of interpretation of results. The default response function modeled by the Logistic procedure is presented in equation (1).
𝑙𝑜𝑔𝑖𝑡(𝑃) = 𝑙𝑜𝑔(𝑜𝑑𝑑𝑠) = 𝑙𝑜𝑔 ( 𝑃
1−𝑃) = 𝛽0+ 𝛽1𝑋1+ 𝛽2𝑋2+ ⋯ 𝛽𝑘𝑋𝑘 (1)
Where P is the probability of the event of interest (in this study the occurrence of a certain type of crash, the involvement of a certain age group driver or contributing factor); odds is the ratio of the probability of the occurrence over the probability of the nonoccurrence; {𝑋1, 𝑋2, … , 𝑋𝑘 } are the set of predictors (explanatory
variables); and {𝛽1, 𝛽2, … , 𝛽𝑘 } are the coefficients of predictors.
From equation (1) it can be deduced that:
𝑃 = 𝑒𝛽0+𝛽1𝑋1+𝛽2𝑋2+⋯+𝛽𝑘𝑋𝑘
1+𝑒𝛽0+𝛽1𝑋1+𝛽2𝑋2+⋯+𝛽𝑘𝑋𝑘=
1
1+𝑒−(𝛽0+𝛽1𝑋1+𝛽2𝑋2+⋯+𝛽𝑘𝑋𝑘) (2)
As the occurrence of work zone crashes is a binary variable (occurrence/nonoccurrence) and they are affected by various factors, binary logistic models has been used to address the related variables and explain the impact of the predictor variables on the occurrence of crashes - relationship between the probability of the occurrence of crashes and explanatory variables (6) (7) (8).
3.3. Models
Firstly, exploratory studies were carried out on the selected data. The analysis shows that the percentage of work zone crashes is about 2% and has decreased over the analysis period (see Figure 1), which may be related to the decrease of investment in conservation, maintenance, and rehabilitation of road infrastructure.
From the results obtained, it was possible to conclude that the principal crash types and main contributing factors of work zones crashes in the 2013-2015 period were:
- Crash type: pedestrian (15%), angle (13%), run-off-road (11%) and rear-end (11%).
- Contributing factors: unexpected obstacle on the road (7%), excessive speed for the prevailing conditions (6%), disregard for road vertical signs (3%) and disregard for safety distances (3%).
These factors are also pointed out in the consulted bibliography (8) (9) (10) (11) (12) (13) (14).
Three age groups of drivers were also considered: under 25 years (young), 25 to 64 (middle) and over 65 years (elderly). Middle-aged drivers represent 73% of the total number of drivers involved in work zone crashes, while only 13% of young drivers and 11% of elderly were involved in this type of crashes.
In view of these findings, eleven binary logit models were developed to address the factors which have a significant impact on the occurrence of work zone crashes: four for crash type, four for the main crash contributing factors and three for driver’s age groups.
In the modeling process, the response variable is the type of crash, contributing factor or age group, where “1” value indicates the occurrence of a specific type of crash or the involvement of a specific age group driver or contributing factor (event of interest), and “0” value represents the crash nonoccurrence or the age group or contributing factor noninvolvement.
The initial set of explanatory variables (15 variables) were selected based in the literature and in the ones available in the Portuguese official crash data. The value assigned to the variables (0 or 1) took into account the results obtained in the exploratory analysis. The response and explanatory variables used in the analysis are shown in Table 1.
The modeling analysis was performed using the statistical analysis software SAS® Studio University Edition. The regression parameters were estimated with the Logistic procedure by maximum likelihood estimate (MLE) to estimate the parameters combination that maximizes the likelihood of the observed outcomes. Stepwise selection with fast backward elimination method was adopted through the binary logistic regression process, with variables added or removed from the model based on a significance level of 0.05.
Wald test, that tests the null hypothesis that all coefficients of predictors are equal to zero (β1= β2= … = βk=0), was used to examine the significance of parameters of the overall model. If significant at 0.05 level, the null hypothesis will be rejected, mining that the predictors have influence on the prediction result.
After obtaining the estimated values of coefficients, the Hosmer-Lemeshow test was adopted to measure the goodness-of-fit of the logistic regression models. This statistic index tests the null hypothesis that there is no
4
difference between the observed and predicted values of the response variable. When the test is not significant at a significant level of 0.05, the null hypothesis cannot be rejected and the model fits the data well.
Table 1: Models variables
Variable Description Value
Re sp o n se v ariab les Ty p e o f cra sh
Pedestrian Crash type is pedestrian 0 (nonoccurrence)
1 (occurrence)
Angle Crash type is angle 0 (nonoccurrence)
1 (occurrence)
Run off Road Crash type is run-off-road 0 (nonoccurrence)
1 (occurrence)
Rear End Crash type is rear-end 0 (nonoccurrence)
1 (occurrence) Co n tri b u tin g fa cto r
Obstacle Unexpected obstacle on the road (for at least one driver
involved)
0 (noninvolvement) 1 (involvement)
Excessive speed Before crash and for the prevailing conditions, at least one
driver involved exceeding speed
0 (noninvolvement) 1 (involvement)
Vertical signs Disregard for vertical road signs (for at least one driver
involved)
0 (noninvolvement) 1 (involvement)
Safety distance Disregard for safety distances (for at least one driver
involved) 0 (noninvolvement) 1 (involvement) Driv er ag e g ro u
p Young Drivers under 25 years old 0 (noninvolvement)
1 (involvement)
Middle Driver aged between 25 and 64 years old 0 (noninvolvement)
1 (involvement)
Elderly Drivers over 64 years old 0 (noninvolvement)
1 (involvement) Ex p la n ato ry v ariab les
Urban Urban environment 0 (No) / 1 (Yes)
HV involved Heavy vehicle involved 0 (No) / 1 (Yes)
Moto involved Motorcycle involved 0 (No) / 1 (Yes)
Driver action Before crash, at least one driver involved is running
straightly
0 (No) / 1 (Yes)
Excessive speed Before crash and for the prevailing conditions, at least one
driver involved exceeding speed
0 (No) / 1 (Yes)
Obstacle Unexpected obstacle on the road (for at least one driver
involved)
0 (No) / 1 (Yes)
Vertical signs Disregard for vertical road signs (for at least one driver
involved)
0 (No) / 1 (Yes)
Safety distance Disregard for safety distances (for at least one driver
involved)
0 (No) / 1 (Yes)
Speed limit Posted speed limit ≥90km/h 0 (No) / 1 (Yes)
Intersection Under the influence of intersection 0 (No) / 1 (Yes)
Horizontal design The road geometric design is straight (not curved) 0 (No) / 1 (Yes)
Vertical design The road geometric design is level (not grade) 0 (No) / 1 (Yes)
Pav grip conditions Grip condition corresponding to a clean and dry pavement 0 (No) / 1 (Yes)
Luminosity Daylight 0 (No) / 1 (Yes)
Weather Clear 0 (No) / 1 (Yes)
Alcohol Alcohol involved (Blood Alcohol Content ≥ 0,5g/l) 0 (No) / 1 (Yes)
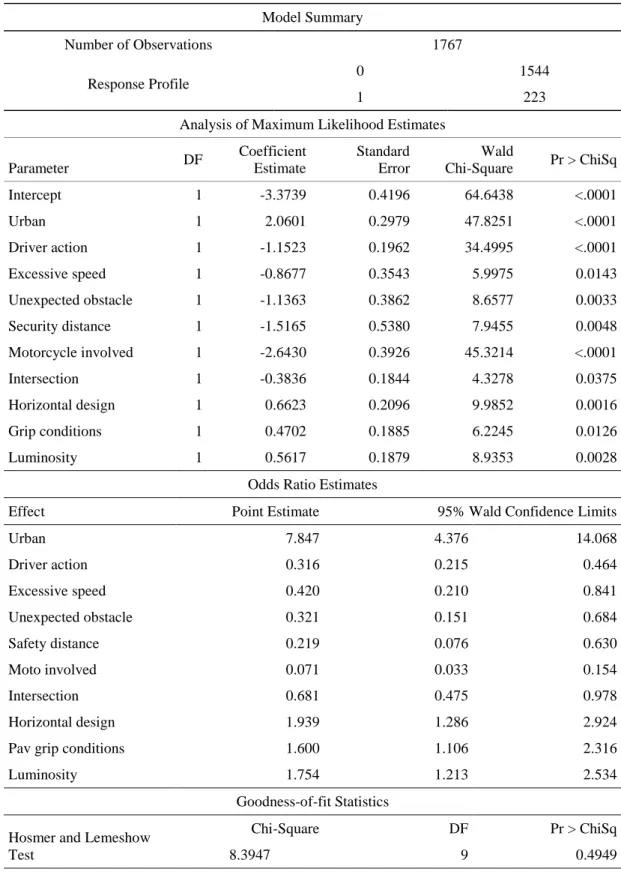
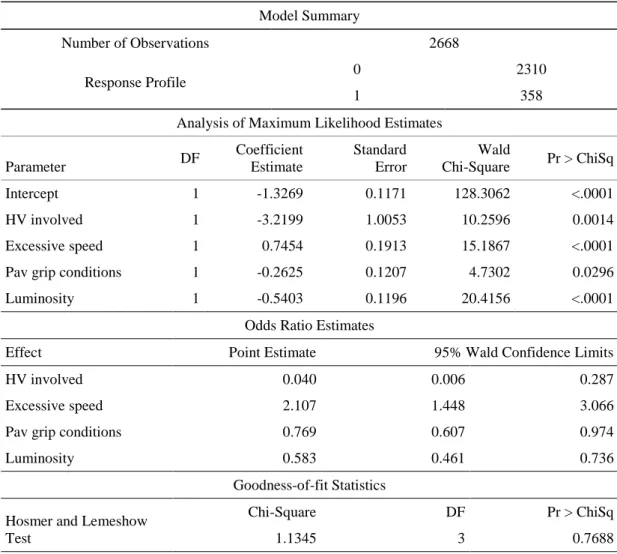
Tables 2 to 4 presents the results of three of the eleven models developed, namely for pedestrian crashes, excessive speed and young drivers (under 25 years old).
5
Table 2: Estimated parameters for the Pedestrian Crash Model Model Summary
Number of Observations 1767
Response Profile 0 1544
1 223
Analysis of Maximum Likelihood Estimates
Parameter DF Coefficient Estimate Standard Error Wald Chi-Square Pr > ChiSq Intercept 1 -3.3739 0.4196 64.6438 <.0001 Urban 1 2.0601 0.2979 47.8251 <.0001 Driver action 1 -1.1523 0.1962 34.4995 <.0001 Excessive speed 1 -0.8677 0.3543 5.9975 0.0143 Unexpected obstacle 1 -1.1363 0.3862 8.6577 0.0033 Security distance 1 -1.5165 0.5380 7.9455 0.0048 Motorcycle involved 1 -2.6430 0.3926 45.3214 <.0001 Intersection 1 -0.3836 0.1844 4.3278 0.0375 Horizontal design 1 0.6623 0.2096 9.9852 0.0016 Grip conditions 1 0.4702 0.1885 6.2245 0.0126 Luminosity 1 0.5617 0.1879 8.9353 0.0028
Odds Ratio Estimates
Effect Point Estimate 95% Wald Confidence Limits
Urban 7.847 4.376 14.068 Driver action 0.316 0.215 0.464 Excessive speed 0.420 0.210 0.841 Unexpected obstacle 0.321 0.151 0.684 Safety distance 0.219 0.076 0.630 Moto involved 0.071 0.033 0.154 Intersection 0.681 0.475 0.978 Horizontal design 1.939 1.286 2.924
Pav grip conditions 1.600 1.106 2.316
Luminosity 1.754 1.213 2.534
Goodness-of-fit Statistics Hosmer and Lemeshow
Test
Chi-Square DF Pr > ChiSq
8.3947 9 0.4949
The model obtained for pedestrian crashes (Table 2) predicts the probability of the occurrence of this type of crash (Pedestrian=1) with 10 predictors: Urban, Driver action, Excessive speed, Unexpected obstacle, Safety distance, Moto involved, Intersection, Horizontal design, Pavement grip conditions and Luminosity. In a total of 1767 work zone crashes, 223 occurred by a pedestrian crash. It can be seen from Table 2 that the probability of crash occurrence in urban areas is almost 8 times (7.847) greater than the nonoccurrence and that straight road
6
geometric design, clean and dry pavement and daylight have also a positive impact on the occurrence of pedestrian crashes.
The model also shows that the probability of pedestrian crash occurrence will be decreased when vehicles are going straight, the excess of speed and no safety distance is verified and when unexpected obstacles on the pavement, motorcycle or intersection are present (OR<1).
Table 3: Estimated parameters for the Excessive Speed Model Model Summary
Number of Observations 1767
Response Profile 0 1604
1 163
Analysis of Maximum Likelihood Estimates
Parameter DF Coefficient Estimate Standard Error Wald Chi-Square Pr > ChiSq Intercept 1 -1.0829 0.2592 17.4564 <.0001 Driver action 1 -0.7948 0.2181 13.2850 0.0003 Speed limit 1 1.3057 0.2301 32.2117 <.0001 Horizontal design 1 -0.6355 0.1743 13.2906 0.0003 Luminosity 1 -0.3718 0.1738 4.5793 0.0324
Odds Ratio Estimates
Effect Point Estimate 95% Wald Confidence Limits
Driver action 0.452 0.295 0.693
Speed limit 3.690 2.351 5.793
Horizontal design 0.530 0.376 0.745
Luminosity 0.689 0.490 0.969
Goodness-of-fit Statistics Hosmer and Lemeshow
Test
Chi-Square DF Pr > ChiSq
3.8256 3 0.2809
For the excessive speed model, the probability of the occurrence of a crash involving this contributing factor (Excessive speed=1) is predicted with 4 predictors: Driver action, Speed limit, Horizontal design, and Luminosity. In a total of 1767 work zone crashes it was found that at least one driver involved practiced speeding in 163 crashes. Model results indicate a higher probability of occurrence of this type of accident in highways (3.69 times greater than the nonoccurrence), as expected, since the geometric conditions of the road favor high-speed driving. The probability of crashes due to high-speed driving will be decreased when at least one driver involved is running straightly, daylight is present and the horizontal design of the road is straight.
7
Table 4: Estimated parameters for Young Drivers Model
Model Summary
Number of Observations 2668
Response Profile 0 2310
1 358
Analysis of Maximum Likelihood Estimates
Parameter DF Coefficient Estimate Standard Error Wald Chi-Square Pr > ChiSq Intercept 1 -1.3269 0.1171 128.3062 <.0001 HV involved 1 -3.2199 1.0053 10.2596 0.0014 Excessive speed 1 0.7454 0.1913 15.1867 <.0001
Pav grip conditions 1 -0.2625 0.1207 4.7302 0.0296
Luminosity 1 -0.5403 0.1196 20.4156 <.0001
Odds Ratio Estimates
Effect Point Estimate 95% Wald Confidence Limits
HV involved 0.040 0.006 0.287
Excessive speed 2.107 1.448 3.066
Pav grip conditions 0.769 0.607 0.974
Luminosity 0.583 0.461 0.736
Goodness-of-fit Statistics Hosmer and Lemeshow
Test
Chi-Square DF Pr > ChiSq
1.1345 3 0.7688
In a total of 2668 drivers involved in work zone crashes, 358 are young aged (with less than 25 years old). For the Young Drivers model, four predictors were selected from the initial set of explanatory variables: Heavy vehicle involved, Excessive speed, Pavement grip conditions and Luminosity (see Table 4). Excessive speed is the most significant contributing factor for crashes involving young drivers, with a probability of occurrence more than 2 times greater when compared with other age groups. The involvement of heavy vehicles, the presence of daylight and a clean and dry pavement have a negative impact in crashes involving these drivers.
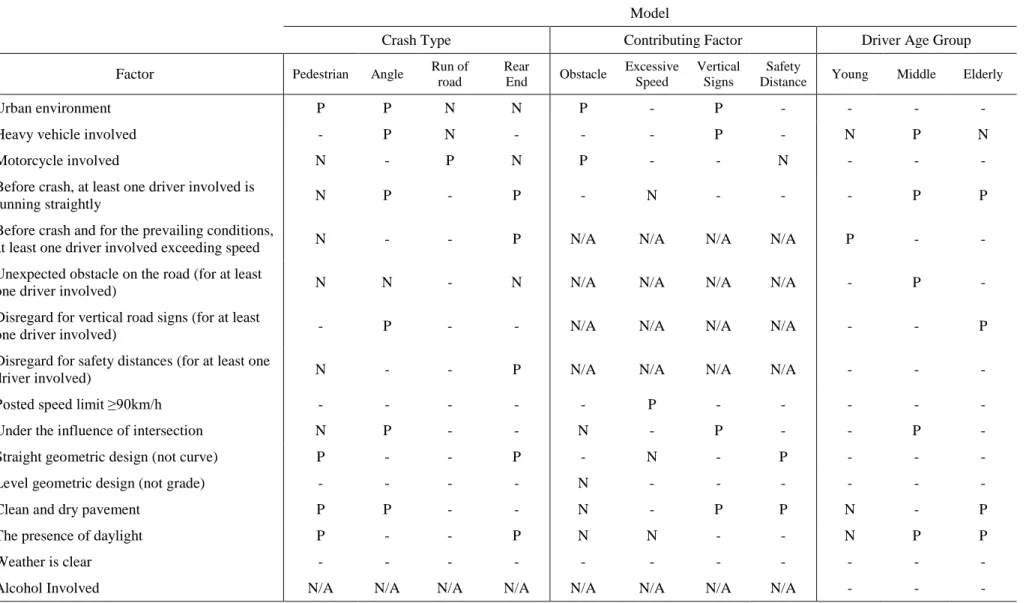
For an overall assessment, a summary of the impacts of predictors on the probability of the crash occurrence for the 11 models developed is presented in Table 5. In the table, columns indicate different models and rows denote explanatory variables. Cells filled with the letter “P” (positive) indicates that the factor has a significant impact on the occurrence of work zone accident. When the letter “N” (negative) is present, the impact is likely to decrease the probability.
4. Discussion
Regarding the factor impact analysis related to the type of crash predict models, the factors urban environment (as expected), straight geometric design, conditions of clean and dry pavement and the presence of daylight, are more likely to increase the probability of pedestrian crashes. For angle crashes, the opportunity of crash occurrence rises with factors like urban environment, the involvement of a heavy vehicle, running straightly, disregarding the vertical road signs, conditions of clean and dry pavement and under the influence of an intersection (where there are the greatest conflicts between traffic flows with different traffic directions). The probability of occurrence of rear-end crashes increases with motorcycle involvement and for no heavy vehicle involvement or urban environment. Finally, rear-end crashes easily occur when vehicles are running straightly and exceeding speed, for drivers who disrespect the safety distances, roads with straight geometric design and in the presence of daylight.
8
Table 5: Impact of Factors
Model
Crash Type Contributing Factor Driver Age Group
Factor Pedestrian Angle Run of
road Rear End Obstacle Excessive Speed Vertical Signs Safety
Distance Young Middle Elderly
Urban environment P P N N P - P - - - -
Heavy vehicle involved - P N - - - P - N P N
Motorcycle involved N - P N P - - N - - -
Before crash, at least one driver involved is
running straightly N P - P - N - - - P P
Before crash and for the prevailing conditions,
at least one driver involved exceeding speed N - - P N/A N/A N/A N/A P - -
Unexpected obstacle on the road (for at least
one driver involved) N N - N N/A N/A N/A N/A - P -
Disregard for vertical road signs (for at least
one driver involved) - P - - N/A N/A N/A N/A - - P
Disregard for safety distances (for at least one
driver involved) N - - P N/A N/A N/A N/A - - -
Posted speed limit ≥90km/h - - - P - - - - -
Under the influence of intersection N P - - N - P - - P -
Straight geometric design (not curve) P - - P - N - P - - -
Level geometric design (not grade) - - - - N - - - -
Clean and dry pavement P P - - N - P P N - P
The presence of daylight P - - P N N - - N P P
Weather is clear - - - -
Alcohol Involved N/A N/A N/A N/A N/A N/A N/A N/A - - -
9
From the analysis performed for the four main contributing factors, it can be concluded that the probability of the occurrence of work zone fatal crashes due to the presence of an unexpected obstacle on the road increases in urban work zones and with the involvement of a motorcycle. It also can be concluded that the probability of work zone crashes involving excessive speed is increased when work zones are located in freeways (posted speed limit ≥90km/h), with the absence of daylight and when vehicles are not running straightly. With respect to the disregard for vertical road signs model, and as expected, the opportunity of crash occurrence rises with factors like urban environment, heavy vehicle involvement and the presence of an intersection. Clean and dry pavement conditions have also a positive impact on the occurrence of crashes. A straight horizontal geometric design (not curve) and good grip pavement conditions have positive impacts in the occurrence of crashes involving the disregard for safety distances.
Regarding the driver’s age group models, the estimation results obtained point to speeding as the factor that is more likely to increase the probability of a young driver being involved in work zone crashes, but the probability does not increase due to heavy vehicle involvement, the presence of daylight or good grip conditions of the pavement. For the middle age group, the factors heavy vehicle involvement, running straightly, the presence of an intersection or an unexpected obstacle on the road and daylight conditions are likely to increase the probability of work zone crash occurrence. Lastly, the opportunity of crash occurrence for crashes with the involvement of an elderly driver increases when drivers are running straightly and disregarding the vertical road signs, for conditions of clean and dry pavement and the presence of daylight.
In an overall analysis, considering the 11 models and 16 predictors, it is possible to verify that the factors with positive impact in a larger number of models (5 to 4 models) are “Urban environment”, “Before crashing, at least one driver involved is running straightly”, “Clean and dry pavement” and “The presence of daylight”. These results demonstrated, as expected, that clear and dry pavement, daylight conditions on straight roadways and the urban environment (higher traffic volumes and conflict situations) are more conducive to work zone crashes. With positive impact in 3 models is the “Heavy vehicle involved”, the “Straight geometric design (not curve)” and “Under the influence of an intersection”. The factors that did not have any positive or negative impact in any model were “Level geometric design (not grade)” and “Weather is clear”.
5. Conclusions
The first important conclusion that can be drawn from this research is that the official data available in Portugal can be used, after treatment, in the definition of work zone crash predictive models, namely, in the definition of binary logistic regression models.
However, the gaps identified in this study related to the information collected and recorded by the police authorities, such as the lack of exposure data and proper completion of reports, limits the analysis and the understanding of the results obtained. For instance, about 23% of reports have no clear information on the presence or absence of this type of crashes, which points to the possibility that the real percentage of work zone crashes may be higher than the obtained one (about 2%).
Having in account these findings, a more complete and clear record of information on work zone crashes should be promoted to allow a more representative and reliable perception of the causes and factors involved in these type of crashes, as well as the evolution to more sophisticated approaches.
Binary logistic regression was used in the analysis of crash data since it allows the simultaneous analysis of multiple explanatory variables, reduce the effect of confounding factors and the interpretation of results in terms of odds ratios can be easier to perform when compared with the interpretation of coefficients. However, attention must be pay to the model building, since some decisions will depend entirely on the expertise of researcher on the field.
Despite the data limitations mentioned, the binary logistic models developed allowed to examine the influence of various factors on the occurrence of specific work zone crashes providing a more comprehensive understanding of the major causal factors involved.
For example, from the models obtained it can be concluded that speeding is a factor with significant impact in rural roads, especially in those with high posted speeds. These findings point to the need for more careful management of the traffic speed in rural roadwork areas. This can be accomplish through the consideration of solutions that help achieve the appropriate speed in accordance with the roadwork type. For urban roadwork areas, the results point to the need for a more careful treatment of work zones near intersections and a more careful delimitation and signaling of work areas. Good conditions of geometric design, pavement state and visibility have positive impacts in a significant number of models, both in urban and rural environment.
10
As a final remark it can be said that the results obtained, together with the characteristics and major contributing factors identified in the descriptive analysis, can help traffic engineers to implement proper measures for minimizing the probability of work zone crashes.
Acknowledgment
The authors would like to thank ANSR – Autoridade Nacional de Segurança Rodoviária (Portuguese Authority for Road Safety) for its assistance with the collection of data, and CERIS-CESUR and University of Beira Interior for supporting the studies performed.
References
1. Analysis of crashes at active night work zones. Ullman, G. L., Ullman, B. R. en Finley, M. D. Washington : Transportation Research Board, 2006. Proceedings of the TRB 85th Annual Meeting.
2. A probabilistic quantitative risk assessment model for the long-term work zone crashes. Meng, Q., Weng, J. en Qu, X. 2010, Accident Analysis and Prevention, 42 (6), pp. pp. 1866–1877.
3. Silverstein, Claire, Schorr, Justin en Hamda, Samer. Work zones versus nonwork zones: Risk factors leading to rear-end and sideswipe collisions. Journal of Transportation Safety & Security. Taylor & Francis, 2016, Vol. 8, 4.
4. FORMAT. Fully Optimised Road Maintenance - project. Final technical report. Delft : Project funded by the European Community, 2005.
5. ARROWS. Advanced Research on Road Work Zone Safety Standards in Europe – Project - Deliverable 4, Vol. II, Road Work Zone Safety Practical Handbook. Athens : Project funded by the European Community, 1998.
6. Analytic methods in accident research: Methodological frontier and future directions. Mannering, F. en Bhat, C. sl : Elsevier, 2014, Analytic methods in accident research, Vol. 1, pp. 1-22. ISSN 2213-6657.
7. Work Zone Safety Analysis and Modeling: A State of the Art Review. Yang, H., et al. 4, sl : Taylor & Francis, 2015, Traffic Injury Prevention.
8. Lu, J., Wang, Z. en Wang, X. Integrated work zone safety management system and analysis tools. Florida : Florida Department of Transportation, 2008. Final Report. Contract No: BD544-26.
9. Pigman, J. en Agent, K. Analysis of accidents in construction and maintenance work zones. Frankfort : Kentucky Transportation Research Program, 1988. Research Report.
10. Distribution and characteristics of crashes at different locations within work zones in Virginia. Garber, N. en Zhao, M. 2002, Journal of the Transportation Research Board.
11. Bai, Y. en Li, Y. Final Report: Determining major causes of highway work zone accidents in Kansas. Kansas : Kansas Department of Transportation and University of Kansas, 2006.
12. Effectiveness of temporary traffic control measures in highway work zones. Li, Y. en Bai, Y. 2009, Safety Science, Vol. 47, pp. pp. 453-458.
13. Trafikverket. Plötsligt var det ett vägarbete! En studie av trafikolyckor vid vägarbeten 2003-2009 med speciellt fokus på upphinnandeolyckor. 2011.
14. Driving Speed Behaviour Approaching Road Work Zones On Two-Lane Rural Roads. Perco, P. en Dean, S. 2012, Procedia - Social and Behavioral Sciences, Volume 53, pp. pp. 672–681.