O USO ASSIMÉTRICO DE INCENTIVOS EM PORTUGAL:
O EXEMPLO DO PRIME
Purificacíon Vicente Galindo Teresa de Noronha Vaz Paulo Neto
AbSTRACT
PRIME has been between 2000 and 2006 a commonly used public policy instrument. Although nationally promoted, it served the diffusion of European funds across the entrepreneurial tissue. In this paper we intend to follow the application of this instrument for a monitoring and strategic evaluation of policy support system to companies’; in particularly, the analyses at regional scale can identify some eventual hindrances to success.
Methodologically, we have observed the financing execution of 14910 projects, collected from the official information portal of PRIME in Portugal. Due to limitations related to the information sources of the portal our study deals with a reduced number of variables: project location, year, industrial activity, financial program, NUT, district, investment and incentive. Nevertheless, the application of HOMALS, Cluster and Correspondence Analyses was possible, allowing conclusions about the level of effectiveness of PRIME across, both, location and sectors levels.
Keywords: Public Policy, Portugal PRIME Program, Cluster Analysis, Firm Support Incentive, Multivariate Analysis
RESUMO
Entre 2000 e 2006 o programa PRIME foi usado como um instrumento político público comum. Apesar de ter sido promovido a nível nacional, serviu também como difusor dos fundos europeus entre o tecido empresarial. O objectivo deste artigo é monitorizar a aplicação deste instrumento de forma a avaliar estrategicamente o sistema das políticas de apoio às empresas, focando a análise com base numa escala regional de forma a identificar alguns eventuais impedimentos para o sucesso das empresas.
Metodologicamente observámos a execução financeira de 14910 projectos com informação recolhida do portal oficial do programa PRIME em Portugal. Devido a limitações relacionadas com a informação obtida neste portal, o nosso estudo lida com um número reduzido de variáveis, sendo as seguintes: localização do projecto, ano, actividade industrial, programa financiador, NUT, distrito, investimento e incentivo. No entanto foi possível a aplicação do HOMALS, Cluster e Correspondentes Análises, permitindo conclusões sobre o nível de eficácia do PRIME, incluindo localização e nível de sectores.
Palavras-chave: Política Pública, Programa PRIME Português, Análise de Clusters, Incentivo de Apoio às Empresas, Análise Multivariada.
1. INTRoduCTIoN ANd THeoReTICAl FRAMING
History has made from any spatial context a living organism with memory, action and reactive capacity. We could argue that there is an intelligent attitude in each territory to absorb external inputs or supports in a continuous process of change. Some call it “path dependency”, others the historical context. This simple, but very complex, fact may determine the dynamics of local development. Due to this complexity, frequently, the conditions for growth are restrictive and, in spite of the multiple public policies, regions keep gapping. Most of the world regions could serve as an example, but we shall observe the particular case of Portugal. Its peripheral location in southern Europe, its distance from the dominant global trade flows, as well as its lack of strategically located mega-towns should justify a major interest in analysing how the country used the great quantity of European financial supports that resulted from its integration as a full member of the European Union, twenty years ago.
Thus, the major goal of this paper is to evaluate the level of effectiveness of those efforts made by the European Commission towards the socio-economic cohesion in Europe by using the single case-study of the application of PRIME in Portugal. PRIME is one of the best example support system because it has been indirectly financed by European founds while fully structured as a Portuguese policy instrument for support to the modernization of the entrepreneurial tissue.
Further than the goal earlier pointed out, this paper has a dual aim: firstly, to supply an exploratory survey on the patterns of asymmetric use of the financing systems provided by the E.C. and, secondly, to emphasize the north/south endemic dichotomy existing in the country – a path dependence trend that should concern Portuguese policy makers deeper then it does.
Literature indicates that multiple major driving forces of economic growth have excited economists during the last fifty years. Firstly, Harrod (1939) and Domar (1946) emphasized savings, population and capital as the exogenous determinants responsible for the long-term growth of the economy. Later, Solow (1956) proved that the increases in national savings could, indeed create per capita real income but stressed that continuous growth would only be possible if technological progress would occur. Further contributions to long run growth were made by Arrow (1962) by introducing “learning-by-doing” as a determinant of technological development, Lucas (1988) by including the growth rate of human capital as a factor of technical change and long run growth, and Romer (1986 and 1990) who demonstrated the role of research training in the technological change. But, for a long time the impact of growth as motor of asymmetric or non-asymmetric development was not a source of concern. However, when further studies related to the spill-over effects resulting from growth were discussed (Marshall-Arrow-Romer model by Acs and Audretsch, 1984 and Acs, 2002) local impacts took relevance. Namely, as the output of technological innovation seems to result from knowledge inputs (technology and/or entrepreneurship) then, both, local and regional dimensions are crucial (Fagerberg, 2003, 2004). The most updated growth theories accept the importance of micro and meso-economic levels of activities if growth is supposed to stay sustainable, pulling into entrepreneurship the major drivers of growth (Sogaard, 2009).
In spite of the many authors concerned with growth, development or sustainability, the particular case of those regions tending to a permanent gap in relation to others, more favoured ones, has not attracted much attention. However, political will and democratic equity justify the fairness of symmetric development among different regions and furthering the use of equal opportunities. Therefore, we can accept that there is a global goal that surpasses the historical tendencies and challenges those regions gapping to be supported in
finding those corrected choices to push them away from a spiralled movement of atrophy. For such regions target public policy is a must.
In spite of the different directions taken by policy makers, most of the public strategies for development, and corresponding policy proposals, are based in instruments able to promote increases in private investment, employment, regional production and knowledge spillover effects. It is trusted that these combined factors may generate growth and development, if possible sustainable, in gapping regions and there is hope that Europe will find the best solution for socio-economic convergence and regional cohesion.
But cohesion has not been the sole goal of European decision makers: Lisbon Agenda, in March 2000, defined the goal of making EU the strongest and most competitive economy by 2010. So that it can be understood that the need to increase regional capacities for global competition has defined a clear European wish much further from its scientific and technological potential skills. An overwhelming goal, challenging the recent European development trends, may include a major paradox between science and technology and regional and social cohesion: In fact, the application of the R & D policy brings to Europe the preference to those regions able to produce high-tech industries; Also, as the cohesion goals have lead to a considerable aid to scientific research, the relationship between this, the resulting technological advances and the regional development for periphery are still to be launched.
Some quite generic discussions have emerged from research agendas concerned with the notion of geographical space and concluding that its development is a matter of maturity of endogenous systems (Vazquez-Barquero, 2002). The introduction of time as a major factor of the territorial dynamics stresses a whole set of new drivers into the scene of policy making. Concepts such as “learning” and “interacting”, give origin to very consistent and original new approaches in which institutions, public, private or in public-private partnership became regulatory elements of individual and collective practices, the principal assets being therefore of a relational nature (Sierra, 1997). One of the main characteristics inherent to the territory is the proximity among socio-economic agents (Keeble, and Wilkinson (1999). But, whether or not the agents are able to benefit from this attribute depends on their own technological and social capacity to interact and co-operate – the concept of social capital considered as a consistent argument to favour development (Solow, 2000 and Durlauf, 2002).
Public policies should be able to provide the set of factors necessary to speed development, particularly in less favoured regions. Such regions face three types of hindrances to be surmounted: the location disadvantages, the lack of structural adjustments and need for political coherency at national, regional and sector levels (Vaz and Neto, 2005).
Most frequently public policies for regional development, implemented to increase the competitiveness of regional skills, come across targets for technological modernization, at national level, that strongly prejudice policy results. So, how far are the outcomes from the initial targets? The exact answers serve for evaluation of policy effectiveness of regional policy and should be provided by in deep monitoring of implemented programmes.
The next point of this paper follows the previous arguments using the case-study of Portuguese program PRIME.
2. ToolS FoR deVeloPMeNT IN euRoPe: THe PoRTuGueSe PRoGRAM PRIMe
PRIME1 - Incentives Programme for the Modernisation of Economic Activities was instituted
by the Resolution of the Council of Ministers no. 101/2003, after its formal approval by the European Commission in 2003. The program integrated a set of medium term economic policy instruments for the period 2000-2006 which have been applied to different economic activity sectors in Portugal.
The instrument was developed exclusively for the Industry, Energy, Building Industry, Transport, Tourism, and Trade and Services sectors. The Programme integrated in Area 2 of the Regional Development Plan – Adjusting the Production Profile towards the Activities
of the Future, and was designed to foster productivity and competitiveness of Portuguese firms, thereby promoting new development capabilities under the following goals: to ensure a generally sound competition environment, which may contribute to revitalise business structure, and to steam in firms research and development on new products and processes; to simplify procedures and stimulate de-regulation; to encourage the qualification of human resources by enhancing technical and scientific training thereby fostering productivity growth, through more motivating and rewarding tasks.
As such, PRIME was promoted along the following priority areas of strategic actions: Area 1 – Enterprise Stimulation; Area 2 – Qualification of Human Resources; Area 3 – Stimulation of the Business Environment. The two first Areas are dedicated to a direct intervention at firm level, and the third, of a more crosscutting nature, aims at stimulating business environment. The 29 support measures and incentives schemes at which the programme is structured are presented in the Annex 1.
The financial supports corresponding to PRIME Programme were non refundable incentive types and each support measure or incentive scheme aimed to generate new economic activities and to introduce a new competitive and innovative context to the Portuguese economy. The financial support approach of this Programme also included a risk capital fund and achievement bonus incentives.
PRIME was a public policy instrument driven to the promotion of economic activity in the Portuguese territory specially focused, but not exclusively, on small and medium size enterprises. Some of Programme support measures and incentives included as beneficiaries non profit organisations, municipalities, technological schools, business associative structures and technology-based incubator centres and parks.
As it was supporting a wide range of economic activity sectors the instrument was neither sector nor regional focused. The only exceptions were the URBCOM, MINING ZONES and HISTORIC INNS incentives schemes. As showed in the summary presented on Annex 2, the program did not use, as project selection criteria, the geographical localisation of the project proponent. Just in a few cases localization was a selection criterion: NITEC, SIED, SIPIE, Vocational Training, PITER and TTQ Infrastructures.
3. MeTHodoloGy FoR dATA ANAlySIS 3.1. Sampling and choice of variables
Our initial database contained 15307 records reported to 2007 data set. After a filter application based on NUTII clear identification the final database contains 14910 enterprises that received incentives during the period 2000-2006.
Following variables have been defined as active variables: i) Date, ii) Support, iii) Area of strategic action (EIXO), iv) Region (Nuts II) (North, Centre, Lisbon, Alentejo, Algarve, Açores and Madeira), v) District (Aveiro, Baja, Braga, Bragança, Castelo Branco, Coimbra, Évora, Faro, Guarda, Leiria, Lisboa, Portalegre, Porto, Santarém, Setúbal, Viana do Castelo, Viseu, Vila Real), vi) CAE, vii) Investment, viii) Incentive and ix) Ratio (between Investment and Incentive).
The categorical variables have been recoded to be suitable for the different statistical analyses. The date has been recoded to have the information per year and the variable CAE to capture the information of the first two digits.
Because more than the 50% of the incentives are directed to a few activity branches and in order to simplify the graphical and analytical interpretation of the results, our study is limited to the more frequent categories, grouping the rest under the label “Other”.
The variable Support has been recoded keeping the categories that contain more than 2% of the enterprises and grouping the rest as “other”. For the districts we have kept those that have more than 5% of the Projects.
Investment, Incentive and Ratio were considered as numerical variables, but taking into account the high dispersion, we have categorized them for some statistical analysis using the quartiles of its frequency distribution. See details in Annex 3.
3.2. Statistical methods
For each categorical variable the frequency distribution and an associated chart have been calculated. The association between each pair of categorical variables is tested using the chi-squared test. The association is considered statistically significant when the p-value is lower than 0.05. For each quantitative variable the mean, standard deviation, median and inter-quartile range are calculated. The last two statistics are usually preferred when a high dispersion is present in the data. To compare the means the independent-samples t test has been used and to compare medians the Mann-Whitney test.
3.2.1. Homogeneity analysis (HoMAlS)
Homogeneity Analysis is a interdependence statistical technique for graphic interpretation in several axis (Gifi, 1990). It converts categorical data into a graphical display by simultaneously quantifying the categorical variables and the projects; it captures the complex relations between both sets. We use HOMALS because the variables can have non-linear relations and because it is possible to find relations between categories, not only between variables. A three-dimensional Homals solution was computed for the set of nine variables (Year, Area, Nut, District, System, CAE, Investment, Incentive and Ratio) and 14910 projects, using SPSS.15. The Projects scores and category quantifications are mapped into the same (two or three dimensional) plot.
3.2.2 Cluster Analysis
We have used the numerical scores obtained from HOMALS, to create a K-means cluster analysis with the different projects.
3.2.3. Correspondence Analysis
In a third step, Correspondence Analysis is used to describe the relationships between the three clusters and each nominal variable, representing both in a low-dimensional space,
showing the relationships between the categories for each variable and the different clusters. For each variable, the distance between two category points in the plot reflects the similarity between the categories profiles, with categories sharing similar profiles plotted close to each other. The relationship between the variables can be described projecting category points for one of the variables onto the vector from the origin to a category point for the other variable. 4. ReSulTS
The following results are based on both univariate and multivariate analysis when adequate. 4.1 Projects typology
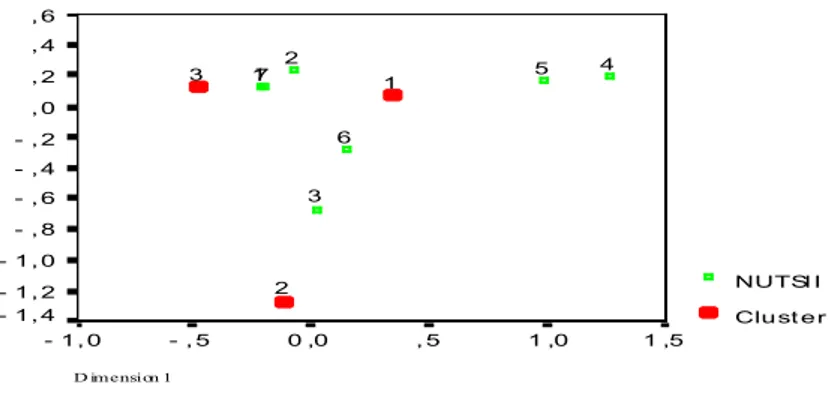
HOMALS´ solution
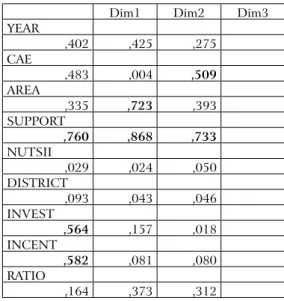
The HOMALS analysis selected three dimensions. The first dimension can be described as a dimension related to INVESTMENT, INCENTIVE and SUPPORTS. The second dimension was strongly dominated by AREA and the third dimension is related to EAC and SUPPORT, being these variables the most important in the analysis. See Table 1 below. HOMALS solution results in a scatter plot with a point representing each project. Setting the markers by Area clearly identifies three groups, each one related to an Area: the red one with the Area 1; the green one related to Area 2 and the cluster 3, in blue, related to Area 1 and Area 3.
Table 1 - discrimination measures per variable and per dimension
Dim1 Dim2 Dim3
YEAR ,402 ,425 ,275 CAE ,483 ,004 ,509 AREA ,335 ,723 ,393 SUPPORT ,760 ,868 ,733 NUTSII ,029 ,024 ,050 DISTRICT ,093 ,043 ,046 INVEST ,564 ,157 ,018 INCENT ,582 ,081 ,080 RATIO ,164 ,373 ,312
Figure 1 - HoMAlS map: two first dimensions
A k-means cluster analysis with the Project scores of the first three HOMALS dimensions was performed. We selected K= 3 clusters taking into account the HOMALS map shown above. Table 2 shows project agglomeration into the three clusters.
Table 2 - distribution of the Projects on the three clusters
Cluster from the HOMALS scores are closely related to the Areas. See Table 3 below. Most of the projects in the first cluster belong to Area 1, only 1.8% of the points belong to Area 2. Cluster 2 can be identified with Area 3 because only 10% belong to Area 1. Cluster 3 is a mixture of projects in Areas 1 and 2. More details can be seen below.
Table 3 - Characterization of the clusters using the Area of strategies action
Frequency Percent
Cluster 1 8356 57.25
Cluster 2 900 6.03
Cluster 3 5654 37.92
CluSTeR 1 CluSTeR 2 CluSTeR 3
AREA 1 Count 8202 90 3759 12051 % within Cluster 98,2% 10,0% 66,5% 80,8% AREA 2 Count 1868 1868 % within Cluster 33,0% 12,5% AREA 3 Count 154 810 27 991 % within Cluster 1,8% 90,0% 0,5% 6,6% Total Count 8356 900 5654 14910 100% 100% 100% 100% Dimension 1 2 1 0 - 1 - 2 - 3 Di m en si on 2 3 2 1 0 - 1 - 2 AREA AREA 3 AREA 2 AREA 1
Figure 2 - CA map for Cluster and Area
Model: Symmetrical normalization and distance Chi square
Correspondence Analysis for the cross-tabulation of clusters and areas, with 90% of the inertia accounted for the first two dimensions, highlights the previous conclusions in a more conclusive way. Cluster 1 can be identified with Area 1, Cluster 2 with Area 3 and Cluster 3 between Areas 1 and 2.
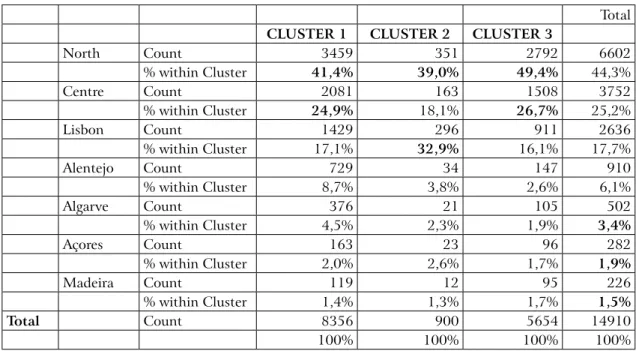
Table 4 - Cross Tabulation for Clusters and Regions
Total
CluSTeR 1 CluSTeR 2 CluSTeR 3
North Count 3459 351 2792 6602 % within Cluster 41,4% 39,0% 49,4% 44,3% Centre Count 2081 163 1508 3752 % within Cluster 24,9% 18,1% 26,7% 25,2% Lisbon Count 1429 296 911 2636 % within Cluster 17,1% 32,9% 16,1% 17,7% Alentejo Count 729 34 147 910 % within Cluster 8,7% 3,8% 2,6% 6,1% Algarve Count 376 21 105 502 % within Cluster 4,5% 2,3% 1,9% 3,4% Açores Count 163 23 96 282 % within Cluster 2,0% 2,6% 1,7% 1,9% Madeira Count 119 12 95 226 % within Cluster 1,4% 1,3% 1,7% 1,5% Total Count 8356 900 5654 14910 100% 100% 100% 100% Symmetrical Normalizati on D imension 1 4 3 2 1 0 - 1 Di me nsi on 2 3 ,0 2 ,5 2 ,0 1 ,5 1 ,0 ,5 0 ,0 - ,5 - 1,0 AREA Cluster 3 2 1 3 2 1
4.2. Factor Analyses by location CLUSTER: NUTS
The distribution of the clusters is not homogeneous among the regions (p < 0.001).
Figure 3 - CA map for Cluster and NuTS
Model: Symmetrical Normalization and distance Chi square.
Cluster 1, identified with Area 1, has more projects from the Centre and North regions. More than 66% of the projects of this cluster belong to those regions. Lisbon is also important but with a lower percent. See table below. Cluster 2, identified in the previous step with Area 3 (Stimulation of the Business Environment), has a 72% of projects from the North and Lisbon. Cluster 3, identified with Area 2 (Qualification of Human Resources) has a 76% of projects from North and Central Portugal.
See more details on the Table 5, above. The correspondent CA for the cross-tabulation of clusters and regions highlights the previous conclusions.
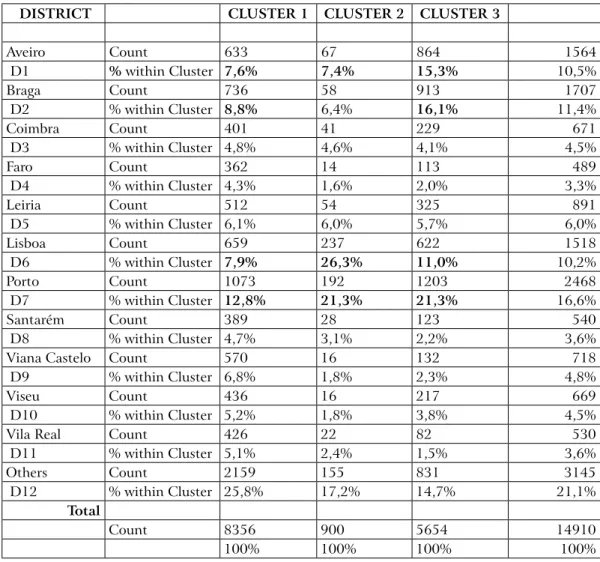
CLUSTER: DISTRICT
The cross-tabulation of the clusters and districts is shown in the next table. The distribution of the districts is not homogeneous among clusters (p< 0.001). From the table, we can state that Cluster 3 has projects from Aveiro, Braga and Porto, the Cluster 2 from Lisbon and Porto, and the Cluster 1 has a similar percentage from all the districts, see Table 5, below.
S ymmetrical Normalization D imension 1 1 ,5 1 ,0 , 5 0 ,0 - , 5 - 1, 0 Dim ens ion 2 , 6 , 4 , 2 , 0 - , 2 - , 4 - , 6 - , 8 - 1, 0 - 1, 2 - 1, 4 NUTSI I Clust er 7 6 5 4 3 2 1 3 2 1
Table 5 - distribution of frequencies for Cluster and district
The CA map corroborates the previous conclusions: the majority of the points in cluster 3 is from districts D1, D2 and D7; in Cluster 2 from district D6 and Cluster 1 is on the centroid of all the rest.
Figure 4 - CA map for Cluster and district.
Model: Symmetrical Normalization and distance Chi square. Symmetrical Normalization 1,0 ,8 ,6 ,4 ,2 0 ,0 - ,2 - ,4 - ,6 - ,8 Di m en sio n 2 1 ,0 ,5 0 ,0 - ,5 - 1,0 - 1,5 Di stric t Cluster 1 2 1 1 1 0 9 8 7 6 5 4 3 2 1 3 2 1
dISTRICT CluSTeR 1 CluSTeR 2 CluSTeR 3
Aveiro Count 633 67 864 1564 D1 % within Cluster 7,6% 7,4% 15,3% 10,5% Braga Count 736 58 913 1707 D2 % within Cluster 8,8% 6,4% 16,1% 11,4% Coimbra Count 401 41 229 671 D3 % within Cluster 4,8% 4,6% 4,1% 4,5% Faro Count 362 14 113 489 D4 % within Cluster 4,3% 1,6% 2,0% 3,3% Leiria Count 512 54 325 891 D5 % within Cluster 6,1% 6,0% 5,7% 6,0% Lisboa Count 659 237 622 1518 D6 % within Cluster 7,9% 26,3% 11,0% 10,2% Porto Count 1073 192 1203 2468 D7 % within Cluster 12,8% 21,3% 21,3% 16,6% Santarém Count 389 28 123 540 D8 % within Cluster 4,7% 3,1% 2,2% 3,6%
Viana Castelo Count 570 16 132 718
D9 % within Cluster 6,8% 1,8% 2,3% 4,8%
Viseu Count 436 16 217 669
D10 % within Cluster 5,2% 1,8% 3,8% 4,5%
Vila Real Count 426 22 82 530
D11 % within Cluster 5,1% 2,4% 1,5% 3,6% Others Count 2159 155 831 3145 D12 % within Cluster 25,8% 17,2% 14,7% 21,1% Total Count 8356 900 5654 14910 100% 100% 100% 100%
4.3. Factor Analyses by time CLUSTER: YEAR
The Incentives in this study correspond to projects presented between the years
2000 and 2006. The distribution of the incentives for the different years is not
homogeneous. See table and chart below.
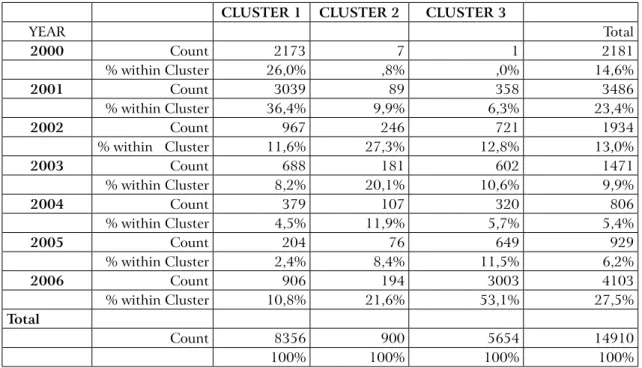
Table 6 - Project distribution, by year.
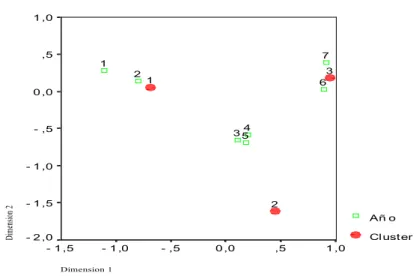
The CA for Cluster and year corroborates the conclusions (figure below). The solution accounts for the 92% of inertia. The symmetric normalization model has been chosen.
Figure 5 - First principal plane of the CA for Cluster and year
The factorial plot shows how the first two years stimulate the projects in Cluster 1 (Area 1), while the last years stimulate the projects in Cluster 3 (area 2). The same information is more detailed on the following Table 7.
Symmetrical Normalization Dimension 1 1 ,0 ,5 0 ,0 - ,5 - 1 ,0 - 1 ,5 Di me nsi on 2 1 ,0 ,5 0 ,0 - ,5 - 1 ,0 - 1 ,5 - 2 ,0 Añ o Cluster 7 6 54 3 2 1 3 2 1
YEAR Frequency Percent
2000 2181 14,6 2001 3486 23,4 2002 1934 13,0 2003 1471 9,9 2004 806 5,4 2005 929 6,2 2006 4103 27,5 N Total 14910 100,0
Table 7 - distribution of frequencies for Clusters and years. p-value for Chi square test < 0.01
4.4. Factor Analyses by sector CLUSTER: EAC2
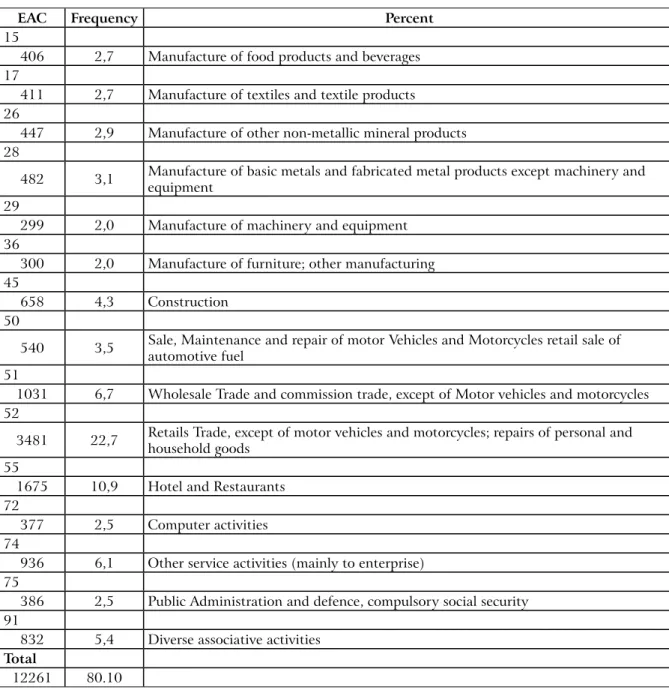
80% of the projects of the PRIME Program, during the 7 years studied, are concentrated in the activities shown in the next table and 50% in only 5 (EAC 51, EAC 52, EAC 55, EAC 74 y EAC 91). This is why we have considered only the 5 most representative activities for the multivariate study.
2 EAC – corresponding to the Portuguese Economic Activity Classification used in the national accounts, meaning the activity branches and
CluSTeR 1 CluSTeR 2 CluSTeR 3
YEAR Total 2000 Count 2173 7 1 2181 % within Cluster 26,0% ,8% ,0% 14,6% 2001 Count 3039 89 358 3486 % within Cluster 36,4% 9,9% 6,3% 23,4% 2002 Count 967 246 721 1934 % within Cluster 11,6% 27,3% 12,8% 13,0% 2003 Count 688 181 602 1471 % within Cluster 8,2% 20,1% 10,6% 9,9% 2004 Count 379 107 320 806 % within Cluster 4,5% 11,9% 5,7% 5,4% 2005 Count 204 76 649 929 % within Cluster 2,4% 8,4% 11,5% 6,2% 2006 Count 906 194 3003 4103 % within Cluster 10,8% 21,6% 53,1% 27,5% Total Count 8356 900 5654 14910 100% 100% 100% 100%
Table 8 - distribution of PRIMe funds by activity branch (eAC)
The next table shows the cross-tabulation of the clusters and the activities. The projects in Cluster 1 are mainly in Activity 52; projects in Cluster 2 in Activity 91. The Cluster 3 is associated to the category “Others”, that includes several activities representing much lower percents than the ones that are explicitly listed in the table and have much higher frequencies. More detailed information can be shown in the following table.
eAC Frequency Percent
15
406 2,7 Manufacture of food products and beverages
17
411 2,7 Manufacture of textiles and textile products
26
447 2,9 Manufacture of other non-metallic mineral products
28
482 3,1 Manufacture of basic metals and fabricated metal products except machinery and equipment
29
299 2,0 Manufacture of machinery and equipment
36
300 2,0 Manufacture of furniture; other manufacturing
45
658 4,3 Construction
50
540 3,5 Sale, Maintenance and repair of motor Vehicles and Motorcycles retail sale of automotive fuel
51
1031 6,7 Wholesale Trade and commission trade, except of Motor vehicles and motorcycles
52
3481 22,7 Retails Trade, except of motor vehicles and motorcycles; repairs of personal and household goods
55
1675 10,9 Hotel and Restaurants
72
377 2,5 Computer activities
74
936 6,1 Other service activities (mainly to enterprise)
75
386 2,5 Public Administration and defence, compulsory social security
91
832 5,4 Diverse associative activities
Total
Table 9 - distribution of the different activities within the clusters p-value for the Chi square test < 0.01
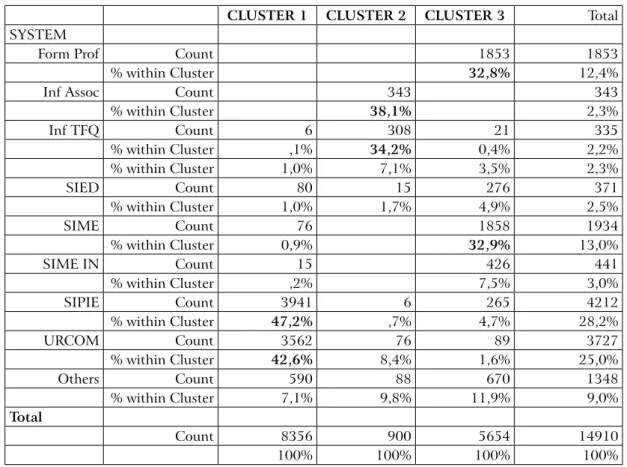
Table 10 - distribution of the different Systems within the clusters p-value for the Chi square test < 0.01
CluSTeR 1 CluSTeR 2 CluSTeR 3 Total
SYSTEM
Form Prof Count 1853 1853
% within Cluster 32,8% 12,4%
Inf Assoc Count 343 343
% within Cluster 38,1% 2,3% Inf TFQ Count 6 308 21 335 % within Cluster ,1% 34,2% 0,4% 2,2% % within Cluster 1,0% 7,1% 3,5% 2,3% SIED Count 80 15 276 371 % within Cluster 1,0% 1,7% 4,9% 2,5% SIME Count 76 1858 1934 % within Cluster 0,9% 32,9% 13,0% SIME IN Count 15 426 441 % within Cluster ,2% 7,5% 3,0% SIPIE Count 3941 6 265 4212 % within Cluster 47,2% ,7% 4,7% 28,2% URCOM Count 3562 76 89 3727 % within Cluster 42,6% 8,4% 1,6% 25,0% Others Count 590 88 670 1348 % within Cluster 7,1% 9,8% 11,9% 9,0% Total Count 8356 900 5654 14910 100% 100% 100% 100% Total
CluSTeR 1 CluSTeR 2 CluSTeR 3
EAC51 Count 609 383 992 % within Cluster 7,3% 6,8% 6,7% eAC52 Count 3302 1 150 3453 % within Cluster 39,5% ,1% 2,7% 23,2% EAC55 Count 1380 13 275 1668 % within Cluster 16,5% 1,4% 4,9% 11,2% EAC74 Count 464 110 294 868 % within Cluster 5,6% 12,2% 5,2% 5,8% eAC91 Count 107 549 96 752 % within Cluster 1,3% 61,0% 1,7% 5,0% eAC Others Count 2494 227 4456 7177 % within Cluster 29,8% 25,2% 78,8% 48,1% Count 8356 900 5654 14910
4.5. Factor Analyses by support system CLUSTER: SYSTEM
The characterization of the clusters is also very clear in this case: Cluster 1 is associated to the categories SIPIE (Incentive Scheme for Small Business Initiatives) and URCOM (Incentive Scheme for Commercial Urbanism Projects), Cluster 2 to Infrastructures and Associative Infrastructures (Support to the Existing Associative Infrastructures) and Cluster 3 to SIME (Incentive Scheme for Business Modernisation). See details in the above Table 10.
4.6. Cross effects
CLUSTER: INVESTMENT AND INCENTIVE
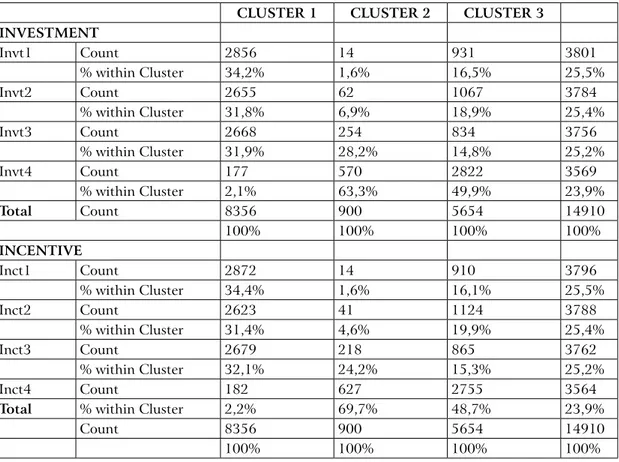
The next two tables contain the cross-tabulation of the clusters with the Investment and the Incentive. Both numerical variables have been coded into four categories using the percentiles 25, 50 and 75 as cut points. It can be deduced from the tables that the patterns are very similar for both variables: Cluster 1 is associated to investments/incentives evenly distributed among the first three categories. The projects in Cluster 2 receive higher incentives in categories 3 and 4 but with higher frequencies in category 4. Cluster 3 is characterized by the higher investments/incentives.
Table 11 - distribution of frequencies according to Investment and Incentive
CluSTeR 1 CluSTeR 2 CluSTeR 3
INVeSTMeNT Invt1 Count 2856 14 931 3801 % within Cluster 34,2% 1,6% 16,5% 25,5% Invt2 Count 2655 62 1067 3784 % within Cluster 31,8% 6,9% 18,9% 25,4% Invt3 Count 2668 254 834 3756 % within Cluster 31,9% 28,2% 14,8% 25,2% Invt4 Count 177 570 2822 3569 % within Cluster 2,1% 63,3% 49,9% 23,9% Total Count 8356 900 5654 14910 100% 100% 100% 100% INCeNTIVe Inct1 Count 2872 14 910 3796 % within Cluster 34,4% 1,6% 16,1% 25,5% Inct2 Count 2623 41 1124 3788 % within Cluster 31,4% 4,6% 19,9% 25,4% Inct3 Count 2679 218 865 3762 % within Cluster 32,1% 24,2% 15,3% 25,2% Inct4 Count 182 627 2755 3564
Total % within Cluster 2,2% 69,7% 48,7% 23,9%
Count 8356 900 5654 14910
CLUSTER: INVESTMENT, INCENTIVE AND RATIO
In order to better understand how successfully the programmes have developed, we applied CA to an investment – incentive ratio.
Table 12 - descriptive Statistics
Illustrated by Table 12, we can find that the first cluster, associated previously to Area 1 (Enterprise Stimulation), contains 8539 projects that received a mean incentive of 54946.8€ with a mean investment of 130279.7€. The distribution of the projects within this cluster is highly heterogeneous for both the incentive and the investment, as can be deduced from the high standard deviation. The smallest incentive is 1926.13€ and the highest 4429168€. The minimum ratio was 1%, the maximum was 100% and the mean value is 43%. The second cluster, associated previously to Area 3 (Stimulation of Business Environment), contains 900 projects that receive a mean incentive of 467527.6€ with a mean investment of 771208.3€. The distribution of incentives and investments within cluster 2 is also highly heterogeneous. The minimum incentive is 11237.56€ and the maximum incentive is 771208.30. The average ratio was 56% and the values range between 10% and 100%. The third cluster, associated previously to Areas 1 (Qualification of Human Resources) and 2 (Enterprise Stimulation), contains 5645 enterprises that received a mean incentive of 605513.54€ with an average investment of 2602544.23€. As for the previous clusters, incentive and investment values are highly heterogeneous, the incentive values range between 1174.68 and 60535273€. The average ratio was 42% and the values range from 1% to 100%.
CluSTeR 1 N Minimum Maximum Mean Std. Deviation
INVEST 8356 1926,13 22774084,46 130239,70 444696,46 INCENTIVE 8356 674,15 4429168,41 54946,80 157597,12 RATIO 8356 0,01 1 0,43 0,11 Valid N 8356
CluSTeR 2 N Minimum Maximum Mean Std. Deviation
INVEST 900 11237,56 11879900,50 771208,30 1323334,91 INCENTIVE 900 4569,17 10401377,00 467527,60 958458,03 RATIO 900 0,10 1 0,560214 0,17 Valid N 900
CluSTeR 3 N Minimum Maximum Mean Std. Deviation
INVEST 5654 1566,24 750000000,00 2602544,23 17669066,22 INCENTIVE 5654 1174,68 60535273,56 605513,54 2486228,94 RATIO 5654 0,01 1 0,42 0,20 Valid N 5654
4.7 Cluster typology
To better summarise the results from the application of Factor Analyses, a cluster typology has been developed for which it is possible to clearly understand how the different support types have been used by sectors, by years and by location. This cluster typology is reported in Table 13.
Table 13 - Cluster Typology
5. CoNCludING ReMARKS
From the presented results several conclusions can be pointed out. The first one is related to the asymmetric use of the incentives: The use of PRIME (as a public policy instrument for indirect distribution of European funds upon the entrepreneurial tissue), generated a clear geographic concentration of financial help in the northern part of the country. This region accumulated 41.4 per cent of the supports for firm stimulation, 39.0 per cent for stimulation of business environment and 49.4 per cent for human resources qualification. Certainly, the fact that other regions like Algarve, Azores and Madeira could only profit from this program in insignificant amounts (respectively 3.4, 1.9 and 1.5 per cent from the total available funds) is of great concern, suggesting the following question: Is there no entrepreneurial activity in such regions? Or, rather, location determined less use of supports by the existing companies? Is it possible that they could have been unable to follow the requirements for PRIME program calls?
Further observation of results shows that, by district, the concentration of PRIME supports goes clearly to Porto, a metropolitan area that absorbed respectively 12.8, 21.3 and 21.3 per cent of total available amounts. More surprising is the fact that Lisbon, the Portuguese capital, received 26.3 per cent help for stimulation of business environment, mainly driven for associative initiatives and other, not classified categories in the CAE
CluSTeR 1 CluSTeR 2 CluSTeR 3
AReA Support to firm AReA 1
stimulation AReA 3 Stimulation of Business Environment AReA 2 Human Resources Qualification yeAR 2000, 2001 2002, 2003, 2004 2005, 2006 eAC EAC 52
Retail (Excepting motor vehicles and motorcycles) Repair of household goods
Others EAC
EAC 91
Diverse associative activities EAC others
SySTeM SIPIE, URCOM INFRAEST ASSOCINFRAEST TFQ FORM PROFSIME
NuT NORTH NORTHLISBON CENTERNORTH
LISBON
dISTRICT D1, D2,D3,D4,D5, D8, D9, D10, D11 Lisbon and PortoD6. D7 Aveiro, Braga PortoD1, D2, D7
INVeSTMeNT Inv1, Inv2, Inv3 Inv3, Inv4 Inv4
INCeNTIVe Inc1, Inc2, Inc3 Inc3, Inc4 Inc4
(Classification of Economic Activities). If Lisbon, as cosmopolitan area, needs such a huge support how to classify than those conditions of less favoured Portuguese regions?
From the perspective of the sectors, there are difficulties to analyse a significant part of supports’ destiny. Indeed, 48.1 per cent of the financed amounts were canalized to sectors, not specified by the CEA. As far as the remaining is concerned, the associative sector as well as commercial and trade activities had also good shares in the use of PRIME. The activities for which funds have been mostly used are related to: infrastructure building (for associations) and commercial urbanism, and small business initiatives – not specified, but for improvement of business environment in general. A main question to this issue is: how did PRIME support the industrial and agricultural activities, and by means of which effects for the local, regional or national consumption trends?
A time-series observation can also be quite helpful for a better perception on how PRIME acted to promote activities in general. Rather then starting by shaping human resources and strengthening firm environment followed by firm financing activities, as suggested by the theory of endogenous growth, PRIME used the support system exactly on the inverse order. Our analyses points out the following: Those supports for Area 1, centred in firm stimulation, were attributed at the very start of the program - year 2000 and for a two years period. From 2002 to 2004, the stimulation of business environment was promoted, without integrated re-qualification of human resources; indeed, help for such projects arrived much later as it was the last PRIME target, due in 2005 and 2006. How is it possible to expect that companies can be duly stimulated by a support system without the convenient adequacy of their human resources at the very beginning?
In fact, PRIME system started up with a restricted investment in the area of enterprise stimulation (8539 projects with a average investment of 130279.7€). It was followed by few, but expensive, business environment actions mainly related to building of commercial infrastructures - about 900 projects were associated, now with a much higher average investment, 771208.3€. Finally, in the last execution period, a great amount was allocated to human resources qualification. In this case, 5645 projects have received an average investment of 2602544.23€; and despite these large amounts, the southern part of the country stayed almost away from any action. As proved in this paper, the total amount of analysed investments were primarily absorbed to speed the growth process of companies located in the northern and central regions of the country. In such regions, and because investments were concentrating mainly in few commercial activities, the system probably served also to aggravate the Portuguese trade balance. Still, some few indirect positive effects for the primary and secondary sectors should be expected – such results are now very difficult to evaluate in a struggle against the strong international financial crises.
Doubtless, PRIME served to accentuated asymmetries in Portugal. This could be avoidable if policy makers were able to anticipate such a risk and advance an exercise on crossed public policies. Thus, many efforts done by regional policy makers were reduced to ineffectiveness due to a different prioritization established by the Portuguese national innovation policy – whatever it might have been.
REFERENCES
Arrow, K. J. (1962), “The Economic Implication of Learning by Doing”, Review of Economic
Studies, vol. 29, no. 3, pp. 155-173;
Acs, Z. and Audretsch, D. B. (1984), “Small Business in Industrial Economics: The New Learning”, Revue d’Economie Industrielle, no. 7, pp. 21-39;
Acs, Z. (2002), Innovation and the Growth of Cities, Edward Elgar, Cheltenham Conselho de Ministros, Resolução no. 101/2003, Portugal;
Domar, E. D. (1946), “Capital Expansion, Rate of Growth, and Employment”, Econometrica, vol. 14, no. 2, pp. 137-147;
Durlauf, S. (2002), “On the empirics of social capital”. Economic Journal, 112 (483), pp. 459 – 479;
Fagerberg, J. (2003), “Schumpeter and the Revival of Evolutionary Economics: an Appraisal of the Literature”, Journal of Evolutionary Economics, vol. 13, pp. 125-59;
Fagerberg, J. (2004), “A Guide to the Literature”, in: J. Fagerberg, D. Mowery, M.T. Terrill and R. Nelson (eds.), The Oxford Hand Book of Innovation, Oxford University Press, Oxford, pp. 1-26;
Gifi, A. (1990), Nonlinear Multivariate Analyses. Chichester (England): John Wiley and Sons. p. 579;
Harrod, R. F. (1939), “An Essay in Dynamic Theory”, Economic Journal, vol. 49, no. 193, pp.14-33;
Keeble, D. and Wilkinson, F. (1999): “Collective Learning and Knowledge Development in the Evolution of Regional Clusters of High Technology SMEs in Europe”, Regional Studies, vol.33, nº4, pp. 295 – 303;
Lucas, R. E. (1988), “On the mechanics of Economic Development”, Journal of Monetary
Economics, vol. 22-1988, pp. 3-42;
Romer, P. M. (1986), “Increasing returns and long-run growth”, The Journal of Political
Economy, vol. 94-1986, pp. 1002-1037;
Romer, P. M. (1990), “Endogenous technical change”, The Journal of Political Economy, vol. 98, no. 5, pp. 71-102;
Sierra, C. (1997): “Proximité(s), Interactions Technologiques et Territoriales: une revue”. Revue d’Économie Industrielle, nº 82, pp. 7–38;
Sogaard, V. (2009), “Entrepreneurship and growth: the need to combine micro and macro perspectives”, in Galindo, M. A., Guzman, J. and Ribeiro, D. (Eds), Entrepreneurship and
Business: a regional perspective. Springer, Heidelberg;
Solow, R. (2000), “Notes on social capital and economic performances”, in Dasgupta P. and Serageldin, I. (Eds), Social Capital: A multifaceted perspective. The World Bank, Washigton; Solow, R. M. (1956) “A Contribution to the Theory of Economic Growth,” Quarterly Journal
of Economics, vol. 70, pp. 65-94;
Vaz, M. T. N. and Neto, P. (2005) “Contributos para definição de uma tipologia de inovação em zonas de fronteira”. Papeles de Economia Espanõla, Economia de las Comunidades Autónomas, nº21/2005, pp. 133 – 146, FUNCAS Madrid, Espanha;
ANNex 1
primesupport measures and incentives schemes
AReA 1 - enterprise Stimulation
DEMTEC – Incentive Scheme for the Implementation of Pilot Project Related to Technologically Inovative Products, Processes and Systems
EXECUTIVES – Executives Programme
IDEIA – Support to Business Applied Research and Development
MAPE – Support Measure for the Maximisation of Energy Potential and for Streamline Consumption NEST – New Enterprises Based on Technological Support
NITEC – Incentive Scheme for the Establishment of Research and Technological Development Clusters within Business Sector
SICE – Incentive Scheme for Business Co-operation SIED – Incentive Scheme for Digital Economy
INOV-JOVEM – Young Executives for Innovation in SME’s SIME – Incentive Scheme for Business Modernisation
SIME INTERNATIONAL – Incentive Scheme for the Modernisation of the Economy - International Development SIME R&TD – Incentive Scheme for Business Modernisation - Research and Technological Development
SIPIE – Incentive Scheme for Small Business Initiatives SIUPI – Incentive Scheme for the Use of Industrial Property
SIVETUR – Incentive Scheme for Tourism Products with a Strategic Dimension URBCOM – Incentive Scheme for Commercial Urbanism Projects
AReA 2 - Qualification of Human Resources
TECHNOLOGICAL SCHOOLS – Supporting Technological Training VOCATIONAL TRAINING – Fostering Investments in Human Resources
AReA 3 - Stimulation of the business environment
ASSOCIATIVE INFRASTRUCTURES – Support to the Existing Associative Infrastructures BUSINESS PARTNERSHIPS – Supporting Business Partnerships
ENERGY INFRASTRUCTURES – Support Measure for the Modernisation and Development of Energy Infrastrutures FSCR – Risk Capital Syndication Fund
GUARANTEE MECHANISMS – Establishment and Strengthening Guarantee Mechanisms HISTORIC INNS – Support to the Use and Valorisation of the Natural Heritage
INTERNATIONALISATION – Support to the Internationalisation of the Economy MINING ZONES – Support to the Requalification of Mining Zones
PITER – Support to Integrated Tourism Programmes with Strategic Nature and Regional Basis TOURISM INFRASTRUCTURES – Support to Tourism Infrastructures
TTQ INFRASTRUCTURES – Support Measure to the Setting-up of New Technological Infrastructures and to the Existing Technological, Training and Quality Infrastructures
ANNex 2
prime beneficiaries
,
geographical approach and incentive natureSUPPORT MEASURES AND BENEFICIARIES NATURE OF THE INCENTIVE ACTIVITY GEOGRAPHICAL
INCENTIVE SCHEMES SECTORS APPROACH
AReA 1 - enterprise Stimulation
DEMTEC Enterprises and NOG 1) Non refundable incentive I, BI, C, E, Tr, T, S No EXECUTIVES Small and Medium Enterprises Non refundable incentive I, C, T, S No IDEIA Consortia of Enterprises and NTSS Refundable & Non refundable incentive I, E, BI, C, T, S No
MAPE 2) Refundable & Non refundable incentive I No
NEST 3) & 4) Non refundable incentive I, E, BI, Tr, C, T, S No
NITEC Enterprises Non refundable incentive I, E, BI, T, C, S Yes
SICE Entreprises cooperation networks Refundable incentive I, BI, C, T, S No SIED Micro and SMEnterprises Non refundable incentive I, BI, C, T, Tr, S Yes INOV-JOVEM young executives Non refundable incentive I, BI, C, E, Tr, T, S No
SIME Enterprises Refundable incentive I, BI, C, T, Tr, S No
SIME INTERNATIONAL Micro and SMEnterprises Non refundable incentive I, BI, C, T, Tr, S No SIME R&TD Enterprises Refundable & Non refundable incentive I, BI, C, T, Tr, S No SIPIE Micro and SMEnterprises Non refundable incentive I, B, C, T, Tr, S Yes
SIUPI 5) Non refundable incentive I, BI, E, C, PI, T, S No
SIVETUR Enterprises Refundable & Non refundable incentive T No
URBCOM 6) Non refundable incentive C, T, S No
AReA 2 - Qualification of Human Resources
TECHNOLOGICAL SCHOOLS Technological schools Non refundable incentive I, BI, C, E, T, S No VOCATIONAL TRAINING 7) Non refundable incentive I, BI, C, E, Tr, T, S Yes
AReA 3 - Stimulation of the business environment
ASSOCIATIVE
INFRASTRUCTURES 8) Non refundable incentive I, BI, C, E, Tr, T, S No
BUSINESS PARTNERSHIPS 9) Non refundable incentive I, BI, C, E, Tr, T, S No
ENERGY INFRASTRUCTURES 10) Non refundable incentive E No
FSCR Micro and SMEnterprises Non refundable incentive I, BI, C, E, T, Tr, S No GUARANTEE MECHANISMS 11) Non refundable incentive I,BI, C, E, T, Tr, S No HISTORIC INNS Enatur - Pousadas de Portugal Non refundable incentive T No INTERNATIONALISATION 12) Non refundable incentive I, BI, C, E, T, Tr, S No
MINING ZONES 13) Non refundable incentive I No
PITER 14) Refundable & Non refundable incentive T Yes
TOURISM INFRASTRUCTURE Institutional training bodies Non refundable incentive T No
TTQ INFRASTRUCTURES 15) Non refundable incentive _ Yes
1) - Non Profit Organisation from the National Scientific and Technological System - NTSS (projects in EAC- Economic Activities Classification - 40) 2) - Firms, municipalities, business and labour associations, schools, health and social bodies, civil protection entities
3) - Persons intending to promote the establishment of new enterprises and recently established technology support enterprises with no significant activities 4) - Enterprises, inventors, independent designers, entrepreneurs at pre-entrepreneur stage and institutions developing research stages
5) - Micro and SMEnterprises, commerce associative structures, municipalities and co-ordinating and supervising units 6) - Enterprises and actors from the business environment and technological schools
7) - National, regional and sector business associative structures classified under EAC (Economic Activities Classification) 91110, federations or confederations of associative structures and regional and local tourism offices
8) - Public organisations and non-profit making private organisations
9) - All concessionaires enterprises of transport and supply of electric power and gas, as well as other enterprises operating those services under public services licensees
10) - Enterprises specialised in the development of SMEs oriented financial innovation, public administration bodies, entities from the National Scientific Technological System, or other representative entities intervening in the development of specific areas of economic activity
11) - Bodies and entities of the public administration, national, regional and sector business associative structures classified under EAC (Economic Activities Classification) 91110, federations or confederations of associative structures
12) - Enterprises holding the concession for the rehabilitation works in abandoned mines and bodies from the Ministry of Economy and Innovation
13) - All entities, irrespective of their nature and juridical statute, and namely enterprises, municipal counties, tourism regions and other local or regional tourism bodies
14) - Technology centres, technology transfer centres, technology-based incubator centres and parks, technological schools and interfacing public entities
ANNex 3
Variables Categories Number labels AReAS oF
STRATeGIC
ACTIoN AREA
Enterprise Stimulation
Enterprise Stimulation Qualification of Human Resources
Stimulation of the Business Environment
3 EIXO1
EIXO2 EIXO3
locational Factors NUTSII
DISTRICT North Centre Lisbon Alentejo Algarve Açores Madeira Aveiro Braga Coimbra Faro Leiria Lisbon Porto Santarém Viana do Castelo Viseu Vila Real Others 7 North Centre Lisbon Alentejo Algarve Açores Madeira D1 D2 D3 D4 D5 D6 D7 D8 D9 D10 D11 D12
Temporal Factor YEAR 2000 2001 2002 2003 2004 2005 2006 2000 2001 2002 2003 2004 2005 2006
Support System SISTEMCORT
Professional Formation
Support to the Existing Associative Infrastructures
Support Measure to the Setting-up of
New Technological Infrastructures and to the Existing Technological, Training and
Qualitative Infrastructures Support Measure
for the Maximisation of Energy Potential and for Streamline Consumption
Support Measure for the Maximisation
of Energy Potential and for Streamline
Consumption
Incentive Scheme for Digital Economy Incentive Scheme for Business Modernisation Incentive Scheme for the Modernisation of the
Economy – International Development
Incentive Scheme for Small Business Initiatives Incentive Scheme for Commercial Urbanism
Projects Others Form Prof Inf Assoc Inf TFQ MAPE SIED SIME SIME INTERNT SIPIE URBCOM Others
Financial System INVESTMENT
INCENTIVE RATIO INVESTMENT < 25 Percentil (P25) P25= INVESTMENT< P50 P50= INVESTMENT< P75 P INVESTMENT≥ P75 INCENTIVE < 25 Percentil P25= INCENTIVE < P50 P50= INCENTIVE < P75 INCENTIVE ≥ P75 RATIO < 25 Percentil P25= RATIO < P50 P50= RATIO < P75 RATIO ≥ P75 Inv 1 Inv 2 Inv 3 Inv 4 Inc 1, Inc 2 Inc 3, Inc 4 Rt 1 Rt 2 Rt 3 Rt 4