M
ASTER OF
S
CIENCE IN
FINANCE
M
ASTERS
F
INAL
W
ORK
PROJECT
EQUITY RESEARCH
:
BMW
AG
PEDRO ALMEIDA FIGUEIREDO TOMÁS
M
ASTER OF
S
CIENCE IN
FINANCE
M
ASTERS
F
INAL
W
ORK
PROJECT
EQUITY RESEARCH
:
BMW AG
PEDRO ALMEIDA FIGUEIREDO TOMÁS
S
UPERVISOR
:
PEDRO
RINO
VIEIRA
i
Abstract
This project represents a detailed evaluation of BMW AG, guided by the structure of
ISEG’s Master in Finance final work project. This equity report was written according
to CFA Institute’s recommendations. The reason behind choosing BMW AG lies on my
personnel interest on auto industry and the curiosity to analyze how the reality of it is
changing nowadays. This report was written in accordance with the public information
available on August 30
th, 2018, any information or event subsequent to this specific
date will not be reflected on this valuation. The target price on August 30
th2018 was
€84.50, which according to the Discount Cash Flow method, represented an upside
potential of 17.39% and according to the Comparable Multiples method, an upside
potential of 33.88%. My final recommendation is to buy, even considering the identified
high risk related with the expansion of electric cars segment.
Resumo
Este projeto aborda uma extensa e detalhada avaliação da BMW AG, obedecendo à
estrutura de Trabalho Final de Mestrado, neste caso projeto, do Mestrado de Finanças
do ISEG. O relatório foi escrito tendo conta as recomendações do Instituto CFA.
Escolhi a BMW AG uma vez que considero-me bastante curioso em relação à indústria
automóvel e todo o processo de mudança pela qual está a passar de momento. O
relatório foi escrito de acordo com informação publica disponível a 30
de Agosto de
2018, qualquer informação ou acontecimentos que tenham ocorrido após esta data,
não estarão refletidos na avaliação. O target price na data referida era de €84.50, de
acordo com o método de avaliação Discounted Cash Flow existe um potencial de
subida na ordem dos 17.39% e de acordo com o método de avaliação Comparable
Multiples, um potencial de 38.88%, sendo um senário ligeiramente mais otimista. A
minha recomendação é de compra, mesmo com um elevado risco associado à
empresa devido à emergência dos carros elétricos.
iii
Acknowledgements
Doing the Master Thesis was without any question, the most challenging project I came
across during my Academic life. It required a lot of discipline and commitment to finish
it on time and in the proper way.
It would not be possible without the support of my family and friends, especially the
ones who stand by my side during the summer on ISEG’s Library everyday with no
exception. A huge thank to my girlfriend Bárbara Santos, who always made me believe
it could be done, even when I was almost on the hedge of giving up.
However, none of this would be possible without Professor Pedro Rino Vieira, who
accepted to be my tutor since the moment I contacted him, and guided me since
moment zero with great commitment.
Index
Abstract
i
Resumo
ii
Acknowledgements
iii
Index
iv
List of Figures
v
List of Tables
vi
1.
Research Snapshot
1
2.
Business Description
2
3.
Management and Corporate Governance
3
4.
Company Strategies
5
5.
Industry Overview and Competitive Positioning
5
6.
Investment Risks
11
7.
Valuation
13
Appendixes
16
Appendix A: Balance Sheet Statement
16
Appendix B: Income Statement
18
Appendix C: Cash Flow Statement
19
Appendix D: Financial Ratio Analysis
20
Appendix E: Forecasting Assumptions
21
Appendix F: Discounted Cash Flow Analysis
27
v
List of Figures
Figure 1: Historical Stock Price
1
Figure 2 - Number of vehicles sold
2
Figure 3 - Percentage of delivered vehicles 2017
2
Figure 4 - Vehicles delivered by region 2017
2
Figure 5 - Motorcycles deliveries by region
2
Figure 6 - Production by region at 2017
3
Figure 7 - Production by region at 2017
3
Figure 8 - New vehicles financed or leased by Financial Services
3
Figure 9 - Shareholder Structure
4
Figure 10 - Voting Rights
4
Figure 11 - Compliance Management System
4
Figure 12 - Architecture of Autonomous Driving
5
Figure 13 - Compliance Management System
5
Figure 14 - New car registrations by region 2017
5
Figure 15 - EU market share by registrations 2017
6
Figure 16 - EU car trade value (€ Million)
6
Figure 17 - Main destinations of EU car exports (€ Million)
6
Figure 18 - Asian countries car registration share 2017
6
Figure 19 - Market share of alternative energy vehicles at Chinese market
7
Figure 20 - Car sales on US market (thousand units)
7
Figure 21 - Real GDP Growth emerging economies (%)
7
Figure 22 - Interest rates for new & used cars
8
Figure 23 - EUR/CNY exchange rate
8
Figure 24 - Cost Drivers in Automotive Industry
8
Figure 25 - Main Competitors Sales 2017 (million units)
8
Figure 26 - Premium compact segment sales on Europe
9
Figure 27- Premium midsize segment sales on Europe
9
Figure 28 - Premium large segment sales on Europe
10
Figure 29 - Global OEMs – Electric mobility
10
Figure 30 - Porter’s Five Forces
11
Figure 31 - Risk Matrix
12
List of Tables
Table 1: Analyst’s Risk Assessment
Error! Bookmark not defined.
Table 2 - Valuation Final Results
1
Table 3 - Premium SUV segments sales on Europe
9
Table 4 - SWOT Analysis
10
1
BMW AG:
(2018YE Price Target of €99.19 (+17.39%), with high risk; recommendation is to Buy)
BUY is our recommendation at 30th August of 2018 for BMW Group with price target
of €99.19 for 2018YE, using the Discounted Cash Flow method. With Relative valuation method, the scenario is more optimist, in this particular case the price target is 113.13€, representing an upside gain of 33.88% from its latest closing price €84.50. Although this may be an interesting investing scenario, a high risk needs to be taken in to account, since all automotive industry is under constant changes, and may be experiencing the biggest technology one, with the introduction of electrified cars, so many decisions from BMW Group side can change this possible outcome.
Figure 1: Historical Stock Price
BMW AG – Very well stablished player on automotive market, having great figures: BMW Group is a well-known global brand in the automotive and motorcycle segment. They have well diversified stream of revenues, BMW, MINI, Rolls-Royce, BMW Motorcycles and Financial Services. The core business is automotive segment selling over two million units, 2,463,526 to be more precise, in 2017, setting a new record for the seventh year in the row, increasing 4.1% YoY.
BMW’s strategic partnership with Brilliance Automitive Lds: BMW has its priority markets well stablished, and Asian market is one them. In Shenyang, China, BMW has two plants (Dadong and Tiexi) which resulted from BMW’s joint venture with Brilliance Automotive Ltd, were five models are currently produced setting 396,000 units produced.
Electric Vehicles is the path to follow: Since Automotive Industry is suffering some deep changes, is important to follow the new trends by being one of the top manufacturers in adopting these ones. With this, being capable to present electric cars solutions is very important to gain market share. That is the path BMW is following, presenting hybrid versions within already existing models and creating new ones for electric cars. The European electric segment is growing considerably each year, recording a 33% increase in 2017. BMW i3 was the fourth most sold model, registering a 73% increase since 2016 to roughly 14,000 units. By 2025, BMW Group intends to achieve a portfolio with 25 electrified models including 12 fully electric models.
40 70 100 130
Closing Price Target Price Current Price
1.
Research Snapshot
BMW AG
BUY
High risk
30 August 2018Portugal
Low Medium High
BMW Group risk assessment presents a high-risk investment. Level of competition domestically and abroad is high, especially domestically. The uncertainty surrounding the electric cars markets aligned with some political tensions with major Economies where BMW operates.
Source: Student’s analysis
Valuation 2017YH Target Price
DCF € 99,19
Multiples € 113,13
Table 1 - Valuation Final Results Table 1: Historical Stoke Price
China Japan Italy France UK USA Others Germany Others UK Germany France Italy US Spain Figure 3 - Percentage of delivered vehicles 2017
Figure 5 - Motorcycles deliveries by region
Bayerische Motoren Werke Aktiengesellschaft (BMW) has its headquarters in Munich, Germany, is the parent company of the BMW Group. The company was founded in 1916 as Bayerische Flugzeugwerke AG (BFW), it emerged as Bayerische Motoren Werke G.m.b.H in 1917, before finally becoming nowadays well known Bayerische Motoren Werke Aktiengesellschaft (BMW AG). The main purpose of the company is to develop, produce, and sell engines, engine-equipped vehicles and related accessories, as well as offer Financial Services. BMW group is sub-divided into the Automotive, Motorcycles and Financial Services segments, their portfolio products are mainly cars and motorcycles, being offered under international premium brands BMW, Mini and Rolls-Royce in more than 150 countries.
The core business is the Automotive segment, represented by the brands of BMW, Mini and Royce. In 2017, the BMW group sold 2,463,526 BMW, Mini and Rolls-Royce worldwide, a new record for the firm, being the seventh year in a row,
which the company breaks this record, with a growth of 4.1%. The BMW brand recorded a 4.2% increase to 2,088,283 units, exceeding the two-million barrier for the second time, placing therefore the company on the top position in the premium segment. MINI also registered a plausible increase of 3.2% to 371,881 units and Rolls-Royce Motor Cars sold 3,362 luxury units during this year resulting in a decrease of 16.2% setting an all-time high for all the brands, BMW and MINI – Figure 3.
Their biggest market is in Europe and in 2017 the sales surpassed the one-million mark for the second consecutive year with 1,101,760 units sold representing an increase of 0.9% with Germany and Great Britain playing a big roll on these figures, since both of them combined represent roughly 50% of European market sales. Important to mentioned that sales on these two previous markets decreased slightly due to the diesel debate in Germany and the uncertainty surrounding the Brexit negotiations. In recently years Asian market has been increasing its demand for European high-quality brands, and BMW brand is no exception, selling in 2017 848,826 units with a growth of 13.6%. Additionally, important to refer that the American market experience a downfall of 2%, directly connected with the decrease in USA, 3.5% since of 451,136 units, BMW sold 353,819 units alone. – Figure 3, 4.
When it comes to the motorcycle segment, the number of units sold rose by 13.2% reaching 164,153 units mainly in Europe, with Germany and France standing out with 28.3% (16.2% and 10.1% respectively) of total units sold. In Europe the sales grew 15.4%, 101,524 units as in the opposite side the USA recorded a decrease of 1.3%, representing a good recovery since in 2016 sales felt 16.8%. An important justification at it, is the increase in production outside of Europe. The Group’s cooperation partner TVS Motor Company in India where they are producing the model G 310 R, increased their operation in Group’s partner plant in Thailand, and the expansion at BMW Group plan in Berlin, which will be finished in 2018, will create the required capacities to achieve planned growth. – Figure 5.
BMW’s production system is composed by 31 plants where 19 plants belong to the group, 5 belong to joint ventures/operations, 5 are partner plants and 2 are contracted production plants employing a total 129,932 workers. – Figure 5. German Plants play an important role within the Group’s international network, more than one million vehicles were produced in 2017 on Munich, Dingolfing, Resensburg and Leipzig.
2.
Business Description
0 500000 1000000 1500000 2000000 2500000 BMW MINI Rolls-Royce 2016 2017Source: BMW Group Annual Report 2017
Source: BMW Group Annual Report 2017
0 500 1000 1500
Europe Americas Asia Other markets
Source: BMW Group Annual Report 2017
Source: BMW Group Annual Report 2017 Figure 2 - Number of vehicles sold
3
100000 105000 110000 115000 120000 125000 130000 135000 2013 2014 2015 2016 2017Figure 6 - Production by region at 2017
However, plants outside German boundaries are almost as important as the German ones. In Europe, specifically in UK, the MINI Hatch and the MINI Clubman are produced in Oxford and Swindon and in 2017 the new Rolls-Royce Phantom production began at the plant in Goodwood. Still in Europe, in 2017, to keep up the pace with the forecast growth, the MINI Hatch, MINI Countryman and MINI Convertible are also produced under contract for the Group BMW at the automobile manufacturer VDL Nedcar bv, Born, in Netherlands. In Rosslyn, South Africa everything is being prepared to start the production of a new BMW model.
In Shenyang, China, BMW has two plants (Dadong and Tiexi) which resulted from BMW Brilliance Automotive Ltd, were five models are currently produced setting a total of 396,000 units produced. Thanks to the year-on-year demand growth on the Asian market and as result of the expansion of Dadong’s plant, BMW plans to add a sixth model to the line-up, the new BMW X3. On top of that BMW Brilliance Automotive Lda also opened a High Voltage Battery Centre in Tiexi during 2017 intending to supply batteries to Dadong’s plant where the BMW 5 Series plug-in hybrid will be produced for Chinese market from 2018 onwards.
On American soil the plant with more importance is the one in Spartanburg, USA which recorded the second highest production volume (371,316 units). BMW plans to open on San Luis Potosí, Mexico, a new plant as well in order to attack the American market, which according to BMW will be operational on 2019. – Figure 7.
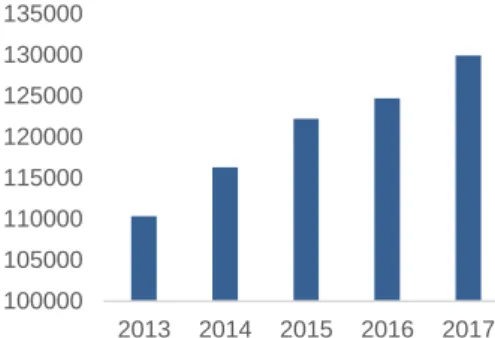
BMW’s financial services business performed well in 2017, grew 1.1% and in terms of revenue this segment represented €124.719 million, at 31 December of 2016 the contract portfolio was comprised by 5,380,785 contracts. From January to December 2016, 1,828,604 new contracts were concluded with costumers, 1% higher than previous year, with a decrease of 2.6% for leasing contracts and 2.8% rise for credit financing. Overall, leasing represented 33% of the new contracts and credit financing 67%. Almost 50% (46.8%) of BMW’s group vehicles were leased or financed by the financial services segment during 2017. – Figure 8.
Is interesting to see that EU Bank region (comprised by Italy, Spain and Portugal) is one of the key players in this segment, accounting for 21.1% of Financial Services segment. – Figure 9.
The raw materials which have a major impact on BMW’s business, are precious
metals, steel and oil. The price of Brent crude oil suffered some volatility in its price, reaching values of 57 US dollars per barrel, which later due to an agreement reached by the Organization of Petroleum Exporting Countries (OPEC) fell to an average price of 44 US dollars per barrel.
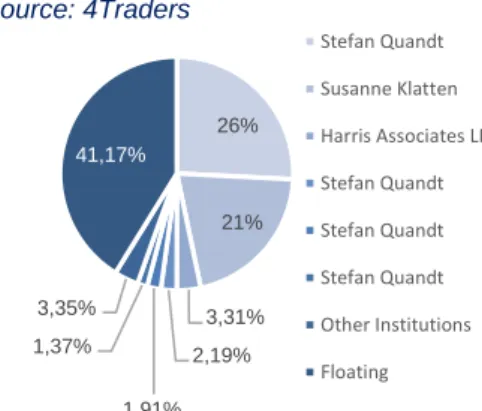
The BMW Group has 657,109,600 shares outstanding on the 22nd March 2018 with a
par value of 1€ per share. Shareholder’s structure has been changing meaningfully during the last years, with approximately 47% of the shares belonging to the founder family Quandt. However, in 2015, with the dead of Johanna Quandt her shares were divided between her two children, Stefan Quandt and Susanne Klatter who own 46,70% of the equity, detaining 25,8% and 20,9% respectively. Subsequent shareholders with inferior chunks of shares are Harris Associates LP (3,31%), Norges Bank Investment Management (2,82%), Dodge & Cox (1,92%) and The Vanguard Group (1,34%). The remaining shareholders have chunks inferior to 1%. – Figure 9. Stefan Quandt, currently Member of the Supervisory Board as Deputy Chairman Entrepreneur, owns 25,8% of the shares from which 25,6% are held by AQTON SE where he is Chairman and the remaining shares are hold in his name (0, 2%). Susanne
3.
Management and Corporate Governance
0 500000 1000000 1500000 US Germany China UK India Thailand Netherlands Austria 2017 2016
Source: BMW Group Annual Report 2017
22% 21% 22% 22% 21% 23% 21% 24% 27% 26% 0,% 10,% 20,% 30,% 40,% 50,% 60,% 2013 2014 2015 2016 2017 Leasing Financing
Source: BMW Group Annual Report 2017 Source: BMW Group Annual Report 2017
Figure 7 - Production by region at 2017
Figure 8 - New vehicles financed or leased by Financial Services
26% 21% 3,31% 2,19% 1,91% 1,37% 3,35% 41,17% Stefan Quandt Susanne Klatten Harris Associates LP Stefan Quandt Stefan Quandt Stefan Quandt Other Institutions Floating 0,20% 17,40% 16,40% 0,20% 12,60% 17,40% 16,40% 12,60% 0,% 5,% 10,% 15,% 20,%
Stefan Quandt, Germany AQTON SE, Bad Houmburg
v.d. Höhe, Germany Johanna Quandt GmbH, Bad
Houmburg v.d. Höhe, Germany Johanna GmbH & Co. KG für
Automobilwerte, Bad Houmburg v.d. Höle,… Susanne Klatten, Germany
Susanne Klatten Beteiligungs GmbH, Bad Houmburg v.d. Höhe,… Indirect Direct Company-wide Compliance Network • Annual Complian ce Reporting BMW Group Compliance Committee Office • Annual Report BMW Compliance Committee • Annual Report Board Of management BMW AG Supervisory Board BMW AG Figure 9 - Shareholder Structure
Figure 10 - Voting Rights
Figure 11 - Compliance Management System
Klatter also a member of the Supervisory Board, owns 0.2% as a personal investment and 20,7% through Susanne Klatten Beteiligungs GmbH. – Figure 10.
BMW group comprises BMW AG and its group entities, BMW AG is a stock corporation based on the Germany Stock Corporation Act and has its office in Munich, Germany. Their corporate governance model is the following:
Annual General Meeting: Normally conducted to decide on the utilization of
unappropriated profit, emendation of some particular acts of members of the Board of Management and the Supervisory Board, nomination of the external auditor and election of shareholder’ representatives who join the Supervisory Board.
Supervisory Board: Advises regularly and supervises the Board of Management in
the management of the BMW Group, it has a word in every important decision of de Group, it appoints and dismisses members of the Board of Management. It is composed by 21 members with Dr.-Ing. Dr.-Ing. E.h. Norbert Reithofer as the Chairman, member of the Board since 2015. Unlike Board of Management the Supervisory Board remained unchanged during 2017.
Board of Management: Has the responsibility to manage the enterprise under its best
interests, considering the interests of the shareholders, employees and other groups associated with the group, having as main goal the creation of value always advised by the Supervisory Board. It is composed by 10 members, with Harald Krüger as the Chairman. Some changes occurred in the last year with Professor Henning Kagermann stepping out from the BoD, of which he was member since 2010. Kagermann was replaced by Dr.-Ing. Heinrich Hiesinger who was elected as new shareholder representative for a term of five years. – Figure 11.
With Family Quandt controlling roughly 47% of BMW’s Group, the company is not driven by decisions to achieve short term returns to reward their shareholders. On the contrary, they are more focus in ensuring sustainability by the realization of long-term strategies. BMW’s compensation policy is managed towards long-term sustainable performance, having a share-based incentive scheme for top-management. Therefore, even with a pleasant alignment between management and shareholders interest, it is difficult for a new investor to have a large participation in the company, therefore a large investment may not seem so interesting, since this substantial share ownership allows the Quandt family to block any major decision, creating a certain dependency on the family’s decisions.
Social Responsibility: The BMW Group is present in more than 130 countries,
witnessing high contrast social realities, therefore BMW works closely with strong partners to develop possible solutions for more equal job opportunities and support innovative projects to promote cultural diversity.
BMW promotes education in very different fields such as mathematics, natural sciences, IT and technology around the globe, focusing on countries with limited access to education. BMW wants to ensure that not only young people from developed countries have a shot of creating a career and succeeding in their life.
Source: 4Traders
Source: BMW Group Annual Report 2017
5
Pioneering • Bulding Up expertise • Technology innovation • Project iBMW Electrificatio n of core portfolio • Roll-Out BMW i Performance • Upgrade BMW i3, new BMW i3s • MINI Electric (PHEV) and MINI BEV • BMW X3 BEV Scalability and Flexibility • BMW iNext • BMW i Vision Dynamics HD-Map Backed Sensors Artificial Intelligence Environmenta l Modal Vehicle Integration Europe North America South America Asia Midle East/Africa Figure 12 - Architecture of Autonomous DrivingFigure 13 - Compliance Management System
Figure 14 - New car registrations by region 2017
In 2016, the BMW Group presented a long-term focused strategy called, Strategy Number One > Next. This strategy was established taking in to consideration previous strategies, having as goal new developments and social responsibility of the Group. The core of this strategy is subdivided in four main pillars:
Autonomous: Since 2017 BMW Group has improved its expertise in the fields of
vehicles connectivity and autonomous driving at its own development center. Roughly 600 employees are working in cooperation with other partners, developing and expanding the platform for autonomous driving. BMW Group intends to have more than 2000 employees working at the new site towards achieving fully autonomous driving in fields such software development and road testing. – Figure 12.
Connected: The second strategic direction is summarized under the term of
Connected Drive, a digital concept in which the driver, vehicle and the outside world are able to interact with each one. The long-term goal is to transfer certain tasks from the driver to the vehicle, so that the costumer has more time to focus on other tasks while driving thus maximizing his time. In 2021 BMW Group will launch the iNEXT, a model which will have an electric drivetrain, full connectivity and will reach a new level of autonomous driving.
Electrified: BMW Group is continuously optimizing the energy efficiency of
automobiles, including the electrification of the product range across all brands. Under the name Efficient Dynamics, the BMW Group has been successfully working on reducing fuel consumption and vehicle emissions with the development of highly efficient combustion engines, increasing electrification of drivetrains. BMWi brand is a segment of BMW Group which has been really successful, and therefore the Group will continue to introduce new models. This brand reflects Efficient Dynamics in its most systematic form, the vehicles are electric and plug-in hybrid drivetrains and use new materials. By 2025 BMW Group intends to achieve a portfolio with 25 electrified models including 12 fully electric models. – Figure 13.
Services: Individual mobility services is hot trend on the automotive industry, and
BMW Group aims to be the leader provider of premium mobility services going forward. Recently BMW Group acquired the shares of Sixt in DriveNow, the mobility joint venture will be totally owned by BMW. The Group is actively expanding in the areas of sustainable on-demand mobility, such as DriveNow and ReachNow, parking with ParkNow and charging with ChargeNow. The aim for 2025 is to win 100 million customers for premium mobility services.
Industry Overview
During 2017 global Real GDP growth was 3.8% and the predictions for 2022 are 3.7%, meaning that in next years to come, Global Growth will be constant. The automotive industry is a huge driver of macroeconomic and technological advancement, in 2017 80 million cars were sold worldwide, more 3.2% than in 2016. Leading these figures is the Asian market, in particular China with 30.1% stake of global sales, followed by European Union with 19% and US market with 17.4% respectively. – Figure 14. Global premium segment sales are expected to grow at a CAGR of 2.1%, reaching a total 9.97 million units.
4.
Company Strategies
5.
Industry Overview and Competitive Positioning
Source: BMW Group Investment Presentation 2017
Source: BMW Group Investment Presentation 2017
Source: ACEA-ACEA Economic and Market Report Q4 2017
0 50 100 150 2016 2017 Exports Imports 0 5 10 15 20 25 30 35 40
US China Turkey Japan Switzeland
2016 2017 Germany United Kingdom France Italy Spain 0,00% 20,00% 40,00% 60,00% 80,00% 100,00%
China Japan India South
Korea Other countries
2016 2017
Figure 15 - EU market share by registrations 2017
Figure 16 - EU car trade value (€ Million)
Figure 17 - Main destinations of EU car exports (€ Million)
Figure 18 - Asian countries car registration
Europe Union
Already recovered from the crisis of 2008, in 2017 a Real GDP growth of 2.7% was recorded, and for next years the predictions point out to a constant Real GDP Growth, being 1.7% in 2022.
Regarding production, EU recorded an increase of 0.2% in 2017 representing a total share of 21.1% on global production, being the second largest producer bitten by China with a share of 29.4%. Germany was the main European with 5.6 million units followed by Spain (2,291,492) and France (1,674,717). Registrations rose by 3.4% in EU with Germany being the main player with a stake of 22,73%, and an increase of 2.7%, on the other hand in British territory the scenario was the opposite with UK experiencing a decrease of 5.7%. - Figure 15.
When it comes to trade, in 2017 car exports increased in terms of value (2.3%) and in terms of volume (3.7%) when comparing with 2016. More than 5.6 million passenger cars were exported the EU during 2017, worth €127.7 billion totally. – Figure 16. The most valuable market to export EU passenger’s cars was the United States, exporting a total of €37.4 billion last year, less 0.9% compared with 2016, translating to almost 30% of the total EU export value. However, when looking to volume terms, EU car exports to the United States decline by 1.8%. The value of UE exports to China and Japan strongly increased, 11% and 9.6% respectively. In terms of volume, to enhance the decrease of exports by 12.8% to Turkey, probably linked with political stresses which took place last year. – Figure 17.
Imports of passenger cars also increased in 2017, counting 3 million units in total with a worth of more than €40 billion, which represented a 7.0% increase compared with 2016, resulting in a trade surplus of €87.6 billion (+1.0%). South Korea and Turkey had the best performance throughout 2017 both in value, 16% and 16% respectively, and in volume terms, 14.4% and 12.9%. On the other hand, car imports from Japan and the United States declined considerably during the same period, 17.6% and 14.8% respectively.
One of the biggest challenges that EU is trying to overcome, is the high level of CO2
emissions which currently is around 119.6 g CO2/km. Since 1995 emissions were
reduced by 35.7%, from 186g CO2/km to 119.6g CO2/km, however the goal for 2021
is a level of 95g CO2/km which will be achieved through the development of more
full-efficient technologies. European auto industry is the continent with the highest level of R&D invested, €44.7 billion each year.
Eastern Europe
Regarding Eastern Europe, Russia’s Real GDP growth during this year was 1.5%, being the same as the one predicted for 2022, 1.5%. Production and registrations increased comparing with 2016, 19.9% and 12.9% respectively. This strong investment and consequent increase in sales can be justified by aged Russian vehicle fleet since more than half the cars on the roads have more than 10 years.
China
China is one of the fast-growing markets globally but it has slowed down during the previous years. However, it still registered an impressive Real GDP growth of 6.9% registered in 2017. This slowing down will continue for the next years, since the forecast Real GDP growth for 2022 is 5.7%.
Last year, from 37 million cars registered in all Asian Continent, corresponding to 46.6% of global registration, and China alone has a 30% global share (from 23 million to 24 million units, an up rise of 4.3%). – Figure 18.
Source: ACEA-ACEA Economic and Market Report Q4 2017
Source: ACEA-ACEA Economic and Market Report Q4 2017
Source: ACEA-ACEA Economic and Market Report Q4 2017
Source: ACEA-ACEA Economic and Market Report Q4 2017
7
0,00% 2,00% 4,00% 6,00% 0 4.000 8.000 12.000 16.000 20.000 1977 1982 1987 1992 1997 2002 2007 2012 2017 -10 -5 0 5 10 15Brazil China India Russia
Figure 19 - Market share of alternative energy vehicles at Chinese market
Figure 20 - Car sales on US market (thousand units)
Figure 21 - Real GDP Growth emerging economies (%)
Such as in EU, there are some concerns in China connected with cars usage, in this case instead of CO2 emissions, China regulations are more worried with high fuel
consumptions. To overcome this, the Government gives tax incentives attributed to purchase of small-engine vehicles, 1.6L or bellow, leading to a costumer’s preference switch from big-engine vehicles with combustion engines to small-engine vehicles, PHEV (Plug-in Hybrid Vehicles) and BEV (Battery Electric vehicles).
United States
Recording a Real GDP growth of 2.3% during 2017, however the forecast for 2022 is of 1.5%, representing a decrease for the next years.
The United States production and registration numbers decreased considerably during 2017. In terms of registrations the total of units registered decreased by 3.3% which is significant since they have a global share of 17.4%, when it comes to production the scenario is even more delicate, recording a negative performance of 11.5% comparing with 2016. US automotive industry staggered during this last two years thanks to Donald Trump’s commercial protectionist measures and political geo-political stresses. – Figure 20.
Demand Outlook
Macroeconomic conditions
The Automotive Industry is a very complex industry, which is highly rooted in to global economy, making it very sensible to any macroeconomic factors. Purchase power, income of consumers, GDP growth, unemployment, government policies and improvement in road infrastructure. Emerging economies like China and India which have a high GDP growth rate, have a large influence on global sales growth, however on the other hand we can find countries like Russia and Brazil thanks to economic problems with negative GDP growth rates recorded during 2016. – Figure 21. Financing conditions
According to WalletHub auto financing report, financing services have a clear positive impact on automobile sales, since economic crisis occurred in 2008 decreased considerably consumers’ disposable income. Today consumers have a considerable amount of attractive financing, englobing insurance, leasing contracts and the traditional financing products. Interest rates for new cars are at the lowest point in the last three years, new car loans now charge 14% less interest than the average used car loan. Costumers should analyze the market and choose the best options among all providers, such as community small banks, regional banks, national banks, credit unions, car manufacturing financing and car manufacturing leasing. However, financing through car manufacturers is cheaper than the other options, since their rates are 42% below average. – Figure 22.
Social economic and political conditions
Automotive industry being an industry which has branches all over the globe, is exposed to each country’s government regulations. Protectionist and conservative policies have negative impacts on industry’s demand, such has the Russian government program introduced in 2014 to promote the local production consequently increasing the tariff on imports, Europe Union’s CO2 emissions barrier of 95 g/kg for
2020.
Currency exposure
Auto manufacturers not only sell their products locally but also internationally, exposing their products to currency exchange risk. Such risk can affect the value of manufacturer which exports a considerable number of cars only with the appreciation of the domestic
Source: PWC Global Industry Trends & China Market Update
Source: Statista, light vehicles sales in the US from 1977 to 2017
0,0% 1,0% 2,0% 3,0% 4,0% 5,0% 6,0%
Community and Small Banks Regional Banks
National Banks Credit Unions Car manufacturers
Used Cars New Cars
2 4 6 8 10 12 2 0 0 1 2 0 0 2 2 0 0 3 2 0 0 4 2 0 0 5 2 0 0 6 2 0 0 7 2 0 0 8 2 0 0 9 2 0 1 0 2 0 1 1 2 0 1 2 2 0 1 3 2 0 1 4 2 0 1 5 2 0 1 6 2 0 1 7
Raw materials Direct Labor R&D Logistics Administration Depreciation Others 2,03 1,84 2,53 6,63 0,3 0 2 4 6 8 BMW Audi Mercedes-Benz Vokswagen Volvo
Figure 22 – Credit entities and practiced interest rates on new and used cars
Figure 23 - Exchange rate Euro to Chinese Yuan
Figure 24 - Cost Drivers in Automotive Industry
Figure 25 - Main Competitors Sales 2017 (million units)
currency, leading to hedging strategies on financial markets. European car manufacturers are benefiting from a weakened Euro currency, which increases the demand for their products. – Figure 23.
Supply Outlook
In 2017 the automotive industry recorded an increase in global production of 2.6% to 80.2 million units compared with the previous year, and there is expected that global automotive production for 2023 reaches the 111.7 million units. The justification behind this growth is the increasing demand in cars from developing economies like China and India combined with a wither network of dealers and more attractive financing alternatives.
Raw materials and production factors
Automotive companies need raw materials to produce their vehicles which are divided into raw materials bought to a supplier, such as plastic and steel, and raw materials which are traded as commodities in organized markets, cooper, precious metals and aluminum. Raw materials represent 47% of cost of goods sold in automotive industry and the majority of these materials are steel, since 47% of one car on average is composed 47% by steel 8% by iron, 8% by plastic, 7% aluminum and 3% glass. Therefore, any fluctuation in the global steel prices will affect the production and will be highly connected with the impact on the companies’ profitability. Labor and machinery costs have a considerable weight on production costs, justifying why companies started to construct productions plants in Asia, since labor cost on these countries are slightly lower. – Figure 24.
Price fluctuations
For a consumer, an automobile normally is the second most expensive investment after a house. Since a car is a durable asset and is highly dependent on fuel, consumers will take in to account the current situation of fuel prices before investing in a car. Therefore, fossil fuels have a big impact on the pricing done by automotive companies on their models. The changes in fuel prices have negative repercussions on the prices of cars directly changing the demand and supply for these products. Since this industry has very low operating margins, an increase on automotive prices leads to a decrease in supplied units.
Government policies and taxes have a major impact in the supply of cars as well. Change in government policies, like the increase of tax paid per unit sold, more strict emissions rules and incentives to the acquisition of hybrid and electric cars can result in a change in supply of cars.
Competitors analysis
Since BMW has a portfolio more focused on reaching costumers which are looking for premium high-quality products, we can identify Audi, Mercedes, Volvo and Volkswagen as the major direct competitors, all brands with many high quality or luxury products. However, some indirect competitors such as Tesla have to be taken in consideration in a long-run perspective. Since Tesla is a company totally focused on the electric market, they have the needed know-how which somehow makes them unique when compared with other brands. Taking in to consideration all the segments covered by BMW, there is a tendency for the direct competitors to change slightly. – Figure 25. Compact SUV segment
This small segment registered very positive results, with a 25% total sales increase since 2016. BMW leads this market with the BMW X1 which sales grew 24% almost at the same pace as the segment. Audi Q3 was the model with the worst performance,
Source: WalletHub Q1 2018 Auto Financing Report
Source: Statista, EUR/CNY average annual exchange rate
Source: Market Realist, raw materials biggest cost driver auto industry
Source: Carsalebase, global car sales analysis 2017
9
0 50000 100000 150000 200000 Audi A3 Mercedes-Benz A-Class Bmw 1 Series 2016 2017 0 50000 100000 150000 200000 250000 Audi A4/A5 BMW 3 and 4 series VW Passat Mercedes-Benz C-Class 2017 2016Table 2 - Premium SUV segments sales on Europe
Figure 26 - Premium compact segment sales on Europe
Figure 27- Premium midsize segment sales on Europe
sales decreased 17% due to a certain cannibalization from the cheapest model Q2. This model only released in 2016 had an increase of 995% to 81,426 units. Mercedes GLA and Range Rover Evoque have a solid presence on this segment as well.
Medium SUV segment
Sales of midsized premium SUV’s continue to grow in Europe, representing 3.2% of the overall European market. During 2017 492,000 units were sold with the Mercedes-Benz GLC as the market leader reaching 100,000 units sold, the first model in this segment to achieve this figure. However, the sales of this model combine the standard and the coupe version, which doesn´t happen with many models.
Large SUV segment
A decline in sales numbers was recorded in 2017, the explanation for this performance may be the lack of new products. With this, sales dropped by 6% after three consecutive periods of considerable growth. Major players of this segment suffered decreases in sales, and the market leader BMW X5, was no exception with a 34% decrease. – Table 2.
Premium compact and small segment
This market is well established in Europe since many years, making it a very competitive and fragmented one. However, the German brands seem to have a clear dominance in this segment, with BMW being well placed on the rank with more than one model on most sold models during 2017. Contrarily to the Audi A3 and the Mercedes-Benz C-class which sales felt since 2016, BMW 1 Series’ sales grew by 4%. Regarding the premium small segment Mini almost lacks for competition, since their exclusive products allows the brand to be the most successful model of this segment, having almost half of the market share. – Figure 26.
Premium Midsize segment
As well as the premium compact, this segment is really competitive in Europe. The German brands control this segment as well, BMW is placed in the second place with 3 and 4 series, important to refer that the 3 series is the best-selling model of BMW. However, the C-class is slightly behind BMW in this segment, their model offers four distinct versions, coupe, station wagon, convertible and sedan whereas the BMW 3-series only offers a sedan and a station wagon version. The Volkswagen Passat has a heavy presence on this segment, since it is a slightly cheaper solution but still with high quality. - Figure 27.
Premium Large segment
The new BMW 5 series even with an increase of 35% since 2016, wasn’t able to outperform the Mercedes E-class. However, as in the Midsize segment the Mercedes model has four different versions instead of just two, as the BMW. Both models increased their market share in 7.7% reaching a total of 56.2%, showing the clear dominance of this two models. – Figure 28.
Electric segment
Since Automotive Industry is suffering some deep changes, is important to follow the new trends by being one of the top manufacturers in adopting these ones. With this, being capable to present electric cars solutions is very important to gain market share. That’s the path BMW is following, presenting hybrid versions within already existing models and creating new ones for electric cars. The European electric segment is growing considerably each year, recording a 33% increase in 2017. BMW i3 was the fourth most sold model, registering a 73% increase since 2016 to roughly 14,000 units. However, it’s far behind the Renault ZOE, which currently has twice cars sold. – Figure 29.
Source: Carsalesbase, European Sales 2017 premium compact segment
Source: Carsalesbase, European Sales 2017 premium midsize segment
Source: Carsalesbase, European Sales 2017 premium large segment
0 50000 100000 150000 Mercedes-Benz E-Class BMW 5 series Audi A6 Tesla Model S 2017 2016 16% 14% 10% 7% 6% 6% 3% 0,00% 5,00% 10,00% 15,00% 20,00% BMW Tesla Honda Toyota Daimler Ford Volkswagen
Figure 28 - Premium large segment sales on Europe
Figure 29 - Global OEMs – Electric mobility
Competitive Positioning
Government regulations lead to digitalization
Government policies and regulations are playing a big role when it comes to define the path which this industry will follow in the nearest future. To meet these new standards, companies will have to invest higher amounts of capital on R&D and adopt new technologies in order to follow the new trends. Regarding the European Union, the goals on CO2 emissions are rigorous, according to the European Commission, these
emission levels have to drop to 95g CO2/km by 2020, at the moment the average level
is 119g CO2/km, creating a big market opportunity for hybrid and electric cars. Besides
this, the industry as changed a lot thanks to the rapid growth of new technologies and costumer preferences. BMW is the company which is better adapting to the market new trends, according the 2017 survey conducted by KPMG, therefore leading in the field of connectivity and self-driving cars.
SWOT analysis
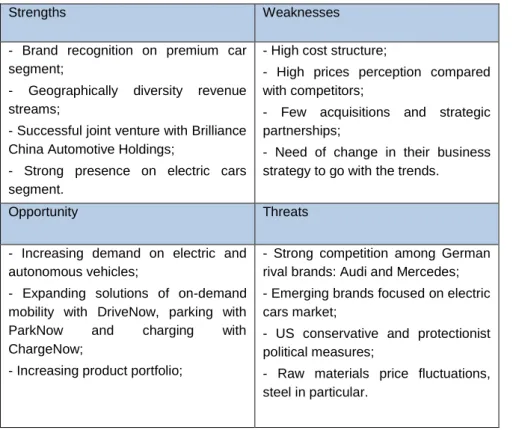
Strengths Weaknesses
- Brand recognition on premium car segment;
- Geographically diversity revenue streams;
- Successful joint venture with Brilliance China Automotive Holdings;
- Strong presence on electric cars segment.
- High cost structure;
- High prices perception compared with competitors;
- Few acquisitions and strategic partnerships;
- Need of change in their business strategy to go with the trends.
Opportunity Threats
- Increasing demand on electric and autonomous vehicles;
- Expanding solutions of on-demand mobility with DriveNow, parking with ParkNow and charging with ChargeNow;
- Increasing product portfolio;
- Strong competition among German rival brands: Audi and Mercedes; - Emerging brands focused on electric cars market;
- US conservative and protectionist political measures;
- Raw materials price fluctuations, steel in particular.
Table 3 - SWOT Analysis
Porter’s Five Forces
Threat of New Entrants (Medium - Low)
In order to start from scratch an automotive company and to compete with well-known brands in the premium segment is a hard task to accomplish. This industry has a very intense competition level, specially the premium segment. To penetrate such segment, there is a need of enormous amounts of funds, investment, highly qualified and skilled employees and engineers to build a recognized brand. Few companies are willing to invest in market full of risks, however, taking in to consideration the new trends of the industry (autonomous driving and electric cars) which BMW claims wanting to embrace for the future, new competitors like Tesla and Google with Waymo project, can be considered as a threat in the long-run perspective.
Source: Carsalesbase, European Sales 2017 premium large segment
Source: KPMG’s Global Automotive Executive Survey 2017
11
0 1 2 3 4 5 Competitve Rivalry Threats of New… Bargaining Power of… Bargaining Power of… Threats of Substitute…Figure 30 - Porter’s Five Forces
Bargaining Power of Suppliers (High)
BMW production of cars requires certain high-quality inputs and not all suppliers can meet those requirements. Therefore, BMW is highly dependent on those suppliers for supply of quality parts, conceding them a certain power. The delivery of the final products to the customers can be affected by the delay in those components as the production is highly dependent on it. BMW is very particular about working with the right suppliers because can affect the quality of the final products, making this a high risk if there is some sort of rupture with any suppliers.
Bargaining Power of Buyers (Medium-High)
Generally, the automotive industry has demanding costumers considering the amount which they cost on average and luxury cars customers are even more demanding. BMW has to provide updated information and advertise its products in order to reach their customers. These initiatives ensure that the company receives good reviews in magazines and online articles, since buyers rely a lot on expert reviews for information such as pricing, features and possible factory glitches.
Threat of Substitute Products (High)
Even though there are many automotive manufacturers, it is difficult to find a direct BMW substitute. This is because they invested heavily in the production of high quality and innovative vehicle brands. All BMW brands – Mini, Rolls Royce and BMW - cannot be found elsewhere in the market because of their unique features, however there are other premium manufacturers with very similar quality products, leading to an easier substitution of products. Government policies may play an important role in this subject since they encourage consumers to use more often public transports to reduce environmental emissions and traffic on the roads.
Competitive Rivalry (Very High)
There exists a large number of competitors on automotive industry, therefore BMW has a large list of international competitors. As BMW have a big market share and loyal customers, manufacturers like Mercedes-Benz and Audi, which engaged in an intense competition to become the world’s premium car leader, all manufacturers have the same market target and a similar positioning. Premium automotive industry is assessed to become even more competitive in the future, as the best manufacturers engage on the market new trends. – Figure 30.
Market Risk | Microeconomics (MR1)
Being a company which is highly dependent on markets such as China, US and Europe, makes BMW really permeable to geopolitical events and changes in tax regulations. However, even taking this threats into consideration, the probability of a new economic recession in the short term is low. Therefore, the economy will remain stable during the next years creating an opportunity for the company to grow.
Market Risk | Sector-specific (MR2)
BMW conducts operations in many regions, and each on has a different growth path and their sales are extremely dependent from European, Chinese and US market. In 2017, the European Economy grew 2.7% and it is expected to remain stable for the next years. On the other hand, Chinese Economy has been slowing down, registering a growth of 6.9% and it will continue to slow through the next years. US Economy grew 2.3% and will remain constant in the future.
6.
Investment Risks
Source: Student’s analysis
Figure 31 - Risk Matrix Market Risk | Demand is changing (MR3)
Automotive industry has followed new trends during the recent years and will continue to do so, car-sharing services, self-driving and electric cars will be the new demanded products. This reality affect companies’ business plans, since already existing models will have to be replaced by new ones. However, on the other hand it creates an opportunity to enter new markets. Regarding BMW, their market position and future strategies show that they are adapting progressively.
Operational Risk | Production and Technologies (OR1)
Risks relating to production processes and technology areas are particularly apparent in potential sources of interruptions in production or additional costs to comply with quality standards under charged market conditions. Production stoppages can be caused by fire, machine and tooling breakdown, IT disruptions, damage on infrastructures, transportation and logistical disruption. These scenarios can be mitigated through regular audit and continuing improvement of quality management, ensuring a high standard of quality.
Operational Risk | Supplier Risk (OR2)
Purchasing risks relate mainly to supply risks caused by the failure of a supplier as well as risks associated with lack of quality of bought parts. Productions problems incurred by the suppliers can lead to increased expenditure for the BMW Group, through the interruptions of production and corresponding reduction of sales. The increased threat of IT attacks on supplier network represent a big threat which can jeopardize all BMW’s production process.
Operational Risk | Information and Data protection (OR3)
Increasing digitalization across all areas of business requires higher levels of confidentiality, integrity and availability of information technology. Besides cybercrime, regulations covering the handling of personal data are becoming more stringent, if these risks materialize, they could have a high impact on earnings during more than one year. Lack of awareness or misconduct on the part of employees may also represent a huge risk to the confidentiality and integrity of available information. With cars being connected to the internet, more hack scandals can occur, putting in danger drivers.
Financial Risk | Foreign currency and interest rates (FR1)
Mitigation of foreign currency risk can be done through hedging plans and the interest rates by using financial derivatives such as interest and currency swaps, and other interest rates contracts.
Financial Risk | Liquidity (FR2)
Financial Services segment’s credit financing and leasing business turn to capital markets to finance their operations. Restricted access to funds because of the general market situation or crises on individual banks is one example of liquidity risk. With this the risk of BMW Group’s credit rating being downgraded, which would increase financial costs, can be considered as low. Since during the past years, BMW was never involved in some sort of scandals that could damage their image.
Regulatory and Legal Risk | Legal Risks (RLR1)
The increasing globalization of BMW Group’s operations and business interdependencies combined with the variety and complexity of legal provisions, such as increasingly import and export regulations, give rise to an increased risk non-compliance with the applicable law. However, BMW has a non-compliance management system, which ensures that all representative bodies and staff constantly act according to every law.
Source: Student’s analysis
13
BMW Group Valuation Price is €99.19, at 30 of August of 2018YE, using two valuation methods. With the Discounted Cash Flow or DCF method, the target price is €99.19 with a strong upside potential of 17.39%, with a BUY recommendation. The second valuation method, Relative Valuation gives a slightly more optimist scenario in which there is a BUY recommendation, since the target price is €113.13 translating to an upside potential of 33.88%. These results reflect in a clear way that BMW shares are well valued taking by reference the price at 30 of August of 2017.
Discounted Cash Flow Valuation Method and Free Cash Flows to the Firm
This valuation method is used to see how attractive an opportunity is. DCF analysis use future free cash flow projections and discounts them, using an adjusted discount annual rate to arrive to the present value of those projections. By doing this, and using the WACC rate to discount the FCFF, allows determining the Enterprise Value for the company, to which we can subtract the Net Debt value in order to obtain the market value of Equity
Revenues
Passenger combustion vehicle segment: this item includes the development
production and sales of vehicles with combustion. This includes BMW Group's individual car brands, like BMW, MINI and Rolls-Royce, however it includes only the models equipped with combustion engines. Since 2013, this segment recorded a 4-year historical average rate of 5%, however since 2014 the growth rate has been slowing down, reaching the lowest rate on 2017, and it will continue to decrease reaching negative values, due to consumers’ switch from combustion cars to BEV and PHEV cars. Taking this in to consideration, the average historical growth rate will not be considered, and I will assume a constant decreasing growth rate, reaching negative rates in 2020, 2021 and 2022.
Passenger BEV & PHEV segment: this item includes the development of vehicles
with full electric or hybrid plug-in engines and the production and sales of the respective. This includes BMW Group's individual car brands, like BMW, MINI and Rolls-Royce, however It includes only the models equipped with electric and hybrid plug-in engines. Since 2013 this segment has boomed, reaching a 4-year historical average rate of 80%, to refer that the period from 2013 to 2014 was excluded, since BMW started BEV production in 2013, and it recorded a growth of 472%. However, being this a new segment, an 80% is an unrealistic growth rate in the medium long-run, therefor it won’t keep up this pace until year 2022. BMW predicts to sell 140000 units by the end of 2018, and they are on track to do it, which will only represent an increase of 36% relating to 2017, when compared to the previous 80% 4-year historical average rate. BMW expectations are that in 2025, the number of BEV & PHEV units will reach 500000, to achieve this number I will assume a growth rate of 20% per year.
Motorcycle Segment: this item includes the development of motorcycles with
combustion and electric engines, and the production and sales of the respective. Since 2013 it has recorded very interesting figures, averaging a 4-year historical average growth of 9.5%. Being the seventh consecutive time BMW achieved a sale’s record, their goal is to continue with the expansion of this segment, establishing as a target for 2020, 200000 units in sales. The growth rate assumed will be the 4-year historical average rate of 9.5%, since it will meet BMW projections for 2020.
Financial Segment: this item represents financing and leasing activities of BMW cars
and motorcycles for private or retail customers. Financial services also have insurance solutions and banking products. In 2017, BMW recorded a value very similar to the previous year, which has been growing every single year since 2013. Therefore, is
7.
Valuation
0 50.000 100.000 150.000 2016 2017 2018F 2019F 2020F 2021F 2022FSource: Student’s analysis
Source: Student’s analysis
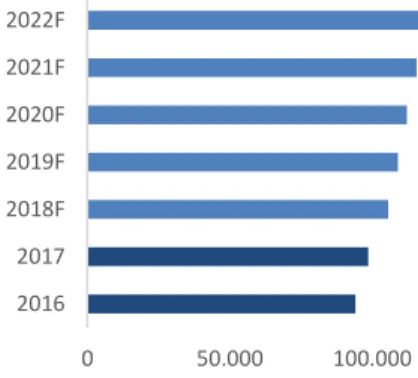
Figure 32 - Revenues Forecast (in millions of Euros)
expected that the value will grow at a constant rate of 8.6%, projected based on a 4-year historical average.
Eliminations: this item includes inter-segment transactions which relate primarily to
internal sales of products, provision of funds for the Group companies and the related interest. For the future, it is projected that this value will grow at a constant rate of 5.6%, projected base on a 4-year historical average. – Figure 32.
Net Debt
Net Debt was computed by considering Long and Short-Term Debt at the end of 2017 and by deducting to that value period’s Cash and Cash Equivalents, the used value was €85.609B.
Capital Expenditure (CAPEX)
BMW’s goals for the near future are in simple words, very ambitious, therefore, CAPEX levels will increase along the years. This increase is related with their high investment on new technologies related with BEV and PHEV vehicles, as well as the factories where both are assembled, example of that is the factory in Mexico, which will start operations 2019. Capital Expenditure for the next years was computed with a 5-year historical average, since the annual growth is almost the same each year.
WACC Assumptions
This valuation method, which stands for Weighted Average Cost of Capital, was used to compute BMW’s Group cost of equity. A company can use equity or debt to finance their operations and investments, and WACC gives back the costs of these types of financing, each weighted by its proportionate use in distinct situations.
In order to arrive to a final WACC discount rate, it is necessary to collect a reasonable amount of distinct data. All begun by computing BMW’s cost of equity rate, which has as variables, Risk Free Rate (RFR), Market Risk Premium (MRP) and Beta leveraged. For RFR two scenarios were considered, a short-term RFR, which was obtained with a 4-year Historical average of AAA Eurozone Government 30-year Bonds and a Terminal RFR computed with a 4-year historical average of AAA Eurozone Governmental 10-year Bonds considering data before 2008 crisis. The reason behind this differentiation is made, because today’s Economy is really stable, resulting in very low RFR, however, is very probable that in the long-term, a bad Economic cycle will affect RFR. Market Risk Premium was computed by performing a weighted rate considering MRP of the major Economies were BMW has operations, data was collected at Aswath Damodaran’s calculations in January 1 of 2018 spreadsheet and
a Beta Levered of 1.35 was considered, which was collected from Bloomberg portal. BMW’s cost of Debt is assumed 3.61% taking in consideration Aswath Damodaran’s computations for auto and auto partfs industry. BMW’s Corporate Tax Rate is considered to be 28.6% according to the assumptions made on the Forecast part and has a capital structure with a Debt Weight of 35.56% and an Equity Weight of 63.44%, both remaining stable throughout the years. WACC rate will remain stable throughout forecasted years, however, due to some uncertainty surrounding some major Economies where BMW operates, originates a perpetuity WACC of 6.37%. Terminal growth rate was considered as 1.30%, and was based on the forecasted Real GDP growth rate for Germany in 2022F, according to IMF World Economic Outlook 2018. – Table 4.
Cost of Equity
Risk-Free Rate (RFR) 1,43%
Terminal Value Risk-Free Rate (RFR) 3,89%
Market Risk Premium (MRP) 6,95%
Beta 1,35
Cost of Equity = RFR + 𝛽*(𝑀𝑅𝑃 + CRP) 10,82% Cost of Debt
Cost of Debt 3,61%
Corporate tax rate 28,63%
After-tax cost of debt 2,58%
Capital Structure
Debt to Value 64,40%
Equity to Value 35,60%
Terminal growth rate
Terminal growth rate 1,30%
Table 4 - WACC Assumptions Source: Student’s Analysis
15
Peers Selection
To determine BMW’s peers some financial indicators were taken in to consideration in order to filter the innumerous companies, which operate on automotive and finance sector. As market indicators, Enterprise Value, Equity Value, Debt Value, Cash and Cash Equivalents and Net Debt were seleted and as accounting indicators the ones considered were Sales, EBITDA and EBIT.
By considering taking in to consideration all there financial indicators, the final candidates to peers are Daimler AG, Volkswagen AG, Peugeot SA, Renault SA and FIAT NV.
Relative Valuation Approach
Based on several valuation techniques it was possible to have a more accurate final output. This includes some forward multiples such as EV/Sales, EV/EBITDA and EV/EBIT, allowed to achieve a final target price of €113.13, with a upside potential of 33.88%, a slightly more optimistic scenario than the DCF valuation method.
Appendixes
Appendix A: Balance Sheet Statement
A.1 - Projected Balance Sheet Statements
Source: Company data and student analysis
Source: Company data and student analysis
2016 2017 2018F 2019F 2020F 2021F 2022F
Non-Current assets 121.671 121.901 135.812 150.173 165.366 181.499 198.658
Intangible Assets 8.157 9.464 10.994 12.581 14.229 15.938 17.713
PP&E 17.960 18.471 21.899 25.216 28.404 31.448 34.330
Leased products 37.789 36.257 39.551 43.144 47.064 51.339 56.003
Investments accounted for using the equity method 2.546 2.767 2.861 2.955 3.050 3.151 3.255
Other investments 560 690 713 737 761 786 812
Receivables from sales financing 48.032 48.321 53.388 58.986 65.170 72.004 79.554
Financial Assets 2.705 2.369 2.871 2.966 3.052 3.145 3.247 Deferred tax 2.327 1.927 1.927 1.927 1.927 1.927 1.927 Other assets 1.595 1.635 1.608 1.661 1.709 1.761 1.818 Current Assets 66.864 71.582 82.654 91.331 102.506 114.793 128.304 Inventories 11.841 12.707 13.650 14.662 15.750 16.919 18.174 Trade receivables 33053 34780 38.292 42.171 46.458 51.196 56.433 Financial assets 7.065 7.965 7.780 8.037 8.271 8.521 8.798 Current Tax 1.938 1.566 1.566 1.566 1.566 1.566 1.566 Other Assets 5.087 5.525 5.905 6.099 6.277 6.467 6.677
Cash and cash equivalents 7.880 9.039 15.462 18.795 24.183 30.124 36.657
Total Assets 188.535 193.483 218.467 241.504 267.872 296.292 326.962
Equity attributable to shareholders of BMW AG 47.108 54.112 60.312 67.717 75.642 84.134 93.240
Subscribed Capital 657 658 658 658 658 658 658
Capital reserves 2.047 2.084 2.084 2.084 2.084 2.084 2.084
Revenue reserves 44.445 51.256 57.456 64.861 72.786 81.278 90.384
Accumulated other equity -41 114 114 114 114 114 114
Minority interest 255 436 436 436 436 436 436
Total Owners Equity 47.363 54.548 60.748 68.153 76.078 84.570 93.676
Non-Current provisions and liabilities 73.183 69.888 78.865 86.859 96.379 106.696 117.895
Pension provisions 4.587 3.252 4.002 4.002 4.002 4.002 4.002
Other provisions 5.039 5.437 5.437 5.437 5.437 5.437 5.437
Deferred tax 2.795 2.241 2.241 2.241 2.241 2.241 2.241
Financial Liabilities 55.405 53.548 60.854 67.772 76.032 84.874 94.348
Other Liabilities 5.357 5.410 6.330 7.407 8.668 10.142 11.868
Current provisions and liabilities 67.989 69.047 78.853 86.492 95.414 105.026 115.391
Other provisions 5.879 6.313 6.313 6.313 6.313 6.313 6.313
Current Tax 1.074 1.124 1.124 1.124 1.124 1.124 1.124
Financial Liabilities 42.326 41.100 49.023 54.595 61.249 68.372 76.004
Trade payables 8.512 9.731 10.404 11.123 11.892 12.714 13.593
Other Liabilities 10.198 10.779 11.990 13.337 14.836 16.503 18.357
Total Owners Equity and liabilities 188.535 193.483 218.467 241.504 267.872 296.292 326.962
17
A.2 - Common-Size Balance Sheet
Source: Company data and student analysis
Source: Company data and student analysis
b In millions € 2016 2017 2018F 2019F 2020F 2021F 2022F Non-Current assets 64,5% 63,0% 62,2% 62,2% 61,7% 61,3% 60,8% Intangible Assets 4,3% 4,9% 5,0% 5,2% 5,3% 5,4% 5,4% PP&E 9,5% 9,5% 10,0% 10,4% 10,6% 10,6% 10,5% Leased products 20,0% 18,7% 18,1% 17,9% 17,6% 17,3% 17,1%
Investments accounted for using the equity method 1,4% 1,4% 1,3% 1,2% 1,1% 1,1% 1,0%
Other investments 0,3% 0,4% 0,3% 0,3% 0,3% 0,3% 0,2%
Receivables from sales financing 25,5% 25,0% 24,4% 24,4% 24,3% 24,3% 24,3%
Financial Assets 1,4% 1,2% 1,3% 1,2% 1,1% 1,1% 1,0% Deferred tax 1,2% 1,0% 0,9% 0,8% 0,7% 0,7% 0,6% Other assets 0,8% 0,8% 0,7% 0,7% 0,6% 0,6% 0,6% Current Assets 35,5% 37,0% 37,8% 37,8% 38,3% 38,7% 39,2% Inventories 6,3% 6,6% 6,2% 6,1% 5,9% 5,7% 5,6% Trade receivables 17,5% 18,0% 17,5% 17,5% 17,3% 17,3% 17,3% Financial assets 3,7% 4,1% 3,6% 3,3% 3,1% 2,9% 2,7% Current Tax 1,0% 0,8% 0,7% 0,6% 0,6% 0,5% 0,5% Other Assets 2,7% 2,9% 2,7% 2,5% 2,3% 2,2% 2,0%
Cash and cash equivalents 4,2% 4,7% 7,1% 7,8% 9,0% 10,2% 11,2%
Total Assets 100,0% 100,0% 100,0% 100,0% 100,0% 100,0% 100,0%
Equity attributable to shareholders of BMW AG 25,0% 28,0% 27,6% 28,0% 28,2% 28,4% 28,5%
Subscribed Capital 0,3% 0,3% 0,3% 0,3% 0,2% 0,2% 0,2%
Capital reserves 1,1% 1,1% 1,0% 0,9% 0,8% 0,7% 0,6%
Revenue reserves 23,6% 26,5% 26,3% 26,9% 27,2% 27,4% 27,6%
Accumulated other equity 0,0% 0,1% 0,1% 0,0% 0,0% 0,0% 0,0%
Minority interest 0,1% 0,2% 0,2% 0,2% 0,2% 0,1% 0,1%
Total Owners Equity 25,1% 28,2% 27,8% 28,2% 28,4% 28,5% 28,7%
Non-Current provisions and liabilities 38,8% 36,1% 36,1% 36,0% 36,0% 36,0% 36,1%
Pension provisions 2,4% 1,7% 1,8% 1,7% 1,5% 1,4% 1,2%
Other provisions 2,7% 2,8% 2,5% 2,3% 2,0% 1,8% 1,7%
Deferred tax 1,5% 1,2% 1,0% 0,9% 0,8% 0,8% 0,7%
Financial Liabilities 29,4% 27,7% 27,9% 28,1% 28,4% 28,6% 28,9%
Other Liabilities 2,8% 2,8% 2,9% 3,1% 3,2% 3,4% 3,6%
Current provisions and liabilities 36,1% 35,7% 36,1% 35,8% 35,6% 35,4% 35,3%
Other provisions 3,1% 3,3% 2,9% 2,6% 2,4% 2,1% 1,9%
Current Tax 0,6% 0,6% 0,5% 0,5% 0,4% 0,4% 0,3%
Financial Liabilities 22,4% 21,2% 22,4% 22,6% 22,9% 23,1% 23,2%
Trade payables 4,5% 5,0% 4,8% 4,6% 4,4% 4,3% 4,2%
Other Liabilities 5,4% 5,6% 5,5% 5,5% 5,5% 5,6% 5,6%