Vol.53, n. 5: pp. 1155-1160, September-October 2010
ISSN 1516-8913 Printed in Brazil BRAZILIAN ARCHIVES OF
BIOLOGY AND TECHNOLOGY
A N I N T E R N A T I O N A L J O U R N A L
Wind Power Characterization in the Lages City – SC, Brazil
Olívio José Soccol
1*, Danieli Bariviera Zitterell
1, Mario Nestor Ullmann
1and David José
Miquelluti
21Departamento de Agronomia; Universidade do Estado de Santa Catarina, C. P.: 281; 88520-000; Lages - SC –
Brasil. 2Departamento de Solos e Recursos Naturais; Universidade do Estado de Santa Catarina; C. P.: 281; 88520-000; Lages - SC - Brasil
ABSTRACT
The main objective of this work was to determinate the nominal wind and the wind power, based on mathematical adjustments in the Lages city, SC-Brazil. The study used data comprising the period between 1976 and 2006. The wind average velocity was osted by Lages Meteorological Station located at 27°49’S, 50°12’ W, and 937 meters of altitude. For the estimated wind temporal distribution, a methodology based on wind velocity curves was used. The nominal velocity that made wind power maximum in Lages was 10.33 km h-1 77 days long. This velocity provides an average wind power 16.6 W m-2 annually. The results showed that wind power cow be characterized as a simple alternative to be used in agriculture.
Key words: wind power, nominal wind, renewable alternatives
*Author for correspondence: [email protected]
INTRODUCTION
In the beginning of 1970’s, the world oil crisis stimulated the development of alternatives for energy production which could decrease the dependence on petroleum and charcoal. Wind power, as a clean, renewable and available energy source anywhere, has became a crucial matter of studies which point out Brazil as a great potential holder. Wind power can be applied into a useful form, such as electricity, using wind turbines, as well in agriculture (windmills), where wind energy is used directly as mechanical energy for pumping water or grinding grain. Its utilization is based on the transformation of wind kinetic energy into mechanical energy through an aerodynamics rotor; in turn that mechanical energy can be transformed in electrical potency through an electrical
intensity knowledge, constancy and duration are important. There is no wind engine able to works efficiently in all levels of wind speed. In spite of the great energy potential of high-speed winds, the total time of their occurrence during the year is on. The adoption of a value from an instantaneous local medium or maximum speed is of little significant, and it can generate a supermeasurement of the structures to capture that energy source, resulting in sub-utilization systems (Marques Júnior et al., 1996).
For the adequate performance of the wind engine, according to the wind profile of area, its project and construction should have basis on the named “nominal speed”, which renders maximization to the annual wind energy power.
The purpose this work was to determine, from mathematical agreements, the duration curve of wind power based on daily average speeds for 365 days/year, determination of wind nominal speed and estimation of the annual available energy and its respective time which a wind engine can supply to Lages, Santa Catarina, Brazil, from 1976 to 2006.
MATERIALS AND METHODS
Daily average wind speed data were obtained from Environmental Resources and Hidrometeorology Information Center State of Santa Catarina – CIRAM, corresponding to collected data at 10 meters height, in Lages Meteorological station, SC (Latitude S. 27°49’ and Longitude W. 50°12’, altitude 937 m). Analyzed from series were taken 31 years of observation (from 1976 to 2006). For the estimation of temporal wind distribution, methodology based on wind speed curves was used. Those are understood as distribution relating wind speed with number of the days in a year (Mialhe, 1980). That relation can be obtained grouping daily wind average speed in class intervals. For each level, the number of the days was summed when the daily average speed was higher or equal to the speed of that pre-established level, resulting in an accumulated data curve, i.e., number of the days in a year when a value of wind
wind speed, occurred.
Nominal wind speed was obtained ordering the levels of daily average speeds in a crescent order, putting them to the cube and multiplying by the days in which highs they were equal or. Nominal speed was the speed corresponding to the maximum founded product. From nominal speed, the maximum wind power available by unit area was obtained by the following expression (Mialhe, 1980):
g 2
V . P
3 ar γ
= (1)
where: P – wind power available by unit area, in kgm s-1 m-2; γar – specific air mass, in kg m
-3
; g – gravity acceleration in m s-2 and V – nominal wind speed in m s-1.
RESULTS AND DISCUSSION
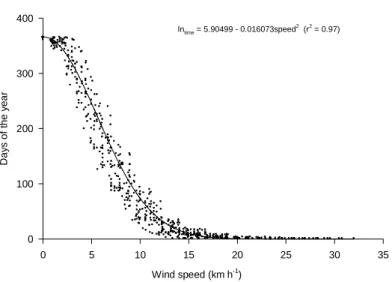
Wind speed curves were generated from the accumulation of daily wind speed values according to the number of the days when a specific speed value. The procedure was made for each year from 1976 to 2006. Adjustment from the series of 31 years generated curves showed a medium curve which could represent all the studied years (Fig. 1). The adjusted model was significant at p < 0.0001 using the F – test. Curve in Figure 1 demonstrated how many days a year had a lower or equal value to a specific wind speed value. For example, there were 300 days year in Lages when wind speed was lower or equal to 3.5 km h-1.
Wind speed (km h-1)
0 5 10 15 20 25 30 35
D
a
y
s
o
f
th
e
y
e
a
r
0 100 200 300 400
lntime = 5.90499 - 0.016073speed 2
(r2
= 0.97)
Figure 1 - Adjustment of wind speed curves occurring from 1976 to 2006 for the studied region.
Figure 2 shows the results with relation to the duration curve of wind power in Lages (year 1976), considering a wind engine installed at 10 m from the soil surface, with starting and ending speed 5 and 30 km h-1, respectively. The rectangular area “omrs” represented the energy that could be obtained if the wind engine was working completely during all year. Area among the points “omnpq” corresponded to the available energy yearly, taking into account the aeolian installation with the specific operational characteristics. Relation among these areas
represented a yearly charge factor, which was the energy that could be obtained if the wind engine was working completely during all year (365 days). Thal curve established for all the studied years and the yearly medium charge factor form 1976 to 2006 was obtained by the relation between “omnpq” and “omrs” areas (= 36.55%). Multiplying that factor by 365 days, it reached the available specific energy, which corresponded to the equivalent number of wind engine full-working days (total period in Lages = 133 days).
Duration (in days)
0 50 100 150 200 250 300 350
S
p
e
e
d
(
k
m
h
-1 )
to
t
h
e
cu
b
e
0 2000 4000 6000 8000 10000 12000 14000 16000 18000
Curve of power duration Nominal speed
Closing speed (30 km h-1)
Starting speed (5 km h-1) Full power
(30 km h-1
)
o
m n
p q
r
the measurement of wind engine be based on nominal speed value, because they represent performance variation levels. Figure 3 illustrates the wind power generated in kW m-2 of the effective capitation area from the wind engine yearly. Nominal speed which rendered maximum wind power in Lages was the daily medium speed of 10.33 km h-1 during 77 days.
From the nominal speed of each year, the gross power in kW m-2 year-1 was obtained. Average gross power generated for the period was 90,361.45 kW m-2 year-1. With a wind engine medium return of 20%, the effective power generated by m2 of the effective capitation area was 18,072.29 kW m-2 year-1.
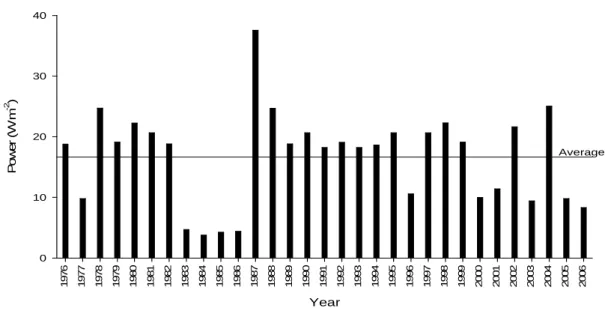
Figure 4 shows the wind power available by unit area of the wind engine (W m-2) obtained from the average nominal speed of each year and calculated the part from expression 1. Oliveira et al. (2003), characterized the aeolian power in Cascavel region, PR, the average wind speed was higher to 3 m s-1 and the generated aeolian power surpass 15 W m-2, which suggested there was viability for using an aeolian system for energy generation. In this study, energy power varied from 3.7 W m-2
was 16.6 W m-2, so making possible its application in agriculture. Oliveira et al. (2003) reposted that aeolian power tended to increase through the years, suggesting a greater application. Baptista da Silva et al. (2004) reposted that the rotor area of the wind engines was frequently higher than 1 m2, which increased considerably the wind power. Another way to increase the generated power is reaching greater wind speeds, found at high altitudes. The estimations of wind speed are determined at 10 m from the soil surface and these can be converted for any height through the power law (Tubelis and Nascimento, 1980):
= o o z z z z V V 1 2 1 2 ln ln (2)
where: V1 - wind speed in height z1; zo – height of
parameter shriveled.
Therefore, it is possible to estimate the generated power to a certain wind engine installation height.
Year 1 9 7 6 1 9 7 7 1 9 7 8 1 9 7 9 1 9 8 0 1 9 8 1 1 9 8 2 1 9 8 3 1 9 8 4 1 9 8 5 1 9 8 6 1 9 8 7 1 9 8 8 1 9 8 9 1 9 9 0 1 9 9 1 1 9 9 2 1 9 9 3 1 9 9 4 1 9 9 5 1 9 9 6 1 9 9 7 1 9 9 8 1 9 9 9 2 0 0 0 2 0 0 1 2 0 0 2 2 0 0 3 2 0 0 4 2 0 0 5 2 0 0 6 A v e ra g e G e n e ra te d w in d p o w e r (k W m
-2 y
e a r -1 ) 0 20x103 40x103 60x103 80x103 100x103 120x103 140x103 160x103 Gross power Effective power
Year 1 9 7 6 1 9 7 7 1 9 7 8 1 9 7 9 1 9 8 0 1 9 8 1 1 9 8 2 1 9 8 3 1 9 8 4 1 9 8 5 1 9 8 6 1 9 8 7 1 9 8 8 1 9 8 9 1 9 9 0 1 9 9 1 1 9 9 2 1 9 9 3 1 9 9 4 1 9 9 5 1 9 9 6 1 9 9 7 1 9 9 8 1 9 9 9 2 0 0 0 2 0 0 1 2 0 0 2 2 0 0 3 2 0 0 4 2 0 0 5 2 0 0 6 P o w e r (W m -2 ) 0 10 20 30 40 Average
Figure 4 - Power (W m-2) generated by the nominal wind speed for each studied year.
RESUMO
Nos últimos anos, aumentaram os estudos sobre energias renováveis como uma alternativa às fontes convencionais. O objetivo do trabalho foi determinar, a partir de ajustes matemáticos, a velocidade nominal do vento e o potencial eólico para o município de Lages-SC baseado em dados de velocidade média diária entre os anos de 1976 a 2006. Os dados de velocidade média do vento foram coletados a 10 m de altura, na Estação Meteorológica de Lages, SC, situada a 27o49’ de latitude Sul e a 50o12’ de longitude Oeste, a 937 metros de altitude. Para a estimativa da distribuição temporal do vento, utilizou-se metodologia baseada em curvas de velocidade do vento. A velocidade nominal que torna máximo o potencial eólico em Lages é de 10,33 km h-1 com duração de 77 dias fornecendo uma potência média anual de 16,6 W m-2, viabilizando seu uso na agricultura, caracterizando uma alternativa simples.
ACKNOWLEDGMENTS
We wish to thank Center of Information of Environmental Resources and Hidrometeorology of Santa Catarina – CIRAM, for supplying wind speed data used in this paper.
REFERENCES
Baptista da Silva, J.; Souza, D. O.; Zepka, G. S. (2004), Análise do potencial eólico de algumas localidades do Estado do Rio Grande do Sul. Revista Brasileira de Agrometeorologia, 12, 159-165.
García, F. H. (2004), Análise experimental e simulação de sistemas híbridos eólico-fotovoltaicos. Doctorate Thesis, UFRGS, Porto Alegre, Brasil.
sustentáveis: um estudo sobre a viabilidade da utilização da energia eólica em três localidades, no RS. Msc. Thesis, UFRGS, Porto Alegre, Brasil. Mialhe, L. G. (1980), Máquinas Motoras na
Agricultura. Editora da Universidade de São Paulo, São Paulo.
Oliveira, C. E. L.; Frühling, I.; Uribe-Opazo, M. A. (2003), Análise climatológica do potencial eólico na região de Cascavel – PR. Engenharia Agrícola, 23, 425-433.
Parikh, M. M.; Bhattacharya, A. K. (1984), Wind data analysis for studying the fesiability of using windmills for irrigation. Energy in Agriculture, 3, 129-136.
potencial eólico do estado de São Paulo, Coletânea de artigos: Energia solar e eólica, V. 2 Rio de Janeiro, pp. 249-253.
Tubelis, A.; Nascimento, F.J.L. (1980), Meteorologia descritiva: Fundamentos e aplicações brasileiras. Livraria Nobel S.A., São Paulo. 374p.