BJRS
RADIATION SCIENCES
07 (2019) 01-14ISSN: 2319-0612 Accepted 2018-08-07
Monte-Carlo modeling for evaluation of two different
calculation algorithms
Seniwal
1,2,3B., Fonseca
1T. C. F., Singh
3R.
1Universidade Federal de Minas Gerais Departamento de Engenharia Nuclear – DEN Pós-Graduação em
Ciências e Técnicas Nucleares, 31270-901, Belo Horizonte, Brasil
3Centre for Medical Physics, Panjab University.
2Department of Radiotherapy & Oncology, PGIMER, 160014, Chandigarh, India.
ABSTRACT
Modeling of linac head (VARIAN Trilogy) for 6 MeV photon beam was performed using BEAMnrc code package (BEAMnrc 2017). The DOSXYZnrc code was used to determine the percentage depth dose (PDD profiles) and beam profiles for different symmetric square field sizes, i.e., 5cm X 5cm up to 40cm X 40cm. The DICOM images of Alderson Radiation Therapy (ART) RANDO Phantom were used. Four field 3D-CRT treatment plans were generated using AAA, PBC, and Monte-Carlo (MC). It was found that nominal energy of 5.7 MeV with FWHM of 1.2 mm provides best matching of modeled and working linac. All three 3D-CRT plans calculated with AAA, PBC and MC on a Pelvic Rando phantom were compared using CERR (Computational Environment for Radiotherapy Research) and MATLAB 2013b. It was found that AAA and PBC have comparable results, although in case of tissue interfaces and inhomogeneous media AAA provides better accuracy in comparison to PBC. It can also be observed that AAA and PBC underestimate doses in comparison to MC in the soft muscle tissue which includes OARs such as bladder, bowel bag, and PTV TOTAL. It was found that both AAA and PBC fails to account for tissue air interface accurately and shows variation of 30-40% whereas for surface dose variation of +/-10% was observed. In homogeneous media (muscle tissue) AAA and PBC underestimate doses in comparison to MC. These commercially available algorithms overestimate and underestimate dose values as compared to MC based dose calculation for low and high dose regions specially.
Keywords: 3-Dimensional Conformal Radiation Therapy, Anisotropic Analytical Algorithm, Pencil Beam Convolution , Monte Carlo
1.
INTRODUCTIONIn medicine, the radiation is primarily used either for the diagnosis or the treatment of benign or malignant tumors. The use of ionizing radiation during diagnostic procedures, e.g., CT and diagnostic X-rays, involves interaction with the patient as well as the detector system. In therapeutic application of radiation, rapidly growing cancer cells are made more susceptible to radiation by various methods. For example, (a) dose delivered over a period of a few weeks so that the normal tissues which are exposed to ionizing radiation repairs from sub-lethal damages during the time between two successive fractions, (b) irradiating the tumor with radiation beams from several directions so that the doses to surrounding tissue are kept much smaller than dose to the tumor and (c) use of appropriate drugs before treatment which either increases the radio sensitivity of tumor cells or makes normal cell radio-resistant [1].
In Radiation therapy (RT), ionizing radiations (in MeV range), e.g., X-rays, γ-rays and electron beam are used for the treatment of cancer. The therapeutic dose of ionizing radiation is delivered to inactivate and stop the proliferation of the tumor cells. The aim of RT is to maximize the dose to the tumor volume while sparing the normal tissues/organs. The treatment planning is a very important step in achieving this goal of radiotherapy [2]. Currently, the commercially available treatment planning systems (TPS) are using dose calculation algorithms which are applying several approximations for computing the dose delivered by the radiation beam. These algorithms apply analytical approximations for the calculation of the delivered dose [3]. Such estimates lead to inaccuracy in the computed values of beam parameters. Monte-Carlo (MC) methods have established reputation to accurately calculate the dose delivered by the radiation beam as these methods do not inherently use any approximations for computation of dose distribution. These methods have a capability of determining the dosimetric and spectral characteristics of radiation beam accurately. Therefore, in this study an accurate model of 6 MV photon beam produced by Varian linac (Trilogy model) was developed using BEAMnrc (EGSnrc 2017) and the geometric specifications provided by the vendor. To develop the model of linac the Component Modules (CM) of BEAMnrc were used as building blocks. For example SLAB CM was used to define the target, similarly other CMs were used to define primary collimator, beryllium window, flattening
filter, ion chamber, secondary jaws and phase-space was scored below the jaws. Once the basic model was developed than the different combinations of kinetic energy of incident electrons (MeV) and Full Width Half Maximum (FWHM) (mm) were used to validate the modeled linac structure. To validate the accuracy of the model various dosimetric parameters calculated using the simulation model were compared to the experimental measured data (PDD, In-line, cross line profiles for different field). The DICOM (Digital Imaging and Communications in Medicine) images of ART Rando phantom were used to generate the treatment plans using the Eclipse (VARIAN) TPS version 11.0. The dose was calculated using AAA (Anisotropic Analytical Algorithm), PBC (Pencil Beam Convolution) and the Monte-Carlo code EGSnrc (Electron Gamma Shower national research centre, Canada). Finally the dose distribution in different organs at risk (OARs) and target volumes was studied.
2.
MATERIALS AND METHODS 2.1. Modeling linac head and validationThe medical linear accelerator Trilogy Tx has dual photon energy (6 MeV and 15 MeV) and multiple electron energies (6 MeV, 12 MeV, 15 MeV and 18 MeV). In this study a 6 MeV photon beam was modeled using BEAMnrc code package (BEAMnrc 2017) [4] using the geometrical specifications provided by the vendor. BEAMnrc utilizes the EGSnrc Monte-Carlo code which can mimic electron-photon transport. The percentage depth dose (PDD) was obtained for different sizes of square beam (5cm X 5cm; 10cm X 10cm; 20cm X 20cm; 30cm X 30cm; 40cm X 40cm) using DOSXYZnrc (2017) [5,6].
To compute the PDD and beam profiles for different field sizes of the modeled linac head the simulations were performed in mainly three steps: (i) phase space files for that particular field size were scored just below the secondary collimators (Jaws) using BEAMnrc, (ii) these phase space files were used as an input for the water phantom modeled (50 X 50 X 50 cm3, voxel size of 0.2 X 0.2 X 0.2 cm3) in DOSXYZnrc and 3ddose (dose matrix) files were obtained, (iii) STATDOSE standalone code provided with EGSnrc was used as a tool for analyzing and indexing the voxels to take into account the region of interest to determine the beam profiles and PDD profiles. For
experimental data Radiation Field Analyzer (RFA) (Blue phantom, IBA, Germany) was set up and beam profiles and PDD profiles were obtained using CC13 cylindrical chamber (IBA, Germany) with a step size of 2 mm. The computed dose profiles were compared with the experimental profiles using the Origin 8.0 software and linac model was tuned by changing the Full-Width Half Maximum (FWHM) and electron energy [7,8,9].
2.2. The TPS dose calculation using different algorithms
The DICOM images of the RANDO Phantom were transferred to Eclipse Treatment Planning System (TPS) 11.0. For delineation of critical organs and target volume (Planning Target Volume (PTV)) library plan of “Carcinoma Vulva” was chosen and with smart segmentation tool all structure set like: Planning Target Volume (PTV), Bladder, Rectum, Femoral Heads, bones etc. were delineated. Two 3-Dimensional Conformal Radiation Therapy (3D-CRT) treatment plans were generated using Eclipse (VARIAN) TPS AAA and PBC as dose calculation algorithms using the Source to Axis Distance (SAD) technique.
2.3 Modeling of CT phantom using CT data sets
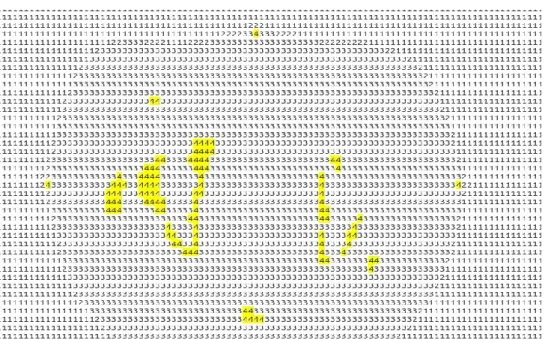
The CT (computed tomography) phantom option of DOSXYZnrc was used to model the DICOM images and obtain the dose distributions. CT phantoms can be generated from the DICOM images using ctcreate (standalone code provided with EGSnrc package). Fig. 1. shows slice of Rando Phantom in .egsphant file obtained using CTCREATE from DICOM images.
For simulating the four field isocentric 3D-CRT treatment plan in EGSnrc four phase space files for field sizes and gantry angles 19.6x28.3 cm2, 0˚(Anterior field (ANT)); 20.7x18.4 cm2, 90˚ (Left lateral (LL)); 20.3x18cm2, 270˚ (Right Lateral (RL)); 19.8x27.3 cm2, 180˚ (Posterior (POST)) with Source to Axis Distance (SAD) 100cm were obtained using BEAMnrc. Than these phase space files and .egsphant file were used as input DOSXYZnrc; 3ddose files were obtained. Figure 2, summarizes the process of obtaining dose distribution when phasespace is used as a radiation source. The electron and photon transport cutoff parameters used in BEAMnrc and
DOSXYZnrc were ECUT = AE = 0.7MeV and PCUT = AP = 0.01 MeV; Electron range rejection was turned on in BEAMnrc and a value of 2MeV was used. Directional bremsstrahlung splitting, a variance reduction technique was also used with Brem splitting number of 1000 [10]. Large numbers of histories (5x 10⁹) were used to obtain a statistical uncertainty of less than 1% in dose calculation.
Figure 1:.Slice of CT phantom generated using CTCREATE, yellow color showing the high
density material (bones and fiducial markers).
Figure 2:.Link between BEAMnrc and DOSXYZnrc when phasespace is used as a radiation
2.4 Comparing the dose calculation models
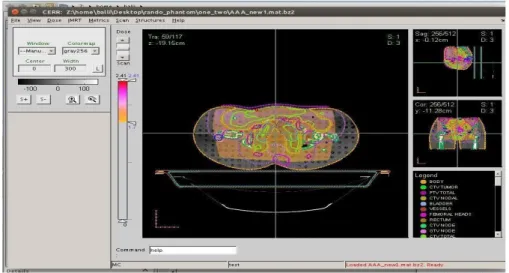
For comparing the dose distribution obtained from various algorithms; i.e., MC, AAA, PBC, a MATLAB based software CERR (Computational Environment for Radiotherapy Research) was used [11]. The CT data sets were imported to CERR along with the structures and doses from all the treatment plans as shown in Fig.2. MATLAB codes were written to add dose matrix from .3ddose files to the CT data sets, and different dose parameters were obtained from the dose volume histogram (DVH).
Figure 2: The dose distribution obtained with Monte Carlo simulation for the four field
treatment plan.
3. RESULTS AND DISCUSSION
3.1 Comparison Of beam characteristics of the modeled and working linac
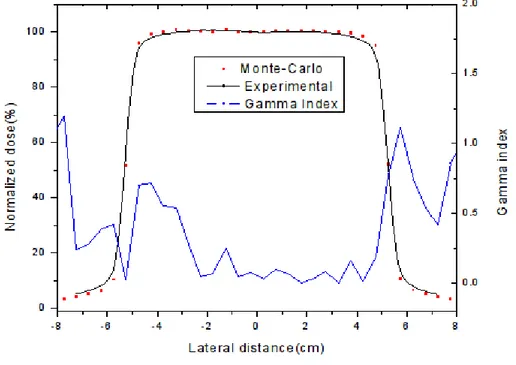
The present study is a quantitative analysis for the evaluation of accuracy of AAA, PBC dose calculation algorithm with respect to Monte-Carlo techniques. The TPS calculated doses were compared to the computed dose obtained using MC techniques. The beam characteristic data of working and modeled linac, that is, PDD and Beam Profiles, were analyzed using origin 8.0 software. The beam profile of working and modeled linac for 10 cm X 10 cm field size and the gamma index which shows the percentage variation between
the two curves in terms of 1% (Dose difference) - 1 mm (Dose to Distance Agreement represented as the blue curve ) shown in Fig. 3.
Figure 3 : The beam profile of working and modeled linac for 10 cm X 10 cm field size and
blue curve represents the gamma index which fulfills the condition of 1%-1 mm.
3.2 Comparison of dose distribution obtained with MC, AAA, PBC
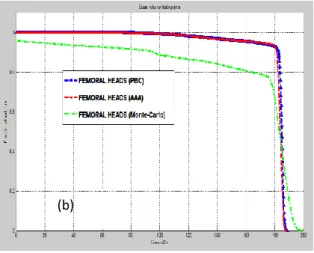
Figure 4 shows the comparison of Dose Volume Histograms (DVH) of 3-DCRT plans. This was calculated for the AAA, PBC and MC on phantom, it was found that AAA and PBC have comparable results, although in case of tissue interfaces and inhomogeneous media AAA is more accurate than PBC.
Figure 4 : Dose Volume Histogram comparison for different dose calculation algorithms
(AAA, PBC, MC) according to 1.8 Gy/fraction for (A) PTV TOTAL, (B) Femoral Heads, (C) Bladder, (D) Bone, (E) Rectum, (F) Bowel Bag.
(a) (b) (c) (d) (e) (f)
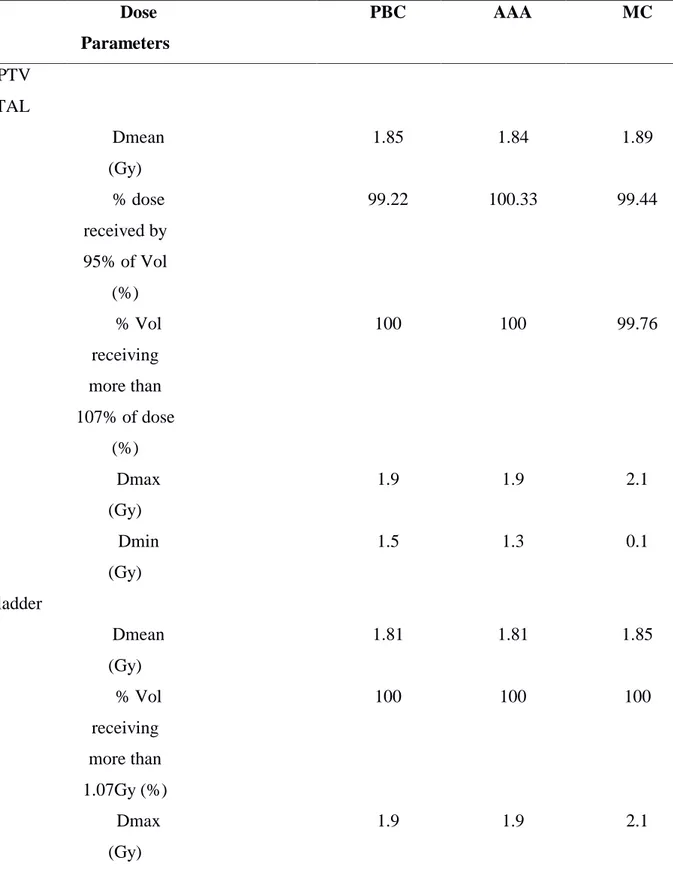
It can also be observed that AAA and PBC underestimate doses in comparison to MC in the soft muscle tissue which includes OARs as well as the target such as bladder, bowel bag, and PTV TOTAL whereas overestimation in dose is observed in case of bones and femoral heads (Table 1). Similar results were obtained by Gagné et al [12] and F Hasenbalg et al [13] and AAA are found to be more accurate as compared to PBC in the clinical practice. Whereas these algorithms overestimate doses in comparison to MC in low dose region (Table 1, Dmin values obtained with AAA, PBC are higher in comparison to MC) and underestimate in high dose region is also observed (Table 1. Dmax values obtained with AAA, PBC are smaller in comparison to MC).It is well known that MC methods are more accurate in comparison to commercially available dose calculation algorithms as they utilizes pure physics principles but as it takes a lot of time to model treatment plans with MC and using higher number of histories to get high accuracy results. This limits the use of pure MC methods in clinical practice.
It was found that for PTV TOTAL the mean doses show a variation of -0.5% and 0.9%, respectively for PBC and AAA with respect to (w.r.t.) doses evaluated by MC simulations. Dmax of AAA and PBC shows underestimation of 9.5% and Dmin large overestimation of dose for both AAA and PBC (Table 1). Maximum doses are found to be same for both algorithms and their values are underestimated as compared to MC simulations. Significantly large variation was observed for minimum doses for both algorithms w.r.t MC calculations. In case of bowel bag the maximum doses evaluated was same for both algorithms and underestimated as compared to MC calculation. Minimum dose within the volume of bowel bag was exactly matches for MC simulations and both algorithms. The dose estimation for rectum, femoral head bladder and bones were found to be exactly same for AAA and PBC, although they were slightly overestimated w.r.t MC simulations. Although the minimum doses evaluated for bladder and femoral heads shows a significant differences w.r.t dose measured by MC calculation.
Table 1: Different dose parameters obtained from AAA, PBC and EGSnrc’s treatment plan Dose Parameters PBC AAA MC PTV TOTAL Dmean (Gy) 1.85 1.84 1.89 % dose received by 95% of Vol (%) 99.22 100.33 99.44 % Vol receiving more than 107% of dose (%) 100 100 99.76 Dmax (Gy) 1.9 1.9 2.1 Dmin (Gy) 1.5 1.3 0.1 Bladder Dmean (Gy) 1.81 1.81 1.85 % Vol receiving more than 1.07Gy (%) 100 100 100 Dmax (Gy) 1.9 1.9 2.1
Dmin (Gy) 1.7 1.7 0.1 Rectum Dmean (Gy) 1.86 1.85 1.8 Dose received by 50% vol. (Gy) 1.86 1.86 1.8 Dmax (Gy) 1.9 1.9 1.9 Dmin (Gy) 1.9 1.9 1.7 Femoral Heads Dmean (Gy) 1.65 1.65 1.65 Dmax (Gy) 1.9 1.9 1.9 Dmin (Gy) 0.7 0.7 0.1 Bowel Bag Dmean (Gy) 1.9 1.9 1.9 Dmax (Gy) 1.80 1.81 1.9 Dmin (Gy) 0.1 0.1 0.1
4.
CONCLUSIONS
The present study involves the investigation regarding accuracy and validation of commercially available dose calculation algorithms i.e., AAA and PBC. These algorithms were compared with MC simulations and beam characteristics for 6 MeV photon beam was evaluated. Firstly the linac head was modeled using the details provided by the vendor. Later this modeled linac head was validated using the PDD and beam profiles of working linac. The normal structures and the target volume for carcinoma vulva were imported from the library plan of TPS (Eclipse, 11.0) and four field box plan was generated using Eclipse . The simulations for the same setup and Rando phantom were made using MC simulations. The volumetric and point doses for different critical organs for example, rectum, bladder, bowel and femoral head were compared.
From the results (Figure 4. and Table 1.) it can be observed that both AAA and PBC show similar variations with respect to each MC. It can also be observed that radiation doses evaluated both for low (Dmin) and high (Dmax) dose regions show large variations for both algorithms with respect to MC simulations. The radiation doses are overestimation for lower dose regions and under estimation high dose regions. The mean doses (Dmean) calculated from AAA, PBC for all structures were comparable to MC results with minute variations. Among the both algorithms, the variation in dose estimation was found to be lower in AAA w.r.t dose measured by MC simulations. The dose evaluated in non-homogeneous medium in the present study femoral head shows non-significant variations for both algorithms. It is expected to get better results if thoracic region of Rando phantom instead of pelvic phantom because of the presence of air cavity in thoracic region. Since bones are denser than air and have comparable density to the tissue used. So due to the presence of air cavity it is expected that it would be easy to account for the dose calculation accuracy of AAA in comparison to PBC. The surface dose estimation was found to be overestimated by PBC algorithm and underestimated by AAA as compared to MC simulation.
REFERENCES
[1] G. M. Ross, “Induction of cell death by radiotherapy”. Endocr. Relat. Cancer, Vol 6, p. 41-44, 1999.
[2] B. A. Fraass, The development of conformal radiation therapy. Med. Phys, 22 (1995) 1911.
[3] RD Parveen Kumar, KP Santhosh et al., “Estimation of inhomogeneity correction factors for Co- 60 beam using Monte Carlo Simulations” JCRT Vol. 7 pp. 308, 2011 .
[4] D.W.O. Rogers, B. Walters, I. Kawrakow. BEAMnrc User Manual, National Research Council of Canada, Ottawa & Canada, 2017.
[5] D.W.O. Rogers, B. Walters, et al.. DOSXYZnrc User Manual, National Research Council of Canada, Ottawa & Canada, 2017.
[6] T.C.F. Fonseca, J.P.R. Junior. “MCMEG: Simulations of both PDD and TPR for 6 MV LINAC photon beam using different MC codes”. Radiation Physics and Chemistry. Vol 140; p. 386- 391, 2017.
[7] James E. Rodgers. Monte Carlo simulations of dose deposition applied to clinical radiation therapy, Elsevier, Radiation Measurements 41, 20Q.
[8] I. Kawrakow, Mainegra-Hing, et al. The EGSnrc Code System: Monte Carlo Simulation of Electron and Photon Transport, NRCC Report PIRS-701.
[9] http://www.irs.inms.nrc.ca/BEAM/beamhome.html.
[10] Jung-Ha Kim, Robin Hill, and Zdenka Kuncic. An evaluation of calculation parameters in EGSnrc/Beamnrc Monte Carlo codes and their effect on surface dose calculation. Phys.
Med. Boil. 57 (2012) N267.
[11] Ryota Onizuka, Fujio Araki, et al. “Accuracy of dose calculation algorithms for virtual heterogeneous phantoms and intensity-modulated radiation therapy in the head and neck”.
[12] Gagné, I. M. and Zavgorodni. “Evaluation of the analytical anisotropic algorithm in an extreme water–lung interface phantom using Monte Carlo dose calculations.” Journal of
Applied Clinical Medical Physics Vol. 8, p. 33, 2007).
[13] F Hasenbalg, H Neuenschwander, et al. “Collapsed cone and analytical anisotropic algorithm dose calculations compared to VMC++ Monte Carlo simulations in clinical cases.” J. Phys.: Conf. Ser. 74 p. 21007, 2007.