U
NIVERSIDADE DE
L
ISBOA
Faculdade de Ciências
Departamento de Informática
BIOINFORMATIC STUDIES ON STRUCTURAL
ELEMENTS FOR THE REGULATION OF
ALTERNATIVE OXIDASE (AOX) GENE
ACTIVITIES
Moisés Geraldes Xavier
Confidential
Mestrado em Engenharia Informática
2007
U
NIVERSIDADE DE
L
ISBOA
Faculdade de Ciências
Departamento de Informática
BIOINFORMATIC STUDIES ON STRUCTURAL
ELEMENTS FOR THE REGULATION OF
ALTERNATIVE OXIDASE (AOX) GENE
ACTIVITIES
Moisés Geraldes Xavier
Projecto orientado pelo Prof. Dr. Francisco José Moreira Couto e supervisionado pela Prof. Dra. Birgit Arnholdt-Schmitt
Mestrado em Engenharia Informática
Declaração
Moisés Geraldes Xavier, aluno nº 25533 da Faculdade de Ciências da Universidade de Lisboa, declara ceder os seus direitos de cópia sobre o seu Relatório de Projecto em Engenharia Informática, intitulado "Bionformatic studies on structural elements for the regulation of Alternative Oxidase (AOX) gene Activities", realizado no ano lectivo de 2007 à Faculdade de Ciências da Universidade de Lisboa para o efeito de arquivo e consulta nas suas bibliotecas e publicação do mesmo em formato electrónico na Internet.
FCUL, de de 2007
_____________________________________________
Birgit Arnholdt-Schmitt, supervisor do projecto de Moisés Geraldes Xavier, aluno da Faculdade de Ciências da Universidade de Lisboa, declara concordar com a divulgação do Relatório do Projecto em Engenharia Informática, intitulado "Bionformatic studies on structural elements for the regulation of Alternative Oxidase (AOX) gene Activities".
Évora, de de 2007
Abstract
Alternative Oxidase genes encode a small family of isoenzymes (enzymes with some differences but act in the same chemical reaction). AOX is present in plants, fungi, algae, some yeast, and was also found in some classes of the animal kingdom. The enzymes are responsible for an alternative pathway of respiration that is responsive to stress conditions but also to pathogen attack, as well as growth and stage development.
Scaffold Matrix Attachment Regions (S/MARs) are DNA sequences from 300 to 3000 nucleotides that bound with nuclear proteins serving as anchors for DNA, influencing in this way the DNA organization inside the cell. Several studies have failed to reveal a pattern of organization in the sequences, however some rules have been found that help computer based analysis. Experimental identification of these sequences is hard and time consuming, computer methods could provide a first step selection, and cover larger sequences.
In order to highlight possible links between S/MARs and differential regulation of AOX genes, the first part of this project consists in identifying structurally relevant S/MAR regions in the neighborhood of AOX genes in Arabidopsis thaliana and in rice using a selected computer program.
Single Nucleotide Polymorphisms (SNPs) are variations in one nucleotide base among DNA sequences from the same location, from different individuals. These differences could serve as markers to classify a specific set of individuals.
The second part of this project consists in the development of a bioinformatic application that will help in the identification of specific polymorphisms (SNPs) in sequences that are experimentally obtained at the EU Marie Curie Chair in ICAM University of Évora, where this project is performed.
Keywords
Bioinformatic, Scaffold Matrix Attachment Regions, Single Nucleotide Polymorphisms, Alternative Oxidase
Resumo
Os genes da oxidase alternativa (ou AOX) codificam uma pequena família de isoenzimas (enzimas com algumas diferenças mas que actuam nas mesmas reacções químicas), que se encontram nas plantas, fungos, algas, algumas leveduras bem como em algumas classes do reino animal. A AOX é responsável por uma via alternativa de respiração, activada principalmente em condições de stress mas também como reacção a ataques patogénicos, bem como em estádios específicos do desenvolvimento da planta.
As “Scaffold Matrix Attachment Regions” (S/MARs) são sequências de DNA entre 300 e 3000 nucleótidos que se ligam a proteínas do núcleo da célula, servindo como âncoras para o DNA, conferindo-lhe assim uma forma própria no interior da célula. Estudos realizados para determinar uma organização específica destas regiões não produziram muitos resultados, no entanto foram definidas algumas regras que permitem ajudar na detecção computacional destas sequências, uma vez que a detecção experimental é difícil e morosa.
Com vista a estabelecer possíveis relações entre uma regulação diferenciada dos genes da AOX através dos S/MARs, a primeira parte deste projecto consiste em determinar as regiões do DNA com a estrutura de potenciais “S/MARs” na vizinhança dos genes da Oxidase Alternativa na Arabidopsis thaliana e no arroz.
“Single Nucleotide Polymorphisms” (SNPs) são diferenças de um nucleótido entre as mesmas regiões de DNA de diferentes indivíduos da mesma espécie. Estas diferenças podem servir para marcar um determinado conjunto de indivíduos.
A segunda parte deste projecto consiste em desenvolver uma aplicação para ajudar na identificação de tipos específicos de polimorfismos, (SNPs) em sequências identificadas na EU Marie Curie Chair, ICAM, Universidade de Évora, onde este projecto foi desenvolvido.
Resumo Alargado
A aplicação da Informática no campo de estudo de outras ciências, revela-se fundamental na concretização de projectos de dimensões consideráveis, que envolvem a gestão e análise de grandes quantidades de dados. A utilização de técnicas informáticas para extrair informação dos dados obtidos, simplifica consideravelmente a dimensão e consequente resolução dos problemas. No contexto dos problemas de Biologia Molecular, a Bioinformática assume um papel preponderante, fornecendo ferramentas e metodologias extremamente úteis.
A Bioinformática estuda informação biológica recorrendo a conceitos de Biologia, Genética, Informática, Estatística, Bioquímica, entre outras, sendo frequentemente dividida em duas áreas, gestão de informação biológica e biologia computacional. A sua aplicação prática estende-se por áreas tais como análise de sequências de DNA, descoberta e anotação de genes, análise evolutiva entre várias espécies, análise das semelhanças e diferenças entre os genomas das várias espécies, regulação de genes, interacções entre proteínas, análise da estrutura das proteínas, etc.
Este projecto integra-se na Cátedra Marie Curie do Instituto de Ciências Agrárias Mediterrânicas (ICAM) da Universidade de Évora inserindo-se no contexto de um projecto mais amplo; “Stress adaptation in plants – A molecular approach of social-economic
interest”, relacionado com a procura de um marcador molecular que espera fornecer novas
perspectivas para o melhoramento de plantas.
Neste projecto pretende-se estudar as possíveis implicações de certas sequências na regulação dos genes da Oxidase Alternativa (AOX), bem como desenvolver um aplicação que ajude na identificação de diferenças entre os genes da Oxidase Alternativa de modo a esta ser aceite como um marcador funcional para uma reprogramação eficiente das células em condições de stress [5] [6].
A oxidase alternativa (AOX) existe nas plantas, fungos, algas, algumas leveduras, bem como em algumas classes do reino animal, nomeadamente nos mollusca e nematoda [5]. Esta enzima localiza-se na membrana interna da mitocôndria, sendo responsável por uma via alternativa da cadeia respiratória. Esta via quando activa reduz a quantidade de energia biológica (ATP) e a quantidade de espécies reactivas de oxigénio, ao contrário do que se verifica na via da cadeia respiratória. As espécies reactivas de oxigénio quando presentes em grandes quantidades são tóxicas para as células. A AOX está associada à
produção de calor, à resposta a infecções virais bem como na prevenção da morte celular programada [40] [5] [43].
A AOX é codificada por uma família de genes dividida em duas subfamílias de genes, a AOX1 e a AOX2. Alguns genes da subfamília AOX1 são expressos preferencialmente sob condições de stress (p.e. ausência de água, excesso de calor, etc.) enquanto que, a expressão dos genes da subfamília da AOX2 está associada com os estádios específicos de desenvolvimento da planta [27]. Na Aradidopsis thaliana (Thale
cress) foram identificados quatro genes da subfamília AOX1 (AOX1a, AOX1b, AOX1c e AOX1d) e um gene da subfamília AOX2 (AOX2) e no arroz (Oryza sativa) apenas quatro
genes da subfamília AOX1 (AOX1a, AOX1b, AOX1c e AOX1d) [3] [4].
O DNA de um determinado organismo contém toda a sua informação genética, que determina as suas características fenotípicas. É constituído por uma dupla cadeia de nucleótidos enrolados em dupla hélice. Os nucleótidos são as unidades estruturais do DNA, e são caracterizados por quatro “bases” Adenina (A), Guanina (G), Citosina (C) e Timina (T). Esta dupla cadeia é complementar ou seja sempre que existe uma Adenina numa cadeia existe uma Timina na outra e vice-versa, sendo o mesmo verdade para a Guanina e Citosina.
Para o DNA dar origem a uma proteína, primeiro uma molécula de RNA, complementar ao DNA é sintetizada, sendo depois produzida a proteína a partir da molécula de RNA sintetizada.
Neste projecto pretende-se estudar a localização de certas regiões denominadas
Scaffold Matrix Attachment Regions (S/MARS) na vizinhança dos genes da AOX na Arabidopsis thaliana e no arroz, bem como desenvolver um programa para ajuda na
identificação de diferenças, por exemplo Single Nucleotide Polymorphisms (SNPs) nos genes da AOX em diferentes espécies.
As Scaffold Matrix Attachment Regions (S/MARs) são regiões do DNA que têm entre 300 e 3000 pares de bases aproximadamente, ligando-se a proteínas do núcleo da célula, funcionando como pontos de ancoragem para o DNA, conferindo-lhe uma estrutura própria e compartimentalizando o DNA em regiões funcionais.
A identificação destas regiões experimentalmente é feita através de processos de associação e desassociação dos S/MARs com as proteínas do núcleo recorrendo a procedimentos não triviais e morosos. O recurso a uma identificação destas regiões através
de ferramentas informáticas proporciona um primeiro passo no sentido da redução do número de candidatos, bem como a pesquisa em sequências de grandes dimensões.
Estas regiões não possuem uma estrutura padrão característica, o que dificulta a sua identificação. São no entanto conhecidas pela sua elevada quantidade de Adeninas (A) e Timinas (T), bem como duas subsequências específicas com aproximadamente 200 bases pares de distância. Alguns estudos tentaram caracterizar estas sequências usando modelos probabilísticos, no entanto devido ao pequeno número de sequências existentes nas bases de dados genómicas, muito continua ainda por descobrir em relação aos S/MARs.
A primeira parte deste projecto consiste na identificação destas sequências na vizinhança dos genes da AOX na Arabidopsis thaliana e no arroz. Estas duas plantas têm o genoma completamente sequenciado e disponível em bases de dados genómicas. A abordagem adoptada passou em primeiro por seleccionar um programa para a identificação de S/MARs, os vários programas existentes usam diferentes critérios de análise e consequentemente os resultados são diferentes. Seguidamente determinou-se as sequências de DNA para análise na Arabidopsis e no arroz, em primeiro localizaram-se os genes da AOX nas duas espécies, e posteriormente determinou-se o comprimento das sequências para análise em cada uma das espécies. Finalmente as sequências foram analisadas e foi desenvolvido um programa para gerar imagens esquemáticas com os resultados obtidos.
Diferentes bases de dados armazenam e apresentam a informação de diferentes maneiras. Para utilizar esta informação de uma forma estandardizada e útil foi necessário criar algumas pequenas aplicações para converter os dados entre os diferentes formatos. A linguagem de programação usada foi C++, visto possibilitar uma fácil integração com bibliotecas para geração rápida de imagens bem como possuir um variado leque de funções para manipulação de texto e Input/Output, além disso outro aspecto tido em conta foi a portabilidade de código entre Linux e Windows.
No decorrer do projecto foi também considerado importante obter dados sobre a expressão dos genes da AOX na Arabidopsis e no arroz, recorrendo para isso a publicações e a bases de dados acessíveis publicamente, com informações sobre a expressão dos genes (a uma escala genómica), em diversos tecidos da planta, bem como em diversas condições.
Se um gene é transcrito, e posteriormente codificado numa proteína diz-se que o gene é expresso. Com o avanço dos métodos para medição da expressão dos genes,
tornou-se possível efectuar esta medição a uma escala genómica, armazenar os dados numa batornou-se de dados para posterior consulta.
A segunda parte deste projecto consiste no desenvolvimento de uma aplicação para a ajuda na identificação de SNPs, em sequências de DNA obtidas no laboratório da Cátedra EU Marie Curie no ICAM.
Single Nucleotide Polymorphisms são variações numa base de DNA nas mesmas
regiões genómicas entre vários indivíduos. Estas variações podem influenciar ou não a codificação de proteínas, e consequentemente a sua estrutura. Caso estas variações sejam facilmente detectadas a nível do gene, ou a nível do fenótipo (características visíveis dos genes), podem servir como marcadores para caracterizar um determinado conjunto de indivíduos (o conjunto de indivíduos com essa variação). Neste projecto pretende-se criar uma ferramenta que auxilie a detecção de SNPs em sequências de DNA da Oxidase Alternativa obtidas no laboratório da EU Marie Curie Chair.
Existem várias metodologias e ferramentas para a identificação computacional de SNPs. O primeiro passo consiste em alinhar as sequências de DNA em estudo, procurando as regiões comuns entre elas. A partir deste alinhamento existem várias aproximações para encontrar SNPs. A primeira normalmente consiste em perceber se as diferenças são importantes tendo em conta a qualidade das sequências (diferenças em sequências de fraca qualidade não são indicadores de SNPs), outro factor importante é a quantidade de sequências em estudo, (o mesmo padrão de diferenças em muitas sequências é indicador de SNPs), o número de cada um das bases na sequência, bem como a quantidade de diferenças em cada uma delas podem também ser factores de decisão.
A abordagem efectuada passou em primeiro por identificar os programas que permitissem efectuar uma alinhamento de múltiplas sequências, de seguida seleccionar um algoritmo (já implementado) para a pesquisa de SNPs e criar uma ferramenta que permita ajudar na automatização deste processo, onde através de uma interface gráfica o utilizador selecciona as sequências que pretende analisar, bem como os parâmetros de input para cada um dos programas. No fim é gerada uma imagem esquemática comos resultados. Este último ponto encontra-se ainda em desenvolvimento.
Palavras-chave
Bioinformática, Scaffold Matrix Attachment Regions, Single Nucleotide Polymorphisms, Oxidase Alternativa.
Table of Contents
1 Introduction ... 1
1.1 Objectives ... 3
1.2 Planning ... 5
2 Basic Concepts ... 7
2.1 Basic concepts on DNA ... 7
2.2 Gene transcription and gene expression ... 7
2.3 Genome sequencing projects ... 9
2.4 Methods for analyzing gene expression ... 10
2.5 Chromatin Organization... 13
2.6 Scaffold Matrix Attachment Regions (S/MARs) ... 14
2.7 In Silico S/MARs Annotation ... 16
2.8 SNPs ... 17
2.9 In Silico SNPs identification ... 18
2.10 Arabidopsis thaliana (Thale Cress) and Oryza sativa (Rice) ... 20
2.11 AOX ... 21
2.12 AOX Gene Family ... 22
2.13 AOX as functional marker ... 22
3 Project Description ... 25
3.1 Methodology ... 25
3.1.1 Previous work on S/MARs annotations ... 25
3.1.2 Choosing a S/MARS Annotation program ... 26
3.1.3 SMARTest ... 28
3.1.4 AOX gene sequences for Arabidopsis ... 28
3.1.5 AOX gene sequences for rice ... 30
3.1.7 AOX gene Expression in Arabidopsis and rice ... 32
3.1.8 Previous work on SNP identification ... 33
3.1.9 PolyBayes ... 34
3.1.10 Development of an application to simplify the SNP identification process. .... 35
4 Work performed ... 37
4.1 Localization of S/MARs within and in the neighborhood of AOX genes ... 37
4.1.1 Obtaining genomic data for Arabidopsis and rice ... 37
4.1.2 Analysis of gene sequences ... 38
4.1.3 Comparing results with previous works ... 38
4.1.4 Generate an image representation from text files ... 40
4.2 Finding evidence of AOX gene expression in rice ... 42
4.3 Develop an application to identify regions of Single Nucleotide Polymorphisms in AOX genes ... 43
4.3.1 Identification of Application Requirements ... 43
4.3.2 Describing the Application ... 44
4.3.2.1 Sequences ... 44 4.3.3 Frameworks used ... 45 4.3.4 Application description ... 45 5 Conclusions ... 49 6 References ... 53 Index ... Appendix 1(Confidential) ... Appendix 2 (Confidential) ...
Microarray data in Yale Virtual Center for Cellular Expression Profiling of Rice ...
MPSS Gene Expression Summary for AOX Genes (According with Rice MPSS database from University of Delaware) ...
List of Figures
Figure 1 –. ... 11 Figure 2- ... 13 Figure 3 - ... 15 Figure 4 - ... 19 Figure 5 - ... 20 Figure 6 – ... 20 Figure 7 – ... 21 Figure 8 – ... 41 Figure 9 – ... 46 Figure 10 –. ... 471 Introduction
In recent years the availability of genomic data has experienced an exponential growth as the price to obtain DNA sequences has decreased. This leaves room for innovation applying informatics as well as mathematical and statistical methodologies, and approaches to solve biological problems, which in turn generates even more data.
Parallel with this growth is the necessity to develop tools and approaches to acquire, store, organize, archive, analyze, or visualize such data. This field of science is commonly known as Bioinformatics, and it could be divided in two major categories: biological information management and computational biology.
Bioinformatics today comprises as major research topics sequence analysis, genome annotation, analysis of gene expression and regulation, computational evolutionary biology, analysis of protein expression and prediction of protein structure among others. In a modern approach Bioinformatics derives knowledge from computer analysis of biological data, not only limited to genetic code but also from population statistical data and scientific literature.
In the latest years several projects took place to obtain the complete genome of some organisms. Arabidopsis thaliana (Thale cress) and Oryza sativa (Rice) was the first plants to have their genome completely sequenced [1] [2] in 2000 and 2005 respectively, a new set of projects at the genome scale could then take place.
Access to whole genome data provides also information to small scale projects aimed at studying a smaller subset of already known or newly identified genes, since the analysis of this sequences could provide new insights in gene regulation and function across different species.
The Alternative oxidase is an enzyme encoded by a family of genes which is responsible for an alternative pathway of respiration called “non-phosphorylating bypasses”. This enzyme is present in plants, fungi, some yeast, algae, and in animal kingdom, was found so far in phyla (mollusca, nematoda and chordata). Up to date the enzyme has not been identified in humans. This alternative pathway of respiration could be linked to many actions during plants life, which will be depicted in more detail later.
Once the whole genome sequencing projects for Arabidopsis and rice were finished the AOX genes and neighbor regions could be analyzed in these species by bioinformatics tools in search for regions that may have structural and regulatory functions.
One example of these regions is the Scaffold / Matrix Attachment Regions (S/MARs). S/MARs could in a very simple way be defined as DNA regions that are bound to non-histone proteins in the nucleus. When bounded to the nuclear matrix S/MARs serve as anchors, organizing and compartmentalizing the DNA in functional domains.
In order to find possible relations between a differential regulation of AOX genes and the S/MARs regions near these genes, in the first part of this study, a search will be performed, to determine the informatic tool to analyze DNA sequences in the neighborhood of AOX genes, searching for S/MARs. The results obtained will then be summarized in images and / or tables, to better characterize the occurrence that may point to their biological significance.
Another interesting aspect is the differences found in the DNA from different organisms in the same species. The process of understanding these differences involves applying biological computer algorithms to the DNA under study. If computer algorithms present similarities and differences between DNA’s a more extensive analysis could be initiated trying to understand their importance and further use.
Single Nucleotide Polymorphisms (SNPs) are variations in one nucleotide between DNA from different organisms of the same specie. SNPs could serve to easily mark differences between different sets of organisms. Integration of all these data is expected to help in the context of a larger project (Stress adaptation in plants – A molecular approach of social-economic interest) at the EU-Marie Curie Chair at the University of Évora, related to understanding the role of AOX genes as functional marker for efficient cell reprogramming and intended to contribute directly to molecular breeding on efficient plant production [5], [6].
The second part of this project aims at creating a program to identify SNPs in DNA sequences (mainly from carrot and olive but possibly from other species) analyzed in the laboratory of the EU-Marie Curie Chair.
This report is organized in six chapters. Chapter 2 introduces basic concepts necessary for understanding the developed work. Chapter 3 describes the objectives of this work, the adopted methodology for each phase of the work, and the adjustments made to
the original planning. Chapter 4 describes the work performed in each phase according with the adopted methodology. Chapter 5 contains a summary about what was done in this project, as well as possible points of improvement. Chapter 6 lists the references used in this work. Appendix 1 contains the results regarding S/MARs identification for
Arabidopsis thaliana and Oryza sativa in the neighborhood of AOX genes and Appendix 2
lists gene expression for AOX genes in Oryza sativa found in publicly available databases.
1.1 Objectives
The project is divided in two major parts, first, the identification of S/MARs in the neighborhood of AOX genes in Arabidopsis thaliana and rice, and seconds the development of an application to identify SNPs in AOX gene sequences of different species. This first part of the project will introduce several concepts of Molecular Biology and Bioinformatics. Understanding the biology concepts behind each phase is very important since it will facilitate the development of a correct methodology to solve it.
There are several objectives for this phase namely: • Understand the concept of S/MARs.
What they are, their importance in DNA organization, their structure, influence on gene expression, etc. This will introduce at the same time concepts of Molecular Biology that by themselves need to be understood. More advanced topics will be introduced as the work progresses.
• Identify the previous work in computational S/MAR discovery.
Previous work on, computational S/MAR discovery will show the way how to progress, and will reveal the limitations and possibilities of this approach
• S/MARs analysis
Locating the AOX genes in Arabidopsis and rice, and determine the sequences to be analyzed will introduce the contact with genomic databases, and with literature in order to confirm the correctness of AOX genes location and to have a deeper understanding of AOX gene structure.
• Integration of results
Results must be verified, and presented in an intuitive way in order to facilitate their analysis and presentation.
• Find evidence of AOX gene expression in Arabidopsis an rice
Locate databases and literature with evidence of gene expression for AOX genes in Arabidopsis and rice. This information will be correlated with S/MARs identification results in order to discover possible insights of S/MARs in AOX gene regulation.
The second part of the project will focus on the development of an application to help in SNPs identification for sequences of AOX genes in different species.
• Understand the concept of SNPs
Like S/MARs understanding the concept of SNPs will introduce a new set of topics from Genetics that need to be assimilated, in order to understand better what is intended to do in the next phases.
• Identify previous work on computational SNP discovery
Perform a survey regarding existent SNP scoring algorithms, as well as literature regarding the use of these algorithms.
• Select a SNP scoring algorithm
Select the scoring algorithm to use in this work. This decision must be supported with previous work.
• Implement an application customized according the necessities of the
workgroup
After the selection of the algorithm and analysis of previews approaches on SNP computational discovery, the application should be implemented, in order to facilitate the customization and integration of the scoring algorithm to the specific needs in EU Marie Curie Chair, the application should also facilitate the presentation of the results.
• Test the application and use it to find AOX regulatory sequences in
Arabidopsis and rice
The application need to be tested, among the workgroup, to ensure accurate results, and usability, users should interact easily with the application.
1.2 Planning
In the beginning of this project, a planning comprising all phases of this project has been elaborated. Objective analysis at the end of each phase and adjustments to the initial planning were adopted and proved useful to establish and tune the methodology. However, this initial planning needed to be adjusted for several reasons justified below.
The first delay is related with the beginning of the project, due to external reasons concerned with the later than expected termination of the graduation. Thus, the project could be started in agreement with the supervisor at the EU Marie Curie Chair only at the beginning of October.
A second unforeseeable bias for the project happened through the fact that the external supervisor of the project, Dr. Stephen Rudd, changed at the start of the project to a position in the industry and could not stick to the agreements. This problem was solved by a rapidly established risk management plan in discussion between the project leader, Birgit Arnholdt-Schmitt and Stephen Rudd. Since then, Dr. Klaus Mayer1, who was responsibly, involved in the former research activities of Stephen Rudd, agreed to overtake the role as an external advisor for the newly emerging bioinformatics group at the Marie Curie Chair by email contacts instead of Stephen Rudd. During my project, Dr. Klaus Mayer was invited to visit the Chair and to give a talk about his activities and experiences. During that visit, I had about three days of time to discuss my project personally with him. The German scientist is now an official collaborator of the EU Marie Curie Chair.
A third bias concerns discrepancies found when comparing S/MARs identification results, with results already available from other publications [9]. The reason of these discrepancies was caused by differences in the data management for the Arabidopsis genome in different data banks (the 4th release of the Arabidopsis genome available in TIGR, and the 2nd version of the Arabidopsis genome used in [9] See also the discussion at page 37 in the present report). This problem was not promptly identified. After identification, Dr. Klaus Mayer made internal data (concerning new S/MAR annotation based on the most recent data) available that helped to solve the problem rapidly.
In the proposal, it is foreseen that the project will contribute to conference presentations and/or a publication. Also, it was foreseen that expression profile data would be used to enable a link between the data of S/MARs occurrence near AOX genes and the activity of these genes. Because of the above mentioned biases, analyses of the expression data, which are most important for any presentation or publication of the project’s tasks, has been included before starting with the third and forth task related to SNP analyses. Since analyses of the expression data will be central for the scientific success of the project, I decided to ask for a prolongation for delivering this report after Dr. Francisco Couto (my supervisor at the Department of Informatics) have said it was possible, depending on the justification. Thus, the work related to SNPs started only after the 31th of May. Though successfully treated, the task is more challenging than expected and will still go on even after I will have submitted the project report. Generation of schematic images from SNP analysis text files is in progress, the test phase needs still to be done. Only after these two phases, the programme for SNP analysis in AOX genes currently identified at the Chair can be started to run. Work of the project related to S/MARS and expression data will now be submitted for presentation to a highly competitive conference that takes place in October in the United Kingdom.
2 Basic Concepts
This chapter introduces a set of concepts from molecular biology necessary to understand the problems that will be addressed by informatics tools or approaches in this project. Concepts are presented in a simple way, but as more accurate as possible.
2.1 Basic concepts on DNA
DNA (Deoxyribonucleic acid) contains all the genetic information for the development and functioning of living organisms. In eukaryotes such as animals and plants, DNA is stored inside the cell nucleus (genomic DNA), packed in structures called chromosomes. In prokaryotes, such as bacteria, DNA is in the cell's cytoplasm. DNA could also be found in other cellular organelles such as mitochondria and plastids.
The three-dimensional structure of DNA consists of two long helical strands that are coiled around a common axis forming a double helix. Nucleotides are the structural units of DNA; they are characterized by four bases Adenine (A), Guanine (G), Cytosine (C) and Thymine (T). These nucleotides are complementary, wherever there is an A in one strand there is a T in the other, the same is true for the G and C bases. In RNA the T base is replaced by the U (Uracil) [7].
The genome of an organism comprises its entire DNA (the genotype). In order to synthesize a protein the DNA is first transcribed to RNA (Ribonucleic acid) who migrates to the cytoplasm, the RNA is then translated to a protein in the ribosome (a complex molecular machine composed of both RNA and protein).
Once the DNA is sequenced, the sequence corresponding to one strand of DNA is obtained, this information could be stored as a long string of A's, G's, C's and T's, and in this way be available for further computer analysis. It is only required to know the sequence for one of the strands, since the other strand is complementary (an A in one strand matches a T in the other, the same is true for G and C).
2.2 Gene transcription and gene expression
The discrete functional unit of the DNA that contains the information responsible for the creation of a protein is called gene. For a gene to be transcribed a set of proteins called transcription-factors assemble at a specific DNA site, called promoter that is usually
located (but not necessarily) before the gene. Only one strand of DNA is used for transcription therefore it is called the template strand. An enzyme called RNA polymerase, binds to the transcription-factors thereby initiating transcription.
RNA polymerase melts two strand DNA bonds, separating the two strands in the near region, the direction in which a template DNA strand is transcribed is named downstream. RNA polymerase advances downstream, a complimentary copy of the DNA template strand is produced at the rate of about 1000 nucleotides per minute. We say it is a complementary strand in the sense that Guanine nucleotide bases (G) are replaced for Cytosine (C) ribonucleotide bases and vice-versa, Adenine bases (A) are replaced with Uracil (U). Specific sequences in the template DNA signal the RNA polymerase to terminate transcription. The synthesized RNA molecule is released, and RNA polymerase dissociates from DNA.
In eukaryotic cells, the RNA molecule formed must undergo several transformations before being translated to a protein. There are two types of regions, the coding regions called exons, and non-coding regions called introns. After transcription, introns are removed, thus only the exon regions codify a protein. The RNA with the introns and exons is called a precursor RNA (pre-mRNA), while the RNA only with the exons is called messenger RNA (mRNA).The mRNA traverses the nuclear membrane and is translated to a protein in the ribosomes.
A set of three nucleotides is called a codon. For each codon there is a matching amino acid. Translation begins with the start codon (AUG or Methionine) and ends with any of the stop codons (UAA, UAG and UGA). The RNA regions before the start codons and after the stop codons are called untranslated regions or UTRs. The region before start codon is called 5’ UTR and the region after the stop codon is called 3’ UTR. In this way the direction of transcription is downstream or from 5’ to 3’.
Before introns are removed, a sequence of several Adenine bases is added to the 3' UTR of the pre-mRNA molecule. This sequence is commonly known as the polyA tail and this process is called polyadenylation.
A gene may code for more than one protein, as a result of different mRNA sequences, for a variety of reasons, such as the existence of more than one promoter for each gene, different selection of sites for the polyadenylation or partial transcription of
some introns. This process is known as alternative splicing it may be responsible (among other processes) for the production of different forms of a protein, also called isoforms.
Protein synthesis takes place in the cytoplasm in a complex of RNA and protein called ribosome. As said before a set of 3 mRNA nucleotides is called a codon. For each codon there is a corresponding amino acid, however for each amino acid there is more than one corresponding codon. All amino acids bind to a key element called tRNA (Transfer RNA) which will play a very important role in protein synthesis. Each tRNA has about 73 to 93 nucleotides, and contains a three-nucleotide sequence called anticodon, that matches complementary codon in the mRNA.
Not all genes are transcribed at the same time. For example some genes are expressed in some organs and not in others and vice-versa. If the gene is transcribed to RNA and later translated to a protein it is said that the gene is “expressed” or “not expressed” otherwise.
Gene expression is controlled at transcription by signaling substances that bound to specific receptors in the cell and trigger an intercellular pathway in order to produce a specific protein. However, there are many other chemical and biochemical factors that could influence the process of transcription. The rate of the transcription could also be influenced by means of certain regulatory sequences called enhancers and silencers. Enhancers could be located near or several thousand base pairs away in both upstream and downstream directions, influencing transcription rate. Since they are located at the same strand, they are called cis-acting elements. Other regulatory elements or factors are called trans-acting elements.
A regulatory protein (usually called activator) bind to the enhancer sequence and interacts directly with the transcription complex (RNA polymerase + transcription factors + other set of proteins called coactivators) assembled at the promoter(s) site influencing in this way the transcription rate [7]. Like enhancers there are other sequences called silencers located near or overlapping enhancers, where other type of proteins called repressors bind, inhibiting the binding of activator sequences to enhancers.
2.3 Genome sequencing projects
The technology for sequencing DNA has improved largely since mid seventies when the first methods for DNA sequencing were published by Gilbert W, Maxam A, and Sanger F. Today’s methods rely mostly (in a simple description) on fluorescent marking of
nucleotides, and later optical recognition due to different wavelengths associated at each nucleotide.
This evolution has led to a decrease in sequencing prices and allows more ambitious projects to take place, like the human genome project, which has sequenced the whole human genome sequence. Since today’s methods can sequence only sequences with 300 to 1000 nucleotides long, sequencing the whole genome of an organism is not a simple task.
The long DNA strands must first be divided into smaller redundant random fragments. Once these smaller fragments are sequenced the longer DNA strands can be assembled by computational means using the overlapped segments of smaller sequences. This is a complex methodology because of the large amounts of information involved and the sequence errors associated with the high repetitive regions of DNA (since a large part of DNA is repetitive, very similar sequences could come from different parts of the larger sequence).
Once DNA has been sequenced, annotation of genes takes place. Possible gene sequences are first predicted using computer programs, a set of rules regarding DNA organization, gene and RNA sequences already available in databases, and through analysis of gene transcription. A locus is assigned to each gene. A locus is an identifier unique for each gene and each organism.
Matching the identified genes to proteins is the next step. This is first performed automatically (by informatics means), translating gene sequence to protein sequence and look for similarities with other characterized proteins. If a match is found a description corresponding to that protein is added to the gene (by using a gene ontology database), otherwise the gene is characterized using general terms, such as: expressed if a RNA transcript matching the gene is found in a database, hypothetical if no RNA transcript is found, putative or probable if the protein exhibit limited sequence similarity, etc.
2.4 Methods for analyzing gene expression
In the latest years the analysis of gene expression has improved very rapidly, is possible today to analyze the expression of several thousand genes simultaneously, searching for genes that are expressed together (co-expressed genes), monitoring gene expression while the cell undergoes some biological process, or search for genes that are expressed differentially in different cell tissues.
Most of these techniques even if refined or reinvented over time rely on the principle of specific probe target hybridization. The attraction of two complementary strands of DNA is so strong that even if separated zip back together at right temperature and salt conditions. This concept commonly known as hybridization is very useful for detecting one strand using the other. A probe is synthesized in order to “hybridize” with the complementary DNA or RNA strand.
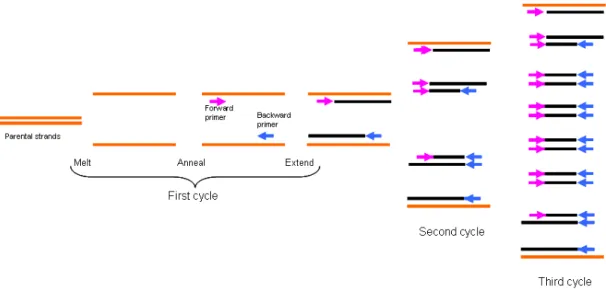
The conventional essays for analyzing gene expression are Northern Blotting, and quantitative real-time PCR. Quantitative real-time PCR relies on the detection of a fluorescent signal produced proportionally during the amplification of a PCR product. A PCR or Polymerase Chain Reaction is designed to amplify a specific region of DNA, a mixture of DNA, nucleotide bases, an enzyme to synthesize DNA (Taq polymerase) and probes called primers are heated in order to separate DNA strands and cooled for the probes (primers) to bind at complementary sites. Taq polymerase extends the DNA strands in upstream (3'->5') direction [7]. This process is repeated several times or several cycles. A reaction that cycles 20 times will amplify the specific target sequence 1 million times. In Quantitative Real Time PCR the primers could be fluorescently-labeled, and the signal obtained is proportional to the amount of PCR product.
Figure 1 – In this picture are represented the first three cycles of a PCR (Polymerase Chain Reaction).
Sequences are heated to be separated, primers anneal to the DNA strands and Taq polymerase enzyme begins to extend the sequences in the direction of the primers. When this procedure is repeated other primers will anneal to the original and extended sequences, (thus the name chain reaction). The number of sequences corresponding to the location amplified at the end of each cycle will be 2n where n is the number of the cycle.
Newer methods for analyzing gene expression include SAGE (Serial Analysis of Gene Expression), DNA Microarrays and MPSS (Massively Parallel Signature Sequencing).
DNA Microarrays allows measuring the expression of thousand of genes in a single experiment. There are several companies that supply this technology, as well as academic laboratories, with several different methodologies, and different applications, but the basic principles remain true for all of them. Thousands of probe sequences ranging from 25 to 70 or more base pairs called oligonucleotides (chemically synthesized and bounded nucleotides) corresponding to a part of a particular gene or sequence of interest are attached to a surface (such as glass, plastic or silicon) in properly identified spots. Usually to evaluate gene expression, cDNA is used to from two samples that we want to compare. cDNA is the reverse transcription of mRNA, this is, the complement to any mRNA sequence with the U's replaced with T's. Thus cDNA does not have intron sequences.
The cDNAs of the two condition samples are fluorescently marked with different colors (usually Red and Green), then they are mixed and hybridized with the microarray. The spots will then have a specific intensity, corresponding to the cDNA that have hybridized the probes. The ratio of the intensities is measured for each spot. If a condition would stimulate the expression of one gene the spot would show a higher intensity of the color matching that condition. The absence of color in a spot would indicate that the gene is unexpressed in both conditions, and intermediate color intensity would mean that the gene is expressed in both conditions.
Another recent method to measure gene expression is MPSS (Massively Parallel Signature Sequencing), although not so widespread as the DNA Microarrays this is a very powerful technique to measure expression of low expressed genes. In a very simplistic description, MPSS rely on the creation of thousands of small random sequences (17 or 20 base pairs long) called signatures, the next step is matching these signatures to mRNA molecules or transcripts (results of gene transcription). Millions of signatures are created in order to have many copies of each signature. Each set of different signatures are tagged and attached to a 5 micron microbead, signatures are then hybridized with cDNA, (subjected a specific condition of study) and is possible to determine for each microbead how many signature have cDNA attached , with the final goal of quantifying the number of hybridizations for each different set of signatures. These methods and others are depicted in more detail in [18].
With the whole genome sequencing projects releasing a high amount of data in publicly available databases, a new set of projects devoted to understand gene expression in whole genome have begun. Data from microarray and mpss experiments performed under a diverse set of conditions is annotated in relational databases that are publicly available through web interfaces. More complete sets of data are available usually under a subscription fee.
2.5 Chromatin Organization
The DNA of a human cell measures about 2 meters in total length and must be contained in cells with diameters of less than 10μm [7]. It comes then at no surprise that a complex degree of compaction is required.
In eukaryotic cells, DNA is associated with histone proteins, in a highly condensed nucleoprotein called chromatin. DNA is tightly packaged into octamers known as nucleosomes, which consists of four histone proteins (H3, H4, H2A and H2B), around which is wrapped 147 bp (base pairs) of DNA. Individual nucleosomes are connected through 155 to 210 base pairs of DNA. This is the first level of chromatin compaction.
Each nucleosome is associated with one H1 histone protein, and is packed in an irregular spiral arrangement with approximately six nucleosomes per turn, folding into a 30nm chromatin fiber, this is called the second level of chromatin compaction.
Figure 2- The figure above represents the
various levels of chromatin organization, from the DNA level to the chromosome level [7]
The nucleus of the cell is not simply an unorganized container for chromatin, rather, there is a highly organized nuclear substructure comprising a fibrillar network of multiple proteins called the nuclear matrix.
This substructure retains the general shape of the cell nucleus after the removal of major part of DNA and DNA-associated proteins.
30 nm chromatin fiber attaches the nuclear matrix at specific sites called Matrix Attachment Regions or Scaffold Associated Regions (S/MARs), this is called the third level of chromatin compaction.
Besides these three levels of chromatin compaction presented there are more two levels, that are not yet completely understood, as the 30 nm chromatin fiber coils numerous times upon itself, forming fibers of 300nm, 700nm, and 1400nm.
As described before chromatin can assume a coiled from, mostly during the cell division phase called mitosis. When cells exit mitosis the condensed chromosomes uncoil, however, some chromatin regions remain coiled, these regions comprise heterochromatin. The less condensed portions of chromatin are called euchromatin. Despite some exceptions only genes in euchromatin are transcribed, since the high compaction of heterochromatin block the binding of transcription factors.
The organization of DNA in euchromatic and heterochromatic regions can be flexible depending on development, growth and interaction to the environment [6].
2.6 Scaffold Matrix Attachment Regions (S/MARs)
Scaffold Matrix Attachment Regions are 300 to 3000 nucleotides or base pairs long proposed to play an important role in nuclear and chromosome organization. Whenever associated with the nuclear scaffold the S/MARs divide the eukaryotic genomes in individual 30nm chromatin loops, being this way related with the functional compartmentalization of the genome. S/MARs were shown to control gene expression by facilitating interactions between DNA activating complexes and genes, by controlling chromatin accessibility and because of their location near the transcription units and regulatory elements [8].
Rather than only a structural function S/MARs are supposed to play also a regulatory role. S/MARS may additionally be defined as regulatory elements typically found outside the transcribed regions and within introns. They typically augment transcription rates in a
highly context-dependent manner. S/MARs containing genes have been shown to reach overall significantly lower expression levels compared with genes not associated with S/MARs [9].
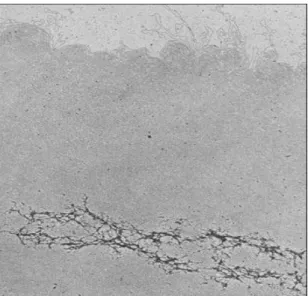
Figure 3 - After removing histone proteins, the
scaffold proteins are well visible at electronic microscope, as the darker set of lines, attached to this darker lines are the DNA loops (without histones), the points of attachment between the DNA loops and scaffold proteins are the S/MARs. S/MARs have in this way a very important structural function serving as anchors for chromatin loops [7].
Transcription regulation of gene expression is known to involve formation of dynamic chromatin loops mediated by S/MAR attachment to the nuclear matrix. The attachment of a DNA sequence to the matrix will place the neighboring genes in proximity of the transcription factors. The abundance of S/MARs in the upstream regulatory regions of genes demonstrates their role in transcriptional regulation [10]. So far, this has not been demonstrated in plants, but there are several studies that suggest a correlation between the presence of S/MARs and gene expression [9].
It has been found that actively transcribed genes are associated with the nuclear matrix and preferably in the periphery of the chromosome. Inactive or unexpressed genes are found in tightly folded dense chromatin regions whereas active or expressed genes are found in more unfolded regions characterized by loop bodies [8].
In transgenic plants it has been shown that when a sequence containing a gene flanked by S/MARs is inserted in the plant genome, that gene is expressed. Furthermore genes inserted in plant genome without flanking S/MARs suffer an effect called gene silencing in which the gene is “turned off” by many factors, such as removing this gene from plant genome (“gene elimination”), the position effect (since in transgenic plants a gene may be inserted in different parts of the genome, different genes may suffer from different regulation patterns influenced by neighbor sequences). S/MARs have shown to minimize the gene silencing effects by acting as insulators (the gene would be integrated in an independent loop flanked by S/MARs elements)[12].
The size of S/MARs anchored loops has also been implicated in relative expression efficacy, negative correlation between S/MARs overlapping with genes, or intragenic S/MARs and gene expression was found in [9], and, further, in [13] it is shown that
intragenic S/MARs also have a pronounced specificity for tissues organs and developmental phases.
2.7 In Silico S/MARs Annotation
Experimental detection of S/MARs requires substantial effort and is not suitable for large-scale screening of genomic sequences, thus, in silico prediction of S/MARs can provide a crucial first step. Experimentally obtained S/MARs provided the work bases for studies in order to determine guideline definitions for S/MARs, who could provide an automated way of annotation.
The most comprehensive data collection of S/MARs publicly available is in S/MARt DB1, a database dedicated to collect information about S/MARs. The database has up to now information about 559 S/MAR sequences.
An evaluation of the sequences in S/MARt DB was carried in [14] as well as a comparison with other sequences (promoters, exons, transcription factors, and other regulatory sequences) in order to study the nucleotide composition and possible consensus sequences. A consensus sequence is a way of defining a set of sequences where in some positions the nucleotides could change, for example, the sequences ATGG and AAGC could be represented by the consensus sequence AWGS where W stands for a T or A and S stands for a G or C.
The study revealed that S/MARs have a rich content of Adenine and Thymine bases (in some cases higher than 70%), failing to reveal a detectable organization among the nucleotides that could be described by a consensus sequence. Other studies however [15] reveal that most of S/MARs appear to have two separate sequences AATAAYAA and AWWRTAANNWWGNNNC within 200 base pairs, and define a set of statistical rules to help improve S/MARs finding, however care is suggested in the application of these rules as different results may arise from different combination of rules.
There are several informatics programs to identify S/MARs in DNA sequences, such as MAR-Finder (or MAR-Wiz)2, marscan (part of the EMBOSS bioinformatic package)3,
1 http://smartdb.bioinf.med.uni-goettingen.de/ 2 http://futuresoft.org/MAR-Wiz/
ChrClass1, and SMARTest (as part of the Genomatix GEMS Launcher package)2. Different programs rely on different methods to identify S/MARS and produce different types of results [16].
Specificity is the statistical measure of how well, a binary classification test, correctly identifies a condition when it is truly not present. In contrast sensitivity is the statistical measure of how well a binary classification test correctly identifies a condition when it is truly present. Different programs show different tradeoff's regarding sensitivity and specificity.
The low number of S/MARs sequences present in SMARt DB when compared with other genomic sequences, is the major drawback for improvements in both specificity and sensitivity of computer programs to predict S/MARs.
2.8 SNPs
SNPs (Single Nucleotide Polymorphisms) are variations in one nucleotide base among DNA sequences from the same location, from different individuals. These differences may induce changes in the synthesized protein. A different nucleotide in a coding sequence may give rise to a different amino acid, in this case is called a nonsynonymous SNP. However the possible combinations for different codons are 43 = 64 and the number of different amino acids is 20, meaning that are amino acids coded by more than one codon. A SNP that does not change the code from an amino acid is called a synonymous SNP.
However, even some synonymous SNPs may influence a translation to protein as the SNP may occur at an intron/exon splice site, altering in this way the intron and exon structure and consequently the ORF may code for a different protein[19]. An ORF (Open Reading Frame) is usually defined as a stretch of DNA containing at least 100 codons that begins with a start codon and ends with a stop codon. However there are very short genes where this ORF definition is not valid (the number of codons is lower than 100) [7]. Other SNPs may be located in the promoter areas influencing in this way the regulation and expression of the corresponding gene [19].
1 http://www.filesearching.com/cgi-bin/s?t=n&l=en&q=ftp.bionet.nsc.ru/pub/biology/chrclass 2 http://www.genomatix.de
These changes in the protein structure may or may not be manifested in the phenotype. The phenotype is the visible outcome of a gene's action, such as blue eyes versus brown eyes.
An important feature of SNPs is serving as genetic markers for mapping specific genetic trait characteristics. A genetic marker is a DNA sequence or part of it, easily detectable by an experimental essay (for example if a SNP is linked to a change in the phenotype the detection could be directly observable). A genetic marker marks a specific point in the DNA, therefore it could serve to compare genotypes, explore evolutionary differences in single species, or among several species.
SNPs are therefore important in complex disease mapping, as well as plant breeding. Plant breeding aims at creating specific genotypes or phenotypes, using a wide variety of techniques. When studying human diseases it is important to know if a certain disease regarding a SNP is spread among the population, so the frequency of SNP occurrence is important to define a link between SNP and the disease. In plant breeding it is possible to propagate a specific polymorphism, thus the most important part is the SNP discovery and/or association with a specific phenotype or genotype.
2.9 In Silico SNPs identification
Computational SNP discovery, have evolved in the last years. First approaches relayed on visual comparison of several aligned sequences from multiples individuals. A sequence alignment is a way of arranging the DNA or RNA or protein sequences to identify conserved regions, as well as differences in the sequences.
Algorithms to produce the multiple sequence alignments are computational intensive, as the number and length of sequences increases. There are several types of algorithms, programs and frameworks to perform this task. There are several computational methods to perform multiple sequence alignments, some rely on Dynamic Programming and are efficient to perform an optimal alignment, however, are computationally expensive.
Progressive alignment algorithms start with the alignment of the two most related sequences and align each next sequence to those who are already aligned, this is a heuristic algorithm, thus, it does not guarantee an optimal alignment, and the final result is also
dependent from the choice of the two primary sequences. ClustalW is based on progressive alignment algorithms and is one of the most used multiple sequences alignment algorithms. Iterative alignment algorithms make an initial alignment of groups of sequences, and align the remaining sequences like in the progressive alignments, however the initial sequences are repeatedly realigned. Other than the types referred above algorithms to produce multiple sequence alignments could rely on Hidden Markov Models, genetics algorithms, among other techniques.
Figure 4 - This image represents a partial protein alignment for AOX genes from different species, the image
is adapted from [20] when rice AOX1c was identified. Conserved regions are marked black while different regions are marked white.
As previously have been said first SNP identification approaches relied on visual comparison of the aligned sequences, although manual comparison is feasible for a small number of sequences, standard accuracy criteria are hard to establish.
As the number of publicly available EST (Expression Sequence Tags) begun to increase, tools to mine SNPs at a genome scale start to be applied. An EST (Expression Sequence Tag) is a short transcribed sequence of mRNA or cDNA typically ranging from 500 to 800 base pairs. The EST corresponding to a set of previously known regions (as a set of genes) were assembled in a larger sequence called contig. Assemblage and posterior
filtering of SNPs relayed mostly on parameters regarding sequence quality through quality scores [21]. Quality scores are measures assigned to each base present in a sequence, in order to determine if that base has been correctly sequenced to help distinguish between SNPs and sequencing errors is essential [19].
Quality scores are assigned based on wavelengths intensities for each nucleotide after having been sequenced. Sequence errors result from the impossibility to distinguish between the wavelengths corresponding to each type of bases A, T, G and C.
Figure 5 - The image represents a plotted graph with the signal intensities (wavelenghts) from part of a
sequence isolated at the EU-Marie Curie Chair. There are several programs capable or reading signal intensities from a file generated when sequencing is performed and piloting the graph. The first bases of the sequence would have a lower quality score, since it is difficult to distinguish between signal intensities while in the middle of the sequence the scores would be higher.
In order to assign a measure of confidence to SNP without regard the source and overall sequence accuracy, a new set of statistical and mathematical models were developed. PolyBayes [22] was designed according these models in order to calculate a Bayesian probability. That mismatches between sequences are true polymorphisms rather than sequencing errors.
2.10 Arabidopsis thaliana (Thale Cress) and Oryza sativa (Rice)
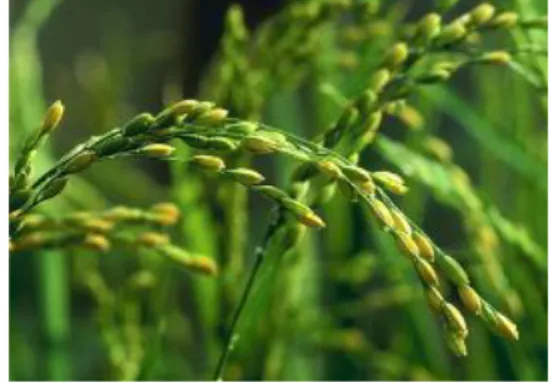
Arabidopsis is a model plant appreciated by the scientific community, for several reasons, such as having a small genome (~120Mb), a small size and a rapid life cycle (it takes about six weeks from germination to mature seed). Arabidopsis was the first plant to have his whole genome sequenced (in 2000) the resources available today concerning these plants are far extensive and well organized. Arabidopsis thaliana has five chromosomes, and belongs to the biological group of dicotyledons.
Oryza sativa is a cereal very important in human diets, being the world’s most used
crop. This cereal has the smallest genome of all the cereals (~430 Mb). The Oryza sativa is a good model for characterizing the genes of other cereals, and associating them with various agronomic traits, cereals number of homologous genes whose order are relatively conserved and numerous resources for a genomic approach, such
as excellent genetic maps and efficient techniques for genetic transformation. Furthermore, rice can also be used as a model genome for one of the two main groups of flowering plants, the monocotyledons, in the same way as Arabidopsis thaliana is the model for the other group, the dicotyledons. Oryza sativa has twelve chromosomes.
Figure 7 – Oryza sativa (Rice)
2.11 AOX
Plants, some fungi, algae, eubacteria, protists and more recently in animal kingdom phyla (Mollusca, Nematoda and Chordata) contain an isoenzyme Alternative Oxidase [5] [40]. An isoenzyme usually refers to several proteins that may have rather different structures, but the same biological functions.
The alternative oxidase (AOX) is present in the inner membrane of mitochondria. Mitochondria are organelles of eukaryotic cells, witch are also described as “cellular power”, because they generate most of the cell’s energy. In the inner membrane of the mitochondria electrons (obtained from photosynthesis and glucose catabolism), pass though several complexes (complex I, II, III, IV and V). In complex IV oxygen is incompletely reduced to water generating reactive oxygen species (ROS). ROS in a higher concentration can cause great damage to cells, including dead.
In complex I, III and IV the proton move from membrane matrix into intermembrane space. This creates a potential energy, referred to as proton-motive force. In complex V, proton-motive force is dissipated by the generation of ATP (biological energy) [41]. This is known as mitochondrial electron transport chain (ECT), cytochrome pathway or oxidative phosphorylation. This pathway is very important for eukaryotic cells because it produces energy (ATP) needed for their metabolism.
An alternative pathway is located between complex II and complex III where the alternative oxidase enzyme is present. The alternative oxidase acts like complex IV reducing oxygen to water, however without generating Reactive Oxygen Species, because oxygen is completely reduced.
The activity of the Alternative Oxidase is regulated by stress conditions, the concentration of Reactive Oxygen Species in cells, pathogen attack, stage development and others [42]. Alternative oxidase can act to decrease formation of ROS [43], is involved in the response to virus infection, heat production, and may prevent programmed cell death. [40] [5] [43].
2.12 AOX Gene Family
Alternative Oxidase is an enzyme encoded by a small family of genes subdivided in two subfamilies, AOX1 and AOX2. In Arabidopsis for instance there are 5 genes (AOX1a,
AOX1b, AOX1c and AOX1d) and AOX2, which have been first reported in [3]. In rice there
are 4 genes all belonging to the AOX1 family (AOX1a, AOX1b, AOX1c and AOX1d).
AOX1a and AOX1b were first reported in [4], while AOX1c has first been reported in [20].
Once the genomes of Arabidopsis and rice were completely sequenced, AOX1d was identified in both Arabidopsis and rice.
In Soybean have been identified 3 genes, one belonging to AOX1 family and AOX2 to
AOX2 (AOX2a and AOX2b) [25]. AOX genes are distributed unevenly across different
species.
2.13 AOX as functional marker
A “functional marker” can be defined as genetic marker, deriving from sequences well known (sequence motifs), from which the function is well characterized. Functional markers are derived from polymorphic sites within genes, and are usually related to phenotype variation.
Genetic markers resulting from functionally defined sequences apply to plant breeding and biodiversity studies, as well as to human genetics. Markers are used in basic plant research and plant breeding to characterize plant germination, assist in gene isolation, etc.
Alternative Oxidase is proposed to be a functional marker for adaptation of plant growth under stress [5]. This idea was been sustained from studies on the metabolic role of alternative oxidase concerning respiration under stress condition, as well as the relation between AOX activity and differential growth. For AOX to be accepted as a functional marker, it is required to discover polymorphic sequences such as SNPs that can be used to genotype and phenotypic characterizations [11].
3 Project Description
3.1 Methodology
3.1.1 Previous work on S/MARs annotations
The first S/MARs annotations were essentially performed by experiments regarding the binding of DNA fragments with nuclear matrices that were experimentally prepared. In [23] is performed a classification of S/MARS isolated from tobacco according to their binding strength, strong, medium and week binders. The most common experimental procedure used to isolate the S/MARs is also described [23].
As referred before under Basic Concepts there were several studies both by laboratory essays and by study of previously identified sequences, aiming to understand the S/MARs functioning at single gene level and at chromatin level. However, the role of S/MARs in maintaining and regulating the cell genetic machinery despite important, remained poorly understood. A summary of S/MARs structure and function could be found in [24].
All S/MAR sequences present in SMARt DB were evaluated by searching for recognizable patterns or “motifs”. Sequences from different species were not distinguished, since they have not significant differences, and S/MARs sequences from one specie bind to nuclear matrices of other specie [14].
To compensate the low number of sequences present on the database (245 at that time), a Roulette Wheel selection algorithm was used to generate four additional sets of data. A Roulette Wheel selection algorithm is a process of make a selection (in this case any of the four bases A, T, C, G) using a fitness function who quantifies the optimality of a solution, (in this case the fitness function was the frequency of occurrence of a given base in the S/MARt DB sequences), the probability of selection is proportional to its fitness.
The results have shown that S/MARs have a rich content of Adenines (A) and Thymines (T) especially when analyzing sequences with an AT content > 70%, as 12 % of them contain S/MARs while only 3% contain promoters and 0.3% contain exons. Conversely the portion of sequences with low AT content that contain S/MARs is significantly lower (6.5%) than exons (67%) and promoters (47%).
Searches for consensus sequences describing S/MARs were performed using weight matrices. A weight matrix is a way of describe a pattern or a motif through a matrix. Usually in the rows of the matrix are the four DNA bases or if the matrix is applied to a protein the letters corresponding to the amino acids. And in matrix columns we have the frequency of occurrence for each of the bases or for each of the amino acids.
Weight matrices are usually constructed based on information provided by the multiple alignments of several sequences, so that frequencies for each base or amino acid can be calculated. Weight matrices are more powerful than consensus sequences because they allow a probabilistic treatment.
In the search for consensus sequences describing S/MARS the IUPAC consensus strings have been converted to weight matrices. IUPAC (International Union of Pure and Applied Chemistry) have defined a set of characters to identify variabilities in similar sequences so that they may be expressed by means of a consensus string. Results however were inconclusive.
Another search was conducted especially for sequences of six nucleotides, and for possible transcription factors related sequences but once again the results were inconclusive. Some S/MARs were found in the majority of sequences but not in all. Another interesting study [15] defined a set of probabilistic rules to find S/MARs, however is suggested that these rules may conflict among themselves. A more complete list of results and previous work could be found on [24].
3.1.2 Choosing a S/MARS Annotation program
For the task of annotating S/MARS in the vicinity of AOX genes in Arabidopsis
thaliana and rice SMARTest were chosen. This decision was based on several
considerations discussed below.
For the dataset considered in [16] SMARTest was found to have the best specificity (63%), a lower value that the one specified in [17] (68%). Regarding sensitivity SMARTest values are low (17% in [16]) and (38% in [17]). Analyzing data in [16] also when comparing the values for other programs SMARTest showed lower sensitivity values. However in comparison with the absolute values, regarding for instance ChrClass program for 53 true positives, defined experimentally, ChrClass has identified 105
![Figure 2- The figure above represents the various levels of chromatin organization, from the DNA level to the chromosome level [7]](https://thumb-eu.123doks.com/thumbv2/123dok_br/18272305.880757/31.892.472.771.366.1047/figure-figure-represents-various-levels-chromatin-organization-chromosome.webp)
![Figure 4 - This image represents a partial protein alignment for AOX genes from different species, the image is adapted from [20] when rice AOX1c was identified](https://thumb-eu.123doks.com/thumbv2/123dok_br/18272305.880757/37.892.131.783.334.789/figure-represents-partial-protein-alignment-different-species-identified.webp)