Brokers in Biotechnology and Software
Networks in EU Research Projects
Merle Küttim Department of Business Administration,
Tallinn University of Technology Ehitajate tee 5, Tallinn 19086, Estonia Email: [email protected] Aino Kiis Department of Business Administration, Tallinn University of Technology Ehitajate tee 5, Tallinn 19086, Estonia Email: [email protected] Cristina Sousa REMIT – Research on Economics, Management and
Information Technologies, Universidade Portucalense R. Dr. António Bernardino de Almeida 541, Porto 4200-072, Portugal Email: [email protected]
Abstract: Researchers have acknowledged that the flow of knowledge is influenced by the non-structural and structural features of networks. This paper aims to further develop an understanding of the institutional and structural features of knowledge networks by relating the brokerage roles of actors to the types and locations of organisations in biotechnology and software networks. The study is set within the context of the European Union (EU) research and innovation policy. It is designed as a social network analysis of EU research projects in biotechnology and software that took place between 1995 and 2016, wherein organisations from the Baltic States participated. The results of the study revealed that higher education and research organisations and public bodies acted as the main knowledge brokers and brokered more frequently across
different regions in biotechnology networks. In software, it was the universities and research organisations that fulfilled this role. Thus, this study contributes to an understanding about the institutional and structural aspects of knowledge networks by focusing on brokers and their brokerage roles and relating these factors to specific organisation types and the locations of actors within the two sectors. It also adds the empirical context of the Baltic States in the areas of biotechnology and software collaborative research projects to the studies of knowledge networks, and offers practical suggestions for implementing collaborative research projects. Keywords: brokers, differentiated knowledge base, knowledge networks, social network analysis, brokers, the Baltic States
1. Introduction
Researchers have acknowledged that the flow of knowledge is influenced by the non-structural and structural features of networks and partnerships across institutional (i.e., countries, industries and technologies) and structural boundaries (Balachandran & Hernandez, 2018). Collaborative research projects consist of the interactions between actors from different sectors, locations and types (i.e., higher education and research, enterprises, public bodies, non-governmental organisations (NGOs), etc.), whose main activities belong to different organisational fields. Thus, organisations follow different types of organisational logics also in their attempts to cooperate with one another (Kalantaridis et al., 2017).
The present study draws on the understanding that differences in sectoral knowledge networks influence the process of innovation. The geographical compositions of sectoral networks have been found to differ. In industries with an analytical knowledge base, like biotechnology, knowledge is often codified, enabling it to be exchanged over long distances (Mattes, 2012). In sectors with synthetic knowledge base, like software, knowledge is more difficult to exchange across geographical distances when there is a dominance of tacit knowledge that requires more specific expertise, craft and practical skill (Asheim et al., 2007). The types of actors who hold a strategic position also varies within networks. In biotechnology, university-industry connections are frequent and important during research, which often results in radical innovation (Asheim et al., 2007). In software, learning occurs
interactively with clients and suppliers, leading to incremental innovation (Asheim et al., 2007). While the network structures of biotechnology firms tend to be larger, centralised, clustered, less dense and more connected, the network structures of software firms are often fragmented and corporate-based (Salavisa et al., 2012).
Like the structural features of networks, organisations’ characteristics and geographical locations are important for the flow of knowledge. Nonetheless, these factors have received limited attention (Owen-Smith & Powell, 2004). In terms of structural features, such as brokerage, although a significant amount of attention has been paid to the gatekeepers who influence the flow of knowledge by granting network access to outsiders, networks consist of actors with various brokerage roles. These same actors can simultaneously embody different roles that require closer examination (Chen et al., 2015). Thus, this paper aims to further develop an understanding of the institutional and structural features of knowledge networks by relating the brokerage roles of actors to the organisational types and locations of biotechnology and software networks. For these reasons, the following research questions were developed: (1) what characterises the knowledge brokers of biotechnology and software networks in terms of organisational type and location; and (2) to what extent do the brokers who represent different organisational types fulfil different brokerage roles (i.e., coordinators, gatekeepers, consultants or liaisons)?
This study is established within the context of the European Union (EU) research and innovation policy that aims to achieve open innovation and science (European Commission, 2016). The objectives of the EU’s research and innovation policy are materialised in EU programmes for research and innovation that aim at supporting bottom-up research initiatives. These have evolved from the first framework programme (FP) that was launched in 1983 to FP8, which was initiated in 2013 and later renamed Horizon 2020 (Reillon, 2017). The Baltic States—Estonia, Latvia and Lithuania—have participated in these research and innovation programmes since the 1990s. In addition, they gradually became full members within these programmes when they started the process of EU accession and joined the Union in 2004 (Moedas & Smits, 2015).
This study focuses on the networks of organisations from the Baltic States that participated in EU collaborative research projects (primarily FPs) in biotechnology and software from 1995 to 2016. It uses social network analysis
to study network structure and the Kruskal-Wallis H test to compare groups. The study shows that in both sectors (biotechnology and software), higher education and research organisations, and in biotechnology also public bodies, act more frequently as brokers and broker more often also between different regions. At a practical level, the study adds the empirical context of the Baltic States, in the areas of biotechnology and software collaborative research projects, to the studies of knowledge networks. It also offers practical suggestions for implementing collaborative research projects. The study contributes to the theoretical understanding of the institutional and structural features of knowledge networks by focusing on the sectoral differences between brokers and brokerage roles.
The rest of the article is structured as follows. The theoretical framework section introduces the primary theoretical approaches that explain the institutional and structural boundaries of networks, providing an analytical framework for the study. The methodology section offers an overview of the research approach, sample and data collection and analysis methods. The study’s results section presents separate findings for biotechnology and software networks and then discusses the results in the context of previous studies. The final section concludes, highlights the present research’s contributions and offers suggestions for further study.
2. Theoretical framework
2.1 Institutional factorsAlthough the existence of partnerships in multiple domains can enable access to new and distinct sources of knowledge, transferring that knowledge across institutional boundaries can prove costly (Balachandran & Hernandez, 2018). There are a number of institutional differences between the actors. First, collaborative research projects involve interaction between actors of different types (higher education and research, enterprises, public bodies, NGOs, etc.) whose primary activities belong to different organisational fields. Organisational fields are recognised areas of the institutional life of actors that operate within the same domain that can also include organisations that critically influence them (Powell & DiMaggio, [1983] 1991). When considered under the lens of the network theory, organisational fields can consist of the industrial and educational sectors, together with partners, competitors, funding agencies and regulators (Scott, 2008).
It is possible for organisations to imitate environmental elements in their structures and deal with their environments at their boundaries (Meyer & Rowan, 1977). Boundary work involves work within and across various fields. While the former includes maintaining or changing a given field by manipulating its boundaries from the inside, the latter involves protecting or controlling a specific field settlement by relating it to other fields (Helfen, 2015). Configurational boundary work brings together certain actor’s activities, leaves others apart and facilitates interaction across physical, social, temporal or symbolic spaces (Langley et al., 2019). This results in the formation of cross-field intersections around shared and changing issues that encompass distinct sets of actors and multiple conflicting logics (Zietsma et al., 2017). Thus, organisations of different types have to overcome different organisational logics and motivations in order to cooperate (Kalantaridis et al., 2017).
Second, EU research projects consist of actors from different geographical locations and of different geographical reach. In addition to the physical distance between the actors, geographical proximity denotes also similarities in institutional context because of co-location (Boschma, 2005; Hoekman et al., 2009). While geographical proximity is helpful in terms of local knowledge spillovers (Grillitsch & Nilsson, 2015), it is neither a sufficient nor necessary condition for learning or interactive innovation (Boschma, 2005; 2018). Nevertheless, geographical proximity has been found to contribute to the development of other proximity types, such as cognitive proximity, which can increase over time for engineering firms and research organisations that are socially and geographically close (Steinmo & Rasmussen, 2016). Geographical proximity has also been found to be more important to collaborations between organisations with different institutional backgrounds than to organisations of the same type (Ponds et al., 2007).
Finally, and in terms of sectoral characteristics, a distinction can be made between analytical and synthetic knowledge bases (Asheim & Gertler, 2005; Asheim & Coenen, 2005; Asheim et al., 2011). An analytical knowledge base is characteristic of industries where scientific knowledge is important and knowledge creation is based on formal models, codified science and rational processes (e.g., biotechnology) (Asheim & Gertler, 2005). Knowledge tends to be codified and then transferred from R&D organisations to enterprises through formal R&D cooperation, which typically leads to radical innovation (Asheim & Coenen, 2005). This is because, in biotechnology, university-generated knowledge is often generic and capable of creating a broad range
of applications (Salavisa et al., 2012). When innovation builds on analytical knowledge, R&D and scientific research gain prominence and university-industry connections become more important and frequent (Asheim, 2007). As knowledge is often codified, it can be exchanged over long distances after the initial explorative stages of research (Mattes, 2012; Martin, 2013). A synthetic knowledge base prevails in settings where there is tacit knowledge, and the application of a novel combination of existing knowledge dominates (Asheim & Gertler, 2005). This occurs in software and computing services that are based more on engineering than science (Salavisa et al., 2012; Weterings & Ponds, 2009). In these cases, recombining knowledge that has been drawn from suppliers or service firms usually leads to incremental innovation (Asheim & Coenen, 2005). Although developments take place at a rapid pace in software, this generates a more limited scope of entrepreneurial opportunity (Salavisa et al., 2012). University-industry connections remain relevant to applied research and development (Asheim & Gertler, 2005). Nevertheless, networks are primarily created between suppliers and customers and within communities of practice (Martin, 2013). Firms with a synthetic knowledge base require more specific expertise, craft and practical skill, which are difficult to exchange across geographical distances (Asheim et al., 2007). For these reasons, they tend to be less involved in international cooperation and more focused on local issues (Coenen et al., 2006; Herstad et al., 2014; Martin, 2013).
2.2 Structural factors
Social network analysis focuses on the structure and evolution of interorganisational interaction and the flow of information, knowledge and other resources (Ter Wal & Boschma, 2009). Because actors are organised in networks of nodes that are connected through structured relationships (Granovetter, 1973; Krackhardt, 1992), social network analysis enables different network structures and the role that actors play in those networks to be explored (Prell, 2012). Brokers transfer knowledge between actors who are not directly linked (Nooteboom, 2003). They can also recombine and exploit the knowledge that they draw from the various actors benefitting thus from their intermediary position (Hargadon & Sutton, 1997). Knowledge brokering involves both the transfer and conversion of knowledge (Chen et al., 2015) and is indicative of the flow of knowledge (Kauffeld-Monz & Fritsch, 2013). In terms of geography and brokerage types, Balachandran and Hernandez (2018) found that while actors in domestic triads (three
connected actors) can affect the productivity of innovation, actors in foreign triads are more likely to strongly influence the radical nature of innovation. Networks in industries that are based in analytical knowledge have been found to remain weakly embedded in their host regions (Liu et al., 2013). In sectors that rely on analytical knowledge bases, patents are more frequently used to protect intellectual property (Ter Wal & Boschma, 2009). In addition, the use of this type of protection has been found to increase firms’ willingness to collaborate at a distance with globally-dispersed partners (Herstad et al., 2014). Although formal firm networks are likely to be larger, more connected, less dense, more centralised and more clustered, informal firm networks are often organised around universities that act as informal knowledge providers (Salavisa et al., 2012). Chen et al. (2015) revealed that in cases of brokerage, policy-induced intermediaries did not fulfil their brokerage roles in the Taiwanese biopharmaceutical sector. They also argued that research organisations and firms should play more active roles in brokering information. Firms that rely on synthetic knowledge frequently develop close connections in their networks through production, suppliers and clients at the regional level (Liu et al. 2013). This means that they also remain less involved in international collaboration (Herstad et al., 2014). Although formal firm networks have been found to be significantly fragmented and corporate, informal networks can be absent altogether or only present with other central firms (Salavisa et al., 2012). Kauffeld-Monz and Fritsch (2013) concluded that for regional innovation networks in Germany, public research organisations were important for the exchange of interregional knowledge, especially in lagging regions without larger firms. Kim et al. (2018) advanced a similar argument for networks within South Korea.
2.3 Analytical framework of the study
The analytical framework for the study postulates that biotechnology and software networks differ in terms of their origin, reliance on different knowledge bases, the core ideas behind their innovations, their geographical compositions and their strategic actors and network structures (Table 1). While biotechnology originated in university labs, the software industry has emerged alongside with the development of computer business and increased use of personal computers.
For biotechnology networks, their analytical knowledge bases involve scientific knowledge that is created through formal deductive processes. For
software networks, their synthetic knowledge bases require more applied knowledge that is often generated through inductive processes. While sectors with analytical knowledge bases produce more radical innovations, industries with synthetic knowledge bases make more incremental advancements. Table 1. Analytical framework of the study
Biotechnology Software
Origin University labs Computer business, personal computers
Dominating knowledge
base
Analytical, i.e. scientific knowledge often based on
deductive processes and formal models
Synthetic, i.e., applied, problem-related knowledge (engineering), often created through inductive processes Core idea of
innovation leading more often to radical Creation of new knowledge innovation
Application or recombination of existing knowledge leading
mainly to incremental innovation Geographical
composition Networks weakly embedded in the host region due to dominance of codified knowledge resulting from documentation in patents
and publications
Close linkages develop with producers, suppliers and clients due to dominance of tacit knowledge resulting from more concrete knowhow, craft
and practical skill Strategic
actors Research collaboration between firms (R&D department) and research organisations, learning as a top-down process, firms’ networks organised around
universities
Interactive learning of enterprises with other firms, clients and suppliers, learning as a bottom-up process, firms’ networks are corporate-based, universities absent or present
with central firms Network
structure, incl. brokerage
Networks are larger, more connected, less dense, more centralised and more
clustered, brokers are mainly higher education and
research organisations
Networks are more fragmented, brokers are both higher education and research
organisations and larger enterprises
Source: Compiled by the authors based on Asheim & Coenen, 2005; Mattes, 2012;
Salavisa et al., 2012; Liu et al., 2013; Steinmo & Rasmussen, 2016
Networks with analytical knowledge bases are often international, as the more codified nature of knowledge allows it to be transferred over greater distances. In networks with synthetic knowledge bases, spatial closeness is essential because the more tacit nature of this type of knowledge requires
face-to-face contact for it to be exchanged. Learning tends to occur as a top-down process in sectors with analytical knowledge bases, and higher education and research organisations play a central role in its facilitation. In sectors with synthetic knowledge bases, learning is more of a bottom-up process, where central firms are as important as the universities and communities of practice that emerge. While, in the former case, networks tend to be larger, more connected and centralised, in the latter case they are often more fragmented.
3. Methodology
This study is placed within the context of the Baltic States: Estonia, Latvia and Lithuania. Because these countries are located at the Eastern border of the EU, they are considered to be at the periphery of innovation (Eder, 2019). According to the European Innovation Scoreboard, while Estonia is a strong innovator, Latvia and Lithuania are moderate innovators that perform below the EU average for innovation (European Innovation Scoreboard, 2019). According to the Global Innovation Index, within the wider region of the Baltic Sea, the Baltic States (especially Latvia and Estonia) are characterised by lower levels of university-industry research collaboration (Murashova & Loginova, 2017).
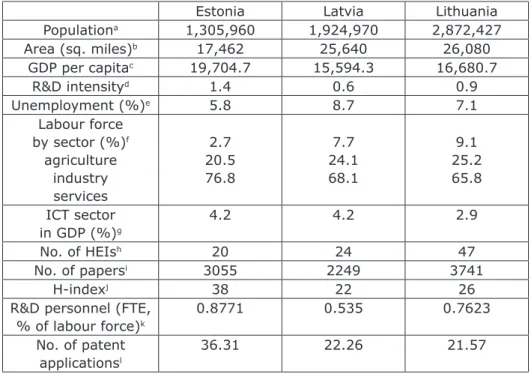
The three countries share a similar history in that they regained independence in the early 1990s, joined the EU in 2004 and adopted the euro after 2010. Nonetheless, the countries differ demographically and in terms of their economic development (Table 2). Estonia is the smallest of the countries by area and population, but it has the highest GDP per capita and the lowest unemployment rate. The R&D intensity, i.e., the expenditure on R&D as a percentage of GDP, is the highest in Estonia, followed by Lithuania and Latvia. In Estonia, the service sector dominates more than in the other countries, but the GPD of the country’s ICT sector is equal to that of Latvia. Estonia has the lowest number of higher education institutions (and the smallest population), but it has more R&D personnel, patent applications and a higher h-index than the other countries. While in 2006, publications by Estonian authors were referred to 20% less than 50% of the publications from the leading countries in the world, by mid-2018, the rate of reference for Estonian publications had grown to 40% more references than in the comparison group (Lauk & Allik, 2018). Software and biotechnology were
selected for the present analysis, as these are the smart specialisation areas of the Baltic States and reflect the current strengths and future potential of these economies (Smart Specialisation, 2017a; 2017b; 2017c).
Table 2. Key data for the Baltic States
Estonia Latvia Lithuania
Populationa 1,305,960 1,924,970 2,872,427 Area (sq. miles)b 17,462 25,640 26,080 GDP per capitac 19,704.7 15,594.3 16,680.7 R&D intensityd 1.4 0.6 0.9 Unemployment (%)e 5.8 8.7 7.1 Labour force by sector (%)f agriculture industry services 2.7 20.5 76.8 7.7 24.1 68.1 9.1 25.2 65.8 ICT sector in GDP (%)g 4.2 4.2 2.9 No. of HEIsh 20 24 47 No. of papersi 3055 2249 3741 H-indexj 38 22 26
R&D personnel (FTE, % of labour force)k
0.8771 0.535 0.7623
No. of patent applicationsl
36.31 22.26 21.57
Source: compiled by the authors
Note:
a Population in 2018, http://worldpopulationreview.com/;
b https://www.ucis.pitt.edu/crees/sites/default/files/images/documents/Baltics.pdf; c GDP per capita in 2017 (current US dollars), https://data.worldbank.org/,
Euro-stat;
d R&D intensity (expenditure on R&D as a percentage of GDP) in 2018,
http://www.oecd.org/sti/msti.htm;
e Unemployment rate 2017, Eurostat;
f https://www.cia.gov/library/publications/the-world-factbook/; g ICT sector in GDP in 2015, Eurostat;
h European Commission; i, j Web of Science in 2017;
k R&D personnel in 2016, Eurostat;
l Patent applications to the European patent office in 2017, Eurostat.
More specifically, the study focuses on EU-funded research projects in which organisations from the Baltic States have participated. The study is conducted in the context of EU research and innovation policy that has carried the three primary aims that follow: open innovation, open science
and open access to the world (European Commission, 2016). These policy objectives have been supported by EU programmes for research and innovation as tools for managing the implementation of community research initiatives. The EU began its involvement in research activities in the 1970s. At the start of the 1980s, the FP for research was established as a tool for managing the implementation of community research initiatives. Historically, FP1 was launched in 1983, followed by FP2 in 1987, FP3 in 1990, FP4 in 1994, FP5 in 1998, FP6 in 2002, FP7 in 2006 and FP8 in 2013, which was renamed Horizon 2020 (Reillon, 2017). Estonia, Latvia and Lithuania began to participate in the FPs in the 1990s in a limited manner and on a project-by-project basis. They became full members of the EU and FPs in 2004 (Moedas & Smits, 2015).
This study performs a social network analysis—an approach with a conceptual, methodological and analytical toolkit (Prell, 2012). It suits the purposes of the current article by allowing the structure of social action (i.e., relational data) to be analysed and by facilitating an understanding of the density and texture of social networks (Scott, 2013).
Data about research projects and participating organisations from 1995 to 2016 originated from the European Commission’s CORDIS database, which is a public repository containing information on all EU-funded research projects and their results (CORDIS, 2020). The data were inserted into MS Excel as a list of projects and participating organisations, and unique pairs of all organisations were generated within each project. The data were further analysed using UCINET, a general-purpose computer programme for network analysis that enables the calculation of various network measures, such as density, degree, betweenness and clustering (Borgatti et al., 2002). Single-mode (1-mode) square matrices were used with as many rows and columns as there were actors (organisations) in the data set, and the scores in the cells of the matrix recorded information about the ties between each pair of actors (Hanneman & Riddle, 2005). Binary matrices were used. The cell scores were equal to 1 when the organisations had participated in the same project and equal to 0 when they had not. The ties in the matrices were undirected. In addition, the matrices were symmetrical as a mutual tie was assumed to exist between organisation pairs that had taken part in the same project.
The patterns were visualised with Netdraw, which enabled a graphic representation of the networks that included their relations and attributes (Borgatti et al., 2002). To understand the social processes that formed the tie
structures in a given network (Hanneman & Riddle, 2005), node attributes were assigned to the organisations. Based on the earlier literature review, three types of attributes were used: organisation type, location and total normalised brokerage scores. Following the classifications that had been collected from the CORDIS database, organisation type included higher education and research organisations, private for-profit entities, public bodies and others (e.g., NGOs and foundations). It enabled the participation and brokerage of different types of organisations in biotechnology and software networks to be explored. Location was assigned according to the UN geographical division of countries1: Eastern Europe, Northern Europe,
Western Europe, Southern Europe and outside of Europe (with Estonia, Latvia and Lithuania included in the designation ‘Eastern Europe’) (UN, 2020). This enabled the brokerage of different types of organisations within their own regions and between regions to be observed. The total normalised brokerage scores were calculated with UCINET.
The following network metrics were calculated with UCINET and used in the current paper to analyse the density and texture of the networks: • Density: levels of linkage among actors, i.e. the proportion of the
maximum possible number of ties (Scott, 2013).
• Components: connected subgraphs of actors, wherein all actors are connected through ties, but there are no ties to actors outside a given component (Scott, 2013).
• Clustering coefficient: a clustering measure (i.e., the extent to which actors form small groups, wherein many actors are present and only a few actors are connected through different clusters with each other) (Kunegis, 2017).
• Degree centrality: involvement in the network (i.e., the number of immediate contacts an actor has in a network) without considering the directions of each tie (Prell, 2012).
• Betweenness centrality: a distance-based measure that includes indirect links within the network (Kauffeld-Monz & Fritsch, 2013). The measure looks at the levels of a complete network and how often
1 Eastern Europe: Belarus, Bulgaria, Czech Republic, Estonia, Hungary, Latvia, Lithuania,
Poland, Republic of Moldova, Romania, Russian Federation, Slovakia and Ukraine. Northern Europe: Denmark, Finland, Iceland, Norway, Sweden and United Kingdom. Western Europe: Austria, Belgium, France, Germany, Luxembourg, Netherlands and Switzerland
Southern Europe: Albania, Bosnia and Herzegovina, Croatia, Greece, Italy, Malta, Mon-tenegro, North Macedonia, Portugal, Serbia, Slovenia and Spain.
an actor is placed between two other actors (i.e., how often an actor lies on the geodesic distance (shortest path) that connects two other actors) (Prell, 2012). It also indicates potential control over the flow of information (Prell, 2012) and the ability to absorb that information (Owen-Smith & Powell, 2004).
• Normalised brokerage: a type of analysis that involves ego network data and focuses on the number of instances that an ego brokers between two unconnected others (Prell, 2012). Raw brokerage scores are divided by the expected values given group sizes to analyse which roles of actors are significant, as these occur more frequently than expected (Hanneman & Riddle, 2005).
Since the data this study uses are based on archival data instead of socio-metric questionnaires, the ties between actors are treated as undirected. Therefore, Gould and Fernandez’s (1989) brokerage roles were modified to include the following:
• Coordinator: an actor that connects two other actors in its own group (i.e., actors from the same region).
• Gatekeeper: an actor that connects a member of its own group with an outsider (i.e., one actor from the same region with an actor from another region).
• Consultant: an actor that connects two members of a group from a region that is not its own (i.e., two actors from another region).
• Liaison: an actor that connects members of two different groups from regions that are not its own (i.e., two actors from two different regions) (Lissoni, 2010).
The Kruskal-Wallis H test was used to examine the differences between the total normalised brokerage roles of coordinator, gatekeeper, consultant and liaison (dependent variables) and the types of organisations (independent variables). The brokerage roles were calculated according to the actors’ locations (using location as a grouping variable) in order to study the brokerage of different organisation types across the geographical distances of different regions. The Kruskal-Wallis H test is a rank-based nonparametric test, which indicates “statistically significant differences between two or more groups of an independent variable on a continuous or ordinal dependent variable” (Laerd Statistics, 2018). It is also used as the assumption of equality of group variances is violated (Morgan et al., 2020). Post-hoc comparisons were undertaken to determine which of the factor’s values contributed most to the explanation of the dependent variables.
Post-hoc Tamhane T2 test was used because of the unequal variance and sample size (Shingala & Rajyaguru, 2015).
The sample consisted of 407 projects (168 in biotechnology and 238 in software) (Table 3). For the purposes of the analysis, the projects were divided into three time periods in accordance with the start and end dates of the various FPs. These included 1995–2003 for FP4, FP5, IC-INTAS and IS-ECONTENT; 2003–2007 for FP6, IC-INTAS and IS-ECONTENT; and 2007–2016 for FP7, H2020 and CIP (IC-INTAS, 2014; IS-ECONTENT, 2001; CIP, 2015).
Table 3. Network metrics for biotechnology and software networks Network
para-meters
Compo-nents of
measures Biotechnology Software
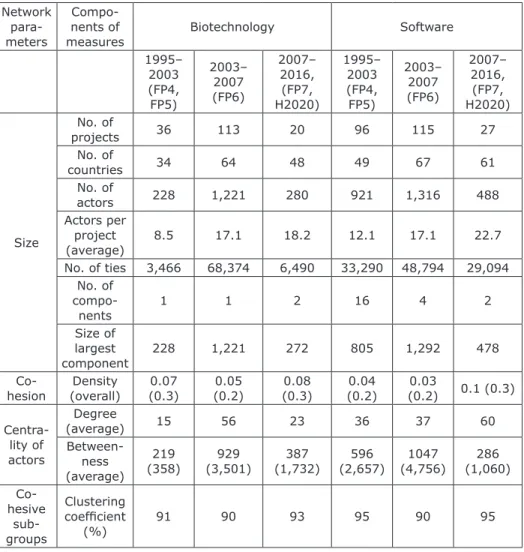
1995– 2003 (FP4, FP5) 2003– 2007 (FP6) 2007– 2016, (FP7, H2020) 1995– 2003 (FP4, FP5) 2003– 2007 (FP6) 2007– 2016, (FP7, H2020) Size No. of projects 36 113 20 96 115 27 No. of countries 34 64 48 49 67 61 No. of actors 228 1,221 280 921 1,316 488 Actors per project (average) 8.5 17.1 18.2 12.1 17.1 22.7 No. of ties 3,466 68,374 6,490 33,290 48,794 29,094 No. of compo-nents 1 1 2 16 4 2 Size of largest component 228 1,221 272 805 1,292 478
Co-hesion (overall)Density (0.3)0.07 (0.2)0.05 (0.3)0.08 (0.2)0.04 (0.2)0.03 0.1 (0.3) Centra-lity of actors Degree (average) 15 56 23 36 37 60 Between-ness (average) 219 (358) (3,501)929 (1,732)387 (2,657)596 (4,756)1047 (1,060)286 Co-hesive sub-groups Clustering coefficient (%) 91 90 93 95 90 95
Table 4. Actors and brokers in biotechnology and software networks Network
para-meters
Components
of measures Biotechnology Software
1995– 2003 (FP4, FP5) 2003– 2007 (FP6) 2007– 2016, (FP7, H2020) 1995– 2003 (FP4, FP5) 2003– 2007 (FP6) 2007– 2016, (FP7, H2020) Compo-sition – types of orga-nisations (%) Higher education and research 61.8 44.9 44.3 39.7 35.6 54.5 Private for-profit entities 15.8 30.5 26.8 36.4 38.1 20.1 Public bodies 7.5 7.8 22.1 11.2 14.4 16.4 Other (NGOs, etc.) 14.9 16.8 6.8 12.7 11.9 9.0 Compo-sition – location (%) Eastern Europe 23.3 20.6 19.6 23.6 20.2 16.2 Northern Europe 26.8 22.4 20.4 21.2 20.1 19.9 Western Europe 30.7 32.1 30.7 27.8 31.1 31.8 Southern Europe 17.1 18.8 23.2 24.5 22.2 26.0 Outside of Europe 2.2 6.1 6.1 2.9 6.5 6.2 Brokers – types of orga-nisations (%) Higher education and research 58.7 68.8 20.3 76.4 57.7 77.8 Private for-profit entities 4.8 11.6 1.7 8.9 21.1 4.2 Public bodies 17.5 8.1 59.3 7.3 12.1 12.5 Other (NGOs, etc.) 19.0 11.6 1.7 7.3 9.1 5.6 Brokers – location (%) Eastern Europe 35.0 20.4 20.3 24.4 21.5 19.4 Northern Europe 31.7 24.2 22.0 22.0 20.8 20.8 Western Europe 20.6 33.3 37.3 30.9 27.2 36.1 Southern Europe 11.1 17.2 15.3 20.3 26.5 19.4 Outside of Europe 1.6 4.9 5.1 2.4 4.0 4.2
In biotechnology, there were 228, 1221 and 280 actors in the three time periods. The average degree was the highest during the second period (FP6), with a single actor having an average of 56 direct ties (Table 3). While the overall density was the highest during the first (FP4 and FP5) and third periods (FP7 and H2020), the average betweenness was also the lowest during these periods, indicating fewer structural holes in the network. The biotechnology network was heavily clustered during each period.
In software, there were 921, 1,316 and 488 participant organisations across the three periods. Participation in the software projects was more active than in biotechnology, especially during the first two periods (FP4, FP5 and FP6). The degree was the highest during the third period (FP7, H2020), with a single actor having an average of 60 ties. Although the overall density of the network was at its highest in the third period (FP7 and H2020), the average betweenness was at its lowest during this period, indicating fewer structural holes. Like in biotechnology, the networks in the three periods were highly clustered.
Most of the actors in biotechnology were located in Western Europe, followed by Northern and Eastern Europe (Table 4). Higher education and research organisations were the most prevalent types of actors, followed by enterprises, NGOs and public bodies. In software, the overall division of organisations between regions was different from biotechnology due to the larger number of actors from Southern Europe, but similar regarding the participation of Western and Northern European organisations. Enterprises were more represented in software, except in the third period.
This study was limited by the uneven distribution between the networks’ projects and actors and the sectors and periods that led to the comparison of networks of different sizes. This influenced some of the networks’ characteristics. As an example, density tended to be higher in smaller networks because it was more difficult for the actors to be connected with a larger proportion of other actors from larger networks.
The use of archival CORDIS data limited the number of variables that were used in this study. Because the project participants’ organisation types and locations were recorded in the database, these were also used in the present study. Regardless, it is not uncommon for studies on collaborative networks to use only two variables. To illustrate, Ponds et al. (2007) used institutional and geographical proximity to explore the extent to which cooperation between different types of organisations was more geographically localised than cooperation between similar organisations.
4. Results
4.1 Brokers in the biotechnology network
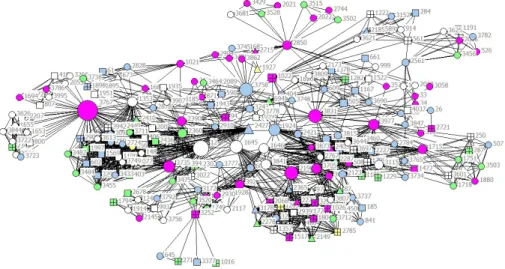
Brokerage, or the extent to which organisations connect otherwise unconnected pairs of actors, has varied across different periods of time. During the first (FP4 and FP5) and second (FP6) of this study’s research periods, the actors with the highest brokerage scores were higher education and research organisations from Eastern and Western Europe and Western and Northern Europe, respectively. By comparison, the actors with the highest brokerage scores during the third researched period (FP7 and H2020) included public bodies from Western and Northern Europe (Figs. 1–3). Moreover, Eastern European NGOs were more active as brokers during the first period (FP4 and FP5), and Western and Northern European NGOs were more active during the second period (FP6). Enterprises were the least active brokers amongst the other types of organisations, and the firms with the highest brokerage scores originated from Northern and Western Europe during every period. Furthermore, enterprises from Eastern Europe did not act as brokers at all during the first (FP4 and FP5) and third periods (FP7 and H2020).
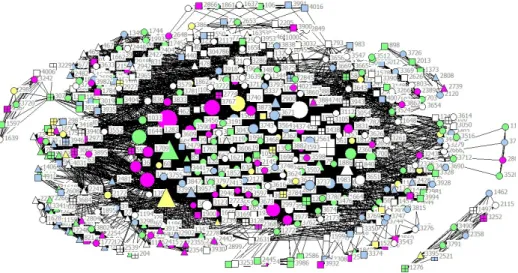
Figure 1. Biotechnology network 1995–2003 (FP4, FP5) (N = 228).
Note: Red – Eastern Europe, blue – Northern Europe, white – Western Europe, green – Southern Europe, yellow – outside of Europe; circle – higher education and research organisations, square – private for-profit, triangle – public bodies, box – NGOs; node size – based on total normalised brokerage scores.
See high-resolution figure in colour online at
Figure 2. Biotechnology network 2003–2007 (FP6) (N = 1221).
Note: Red – Eastern Europe, blue – Northern Europe, white – Western Europe, green – Southern Europe, yellow – outside of Europe; circle – higher education and research organisations, square – private for-profit, triangle – public bodies, box – NGOs; node size – based on total normalised brokerage scores.
See high-resolution figure in colour online at
https://www.ies.ee/tjes/vol10/no1/kuttim/Figure02.jpg
Figure 3. Biotechnology network 2007–2016 (FP7, H2020) (N = 280).
Note: Red – Eastern Europe, blue – Northern Europe, white – Western Europe, green – Southern Europe, yellow – outside of Europe; circle – higher education and research organisations, square – private for-profit, triangle – public bodies, box – NGOs; node size – based on total normalised brokerage scores.
See high-resolution figure in colour online at
Figure 4. Baltic States actors in biotechnology network 1995–2003 (FP7, H2020) (N = 21).
Note: Circle – higher education and research organisations, square – private for-profit, triangle – public bodies, box – NGOs; node size – based on total normalised bro-kerage scores.
See high-resolution figure in colour online at
https://www.ies.ee/tjes/vol10/no1/kuttim/Figure04.jpg
Figure 5. Baltic States actors in biotechnology network 2003–2007 (FP7, H2020) (N = 68).
Note: Circle – higher education and research organisations, square – private for-profit, triangle – public bodies, box – NGOs; node size – based on total normalised bro-kerage scores.
See high-resolution figure in colour online at
Figure 6. Baltic States actors in biotechnology network 2007–2016 (FP7, H2020) (N = 25).
Note: Circle – higher education and research organisations, square – private for-profit, triangle – public bodies, box – NGOs; node size – based on total normalised bro-kerage scores.
See high-resolution figure in colour online at
https://www.ies.ee/tjes/vol10/no1/kuttim/Figure06.jpg
The organisations from the Baltic States that acted as brokers were primarily universities or research institutes (Figs. 4–6). The University of Latvia (Latvia), Estonian Biocentre (now merged with the University of Tartu) (Estonia), Vilnius University (Lithuania) and the University of Tartu (Estonia) had the highest brokerage scores in the first (FP4 and FP5) and second periods (FP6). The University of Technology of Kaunas (Lithuania) and Tallinn University of Technology (Estonia) also had high brokerage scores in the second period. Some of the NGOs and public bodies acted as brokers during all three periods, and only one enterprise from each of the Baltic States acted as a broker during the second period (FP6).
The results from the Kruskal-Wallis H test indicated that there was, in biotechnology, a statistically significant difference in brokerage scores for all four brokerage roles (i.e., coordinator, gatekeeper, consultant and liaison) for the different organisation types during all three time periods (Appendices 1–3). The post-hoc Tamhane T2 test showed that higher education and research organisations embodied the roles of gatekeeper and liaison more
often than enterprises during the first period (FP4 and FP5) and assumed all four roles during the second period (FP6). Public bodies acted as consultants more often than enterprises in the first period and as gatekeepers and liaisons during the second period. The third period (FP7 and H2020) differed from the earlier periods in that public bodies acted as gatekeepers, consultants and liaisons more often than the other organisation types (i.e., NGOs, enterprises and higher education and research organisations). Moreover, the first two periods (FP4 and FP5; FP6) were similar in that universities and research organisations frequently acted as brokers. In the third period (FP7 and H2020), public bodies held strategic positions in the networks and in connecting other actors. Higher education and research organisations often brokered within their regions and across different regions (acting as coordinators, gatekeepers, consultants and liaisons), and public bodies frequently brokered between regions (acting as gatekeepers, consultants and liaisons). During each period, enterprises acted as brokers the least and were underrepresented when compared to the proportion of the enterprises in the overall biotechnology network (Table 4).
4.2. Brokers in software network
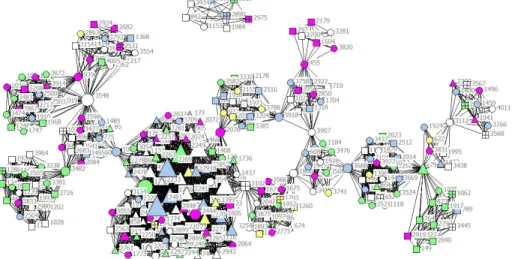
In the software network, the actors with the highest brokerage scores were primarily higher education and research organisations from Western and Southern Europe during all periods. In addition, higher education and research organisations from Eastern Europe achieved the highest brokerage scores during the third period (FP7 and H2020) (Figs. 7–9). Enterprises in software had higher brokerage scores than enterprises in biotechnology, especially during the second period (FP6), and primarily originated from Western Europe. Public bodies from Western Europe, Southern Europe and outside of Europe were more active during the second (FP6) and third periods (FP7 and H2020), and NGOs from Western Europe were more active in the third period (FP7 and H2020).
Like with biotechnology, the actors from the Baltic States that acted more frequently as brokers were higher education and research organisations (Figs. 10–12). In addition, both classical universities (the University of Latvia, Vilnius University, the University of Tartu) and specialised technical universities had higher brokerage scores during every software period. These technical universities included Tallinn University of Technology (Estonia), the University of Technology of Kaunas (Lithuania), Riga Technical University (Latvia) and Vilnius Gediminas Technical University (Lithuania). Public
Figure 7. Software network 1995–2003 (FP4, FP5) (N = 921).
Note: Red – Eastern Europe, blue – Northern Europe, white – Western Europe, green – Southern Europe, yellow – outside of Europe; circle – higher education and research organisations, square – private for-profit, triangle – public bodies, box – NGOs; node size – based on total normalised brokerage scores.
See high-resolution figure in colour online at
https://www.ies.ee/tjes/vol10/no1/kuttim/Figure07.jpg
Figure 8. Software network 2003–2007 (FP6) (N = 1316).
Note: Red – Eastern Europe, blue – Northern Europe, white – Western Europe, green – Southern Europe, yellow – outside of Europe; circle – higher education and research organisations, square – private for-profit, triangle – public bodies, box – NGOs; node size – based on total normalised brokerage scores.
See high-resolution figure in colour online at
Figure 9. Software network 2007–2016 (FP7, H2020) (N=488).
Note: Red – Eastern Europe, blue – Northern Europe, white – Western Europe, green – Southern Europe, yellow – outside of Europe; circle – higher education and research organisations, square – private for-profit, triangle – public bodies, box – NGOs; node size – based on total normalised brokerage scores.
See high-resolution figure in colour online at
https://www.ies.ee/tjes/vol10/no1/kuttim/Figure09.jpg
Figure 10. Baltic States actors in software network 1995–2003 (FP7, H2020) (N = 86).
Note: Circle – higher education and research organisations, square – private for-profit, triangle – public bodies, box – NGOs; node size – based on total normalised bro-kerage scores.
See high-resolution figure in colour online at
Figure 11. Baltic States actors in software network 2003–2007 (FP7, H2020) (N = 104).
Note: Circle – higher education and research organisations, square – private for-profit, triangle – public bodies, box – NGOs; node size – based on total normalised bro-kerage scores.
See high-resolution figure in colour online at
https://www.ies.ee/tjes/vol10/no1/kuttim/Figure11.jpg
Figure 12. Baltic States actors in software network 2007–2016 (FP7, H2020) (N = 25).
Note: Circle – higher education and research organisations, square – private for-profit, triangle – public bodies, box – NGOs; node size – based on total normalised bro-kerage scores.
bodies and NGOs acted as brokers during the first two periods (FP4 and FP5; FP6). Only one enterprise from the Baltic States in the first period (FP4 and FP5) and six during the second period (FP6) brokered between other actors. The between-group comparison that was performed with the Kruskal-Wallis H test indicated that there was also in software a statistically significant difference in brokerage scores between the different organisation types for all four brokerage roles (i.e., coordinator, gatekeeper, consultant, liaison) during all three periods (Appendices 4–6). Unlike biotechnology, the mean brokerage score was at its highest for higher education and research organisations during the entire period of study. The post-hoc Tamhane T2 test revealed that universities and research organisations fulfilled all the brokerage roles more often than enterprises. They also acted more frequently as gatekeepers and liaisons than public bodies or NGOs during the first (FP4 and FP5) and second periods (FP6).
To summarise, software networks were dissimilar from biotechnology networks in that higher education and research organisations held the most strategic positions as brokers during all the three periods. Universities and research organisations also brokered more frequently within their own regions and across different regions, alike. Like with biotechnology, the share of enterprises among the brokers was lower than the proportion of enterprises in the network, especially during the first (FP4 and FP5) and third periods (FP7 and H2020) (Table 4).
5. Discussion
The present study revealed several differences between biotechnology and software networks. Overall, there were more software projects than biotechnology projects during the time period when organisations from the Baltic States participated (1995–2016). In addition, the number of actors and ties between those actors was higher in software projects. While participation started rather modestly in biotechnology, it was much more important in software. The second and third periods were similar in that participation peaked during FP6 and decreased sharply during FP7 and H2020. This can be attributed to the impact of economic crises and the increased share of infrastructural support measures for the Baltic States, both of which decreased the availability for self-financing in organisations and the means of participating in the R&D projects.
The study indicated that there were no significant differences between the biotechnology and software networks in terms of location, as the participation rate of actors from outside of Europe was rather low and the participation rate of actors from Western Europe was highest for both networks. This confirms the assumption by Asheim and Gertler (2005), who stated that the innovation process or industries with analytical and synthetic knowledge base are equally and spatially concentrated. By comparison, these findings contradict assertions from Coenen et al. (2006) and Herstad et al. (2014), who determined that networks with analytical knowledge bases were more spatially distributed and international. This can be explained by the nature of EU research projects. Indeed, while these projects are not formed upon evolutionary bases and focus on EU countries/actors, they must also adhere to strict qualification criteria and funding rules (Balland, 2012). Autant-Bernard et al. (2007) found that the impacts of proximity and network effects do exist at both the European and individual country level, as the actors are more likely to cooperate when they have already collaborated or when they are located closely in the network (i.e., they share close social proximity). The varied participation rates of actors from different countries can also be attributed to their distinct levels of economic development and the balance that individual European regions strike between public and private R&D (Blažek & Kadlec, 2019).
Different types of actors participated in the biotechnology and software networks. While higher education and research organisations dominated in biotechnology, the distribution of participation of organisations was less uneven in software, indicating that software firms contribute to R&D and the generation of new knowledge. In biotechnology, more universities fulfilled this role (Asheim & Coenen, 2005). The lower participation rates from biotechnology firms can also be attributed to other sectoral characteristics, since the industry is characterised by its high complexity, uncertainty and long product-service development timeframes (Connected Health, 2015). This partially confirms Salavisa et al.’s findings (2012), which argued that although biotechnology networks were more connected, centralised and clustered, software networks were considerably more fragmented and more often centred around enterprises.
While enterprises were active participants in the studied projects, the central brokerage roles were primarily adopted by education and research organisations for both biotechnology and software. This afforded them advantages, such as access to information, control over the flow of knowledge and the ability to join different parts of the network, and disadvantages,
such as the burden and responsibility to connect different segments of the network (Prell, 2012). Public bodies most frequently acted as brokers in biotechnology due to their direct involvement in the sector. Biotechnology is a field that originated in university labs, and has been supported substantially by governmental investments (Owen-Smith & Powell, 2004). The less central role of brokerage does not exclude enterprises from initiating research projects based on their needs or from assembling partners with the required competencies, as there were four such enterprises in software (but none in biotechnology) from the Baltic States.
Organisations can fulfil several brokerage roles—coordinator, gatekeeper, consultant and liaison—and can broker solely within their own regions or across several regions. Higher education and research organisations, and in addition, public bodies in biotechnology, have most often acted as gatekeepers, consultants and liaisons who broker between actors from various regions. This indicates that their networks have a higher geographical reach and confirms the importance of research organisations in acquiring technology from abroad to contribute to local capabilities (Chen et al., 2015). It also highlights the sector-specific role of public bodies as brokers in biotechnology. The centrality of higher education and research organisations in a small non-advanced country setting, which is often outside the major innovative clusters, implies that the gap between globally successful universities and global science is smaller than in the case of industry. Nonetheless, the strength of local science and the connectedness of international scientific networks also allows enterprises to access distant technological mechanisms (Fontes, 2005).
This study highlights the sectoral differences in brokerage as in biotechnology, in addition to higher education and research organisations, also public bodies were able to connect otherwise unconnected actors. This confirms that while the central brokerage roles of higher education and research organisations are often not sector-specific (Kauffeld-Monz & Fritsch, 2013; Kim et al., 2018), that of public bodies is, being characteristic of biotechnology.
6. Conclusions
This article aimed to further develop an understanding of the institutional and structural features of knowledge networks by relating the brokerage roles of actors to the organisational types and locations of biotechnology and software networks. Two research questions were posed: (1) what characterises the knowledge brokers of biotechnology and software networks in terms of organisational type and location; and (2) to what extent do the brokers who represent different organisational types fulfil different brokerage roles (i.e., coordinators, gatekeepers, consultants or liaisons)?
The study’s results indicated that while the geographical division of brokers corresponded to the overall proportion of actors from different regions, the division by organisational type did not. Higher education and research organisations were overrepresented as brokers in both sectors, public bodies were overrepresented in biotechnology and enterprises were underrepresented in both fields. This could mean that the enterprises that were analysed in this study acted less as the coordinators of projects and that the projects they led had fewer participants. Because it is costly, enterprises might therefore be interested in being participants only, rather than coordinators, in research projects that fall under their areas of expertise. They might also consider only pursuing problems that can be solved with specific R&D and that contribute to the development of their products and services regardless of sector. On the other hand, higher education and research organisations carry broader levels of expertise and may be interested in projects also for scientific reasons without direct or practical outcomes. Previous studies have determined that enterprises primarily develop an absorptive capacity within a fairly narrow sectoral setting, as university units often need to operate in a large number of distinct disciplinary and sectoral domains (Kenney & Patten, 2009). Because acquiring and using more distant knowledge requires a deliberate effort of creating absorptive capacity, the absorptive capacity itself is cumulative by nature and restricts the activities of enterprises to specific domains (Cohen & Levinthal, 1990).
This study’s results additionally revealed that higher education and research organisations, and in biotechnology also public bodies, tended to broker more frequently across different regions. Because project-based funding is important for research at universities and research institutions, and EU research projects can involve a large number of participants (e.g., 176 organisations in European Leukemianet; 142 in EGI-InSPIRE), higher
education and research organisations hold strategic positions within knowledge networks. The role that public bodies play is sector-specific, as biotechnology is dependent upon public sector investments. At the same time, enterprises vary in their capacity to build international connections. The costs of accessing and translating knowledge in global networks tend to be smaller for large, domestic and international companies and academic spin-out SMEs, than for established SMEs because of the effects of size in larger companies, specialisation and economies of scale in R&D (Fransman, 2008). It follows that the pool of enterprises capable of participating in global knowledge networks is limited. The EU projects represent a case where enterprises can benefit from universities’ wider participation, but as project coordinators, the different types of organisations also compete for limited research funding.
This study contributed to the theoretical, empirical and practical analysis of sectoral knowledge networks. First, it developed further the understanding of the institutional and structural features of knowledge networks by focusing on brokers and their brokerage roles. It then related these to specific organisation types and the actors’ locations within the two studied sectors. The results indicated that brokers in the EU research projects, where organisations from the Baltic States participated, were primarily located in Western and Northern Europe and contained greater numbers of higher education and research organisations and public bodies in networks with analytical knowledge bases (biotechnology). In networks with synthetic knowledge bases (software), the brokers most frequently originated in Western and Southern Europe and primarily included higher education and research organisations. The study also revealed that higher education and research organisations, in addition to public bodies in relation to biotechnology, had greater geographical reach, as they brokered more frequently between organisations from different regions than the other types of actors.
Second, the paper included additional empirical context to the study of sectoral knowledge networks, by looking at research projects in biotechnology and software where Baltic actors have participated. It explored the evolution of knowledge networks and actors who were initially at a disadvantage regarding older Member States, with a longer period of participation in EU research projects.
Third, the study provided information for organisations applying for EU research projects. The results illustrated the benefits of collaborating
with higher education and research organisations for local enterprises, in addition to the benefits of teaming with public bodies for biotechnology networks, by increasing access to the flow of knowledge through the expansion of geographical reach. With the assistance of more well-connected organisations, enterprises can also broaden their access to international flow of knowledge.
Future studies might focus on developing these data into a 2-mode network, connecting actors to projects and projects to specific funding periods (from FP4 to H2020) that could enable the dynamics of actors’ participation over time to be assessed. This would allow researchers to monitor the extent to which the same actors have participated in different projects during the same and over consecutive periods. Subsequent studies could also combine social network analysis with qualitative interviews to better understand the reasons behind the networking patterns that have been observed in collaborative research projects of biotechnology and software.
Acknowledgement
The publication of this paper is supported by the ASTRA “TTÜ arenguprogramm aastateks 2016–2022” Doctoral School in Economics and Innovation, project code: 2014-2020.4.01.16-0032.
Merle Küttim is a researcher and PhD student at Tallinn University of
Technology, Estonia. She obtained her master’s degree from the University of Tartu (European studies). Her research interests include university-industry cooperation, knowledge transfer, knowledge networks, commercialisation, intellectual property regimes, entrepreneurial ecosystem, entrepreneurial opportunity recognition and entrepreneurial activity of the population and sub-groups.
Aino Kiis is a project specialist at Tallinn University of Technology,
Estonia. She has obtained her master’s degree from Tallinn University (social work). Her research interests include social policy and social welfare, coping and support of the elderly, and economic fluctuations in transition countries. She has supervised numerous master’s theses at Tallinn University and taught classes on research methods. She also has practical experience of being responsible at the Ministry of Education and Research for disseminating information concerning EU structural funds.
Cristina Sousa is an assistant professor at Universidade Portucalense
(UPT) and director and researcher at REMIT – Research on Economics, Management and Information Technologies. She is also a researcher at Dinâmia’CET-IUL (Instituto Universitário de Lisboa – ISCTE-IUL). She has a master’s degree in Economics and Management of Science and Technology and a PhD in Economics, both from ISEG/UTL (Portugal). Her research interests include innovation processes and their socio-economic effects, the creation and circulation of knowledge, namely the dynamics of knowledge and innovation networks, entrepreneurship, and the transition to sustainable systems.
References
Asheim, B. (2007), ‘Differentiated knowledge band varieties of regional
innovation systems,’ Innovation, vol. 20, no. 3, pp. 223–241. https://doi.org/10.1080/13511610701722846
Asheim, B. T.; Boschma, R. & Cooke, P. (2011), ‘Constructing regional
advantage: platform policies based on related variety and differentiated knowledge bases,’ Regional Studies, vol. 45, no. 7, pp. 893–904. https://doi.org/10.1080/00343404.2010.543126
Asheim, B. T. & Coenen, L. (2005), ‘Knowledge base and regional innovation
systems: Comparing Nordic clusters,’ Research Policy, vol. 34, no. 8, pp. 1173-1190. https://doi.org/10.1016/j.respol.2005.03.013
Asheim, B.; Coenen, L. & Vang, J. (2007), ‘Face-to-face, buzz, and
knowledge base: sociospatial implications for learning, innovation, and innovation policy,’ Environment and Planning C: Government and Policy, vol. 25, no. 5, pp. 655-670. https://doi.org/10.1068/c0648
Asheim, B. T. & Gertler, M. S. (2005), ‘The geography of innovation:
regional innovation systems,’ in J. Fagerberg, D. C. Mowery & R. R. Nelson (eds.) The Oxford Handbook of Innovation, Oxford: Oxford University Press, pp. 291–317.
https://doi.org/10.1093/oxfordhb/9780199286805.003.0011
Autant-Bernard, C.; Billand, P.; Frachisse, D. & Massard, N. (2007), ‘Social
distance versus spatial distance in R&D cooperation: empirical evidence from European collaboration choices in Micro and Nanotechnologies,’
Papers in Regional Science, vol. 86, no. 3, pp. 495–519.
https://doi.org/10.1111/j.1435-5957.2007.00132.x
Balachandran, S. & Hernandez, E. (2018), ‘Networks and innovation:
in brokerage triads,’ Organization Science, vol. 29, no. 1, pp. 80–99. https://doi.org/10.1287/orsc.2017.1165
Balland, P. A. (2012), ‘Proximity and the evolution of collaboration networks:
evidence from research and development projects within the Global Navigation Satellite System (GNSS) industry,’ Regional Studies, vol. 46, no. 6, pp. 741-756. https://doi.org/10.1080/00343404.2010.529121
Blažek, J. & Kadlec, V. (2019), ‘Knowledge bases, R&D structure and
socio-economic and innovation performance of European regions,’ Innovation:
The European Journal of Social Science Research, vol. 32, no. 1,
pp. 26–47. https://doi.org/10.1080/13511610.2018.1491000
Borgatti, S. P. (2002), NetDraw: Graph visualization software, Harvard, MA:
Analytic Technologies.
Boschma, R. (2005), ‘Proximity and innovation: a critical assessment,’ Regional Studies, vol. 39, no. 1, pp. 61-74.
https://doi.org/10.1080/0034340052000320887
Boschma, R. (2018), ‘A concise history of the knowledge base literature:
challenging questions for future research,’ in A. Isaksen, R. Martin & M. Trippl (eds.) New Avenues for Regional Innovation Systems -
Theoretical Advances, Empirical Cases and Policy Lesson, Cham: Springer,
pp. 23–40. https://doi.org/10.1007/978-3-319-71661-9_2
Chen, S. H., Egbetokun, A. A. & Chen, D. K. (2015), ‘Brokering
knowledge in networks: institutional intermediaries in the Taiwanese biopharmaceutical innovation system,’ International Journal
of Technology Management, vol. 69, no. 3/4, pp. 189–209.
https://doi.org/10.1504/IJTM.2015.072978
CIP (2015), Competitiveness and Innovation Framework Programme, 2007– 2013. Retrieved from http://ec.europa.eu/cip/ [accessed 11 Apr 2020]
Coenen, L.; Moodysson, J.; Ryan, C. D.; Asheim, B. R. & Phillips, P.
(2006), ‘Comparing a pharmaceutical and an agro-food bioregion: on the importance of knowledge base for socio-spatial patterns of innovation,’
Industry and Innovation, vol. 13, no. 4, pp. 393–414. https://doi.
org/10.1080/13662710601032937
Cohen, W. M. & Levinthal, D. A. (1990), ‘Absorptive capacity: a new
perspective on learning and innovation,’ Administrative Science Quarterly, vol. 35, no. 1, pp. 128–152. https://doi.org/10.2307/2393553
Connected Health (2015) Connected Health cluster strategy 2015–2020, Tehnopol, European Connected Health Alliance. Retrieved from https:// www.tehnopol.ee/wp-content/uploads/2016/01/Connected-Health-klastri-strateegia.pdf [accessed 12 April 2018]
CORDIS (2020), Community Research and Development Information Service [Home page]. Retrieved from http://cordis.europa.eu/ [accessed 11 April 2020]
DiMaggio, P. J., & Powell, W. W. ([1983] 1991), ‘The Iron Cage revisited:
Institutional isomorphism and collective rationality in organizational fields,’ in W. W. Powell & P. J. DiMaggio (eds.) The New Institutionalism
in Organizational Analysis, Chicago, London: The University of Chicago
Press, pp. 63–82. https://doi.org/10.2307/2095101
Eder, J. (2019), ‘Innovation in the periphery: a critical survey and research
agenda,’ International Regional Science Review, vol. 42, no. 2, pp. 119–146. https://doi.org/10.1177/0160017618764279
European Commission (2016), Strategic Plan 2016–2020, Directorate-General for Research and Innovation, Ares(2016)1051529, 1.3.2016. Retrieved from https://ec.europa.eu/info/publications/strategic-plan-2016-2020-research-and-innovation_en [accessed 10 January 2020]
European Innovation Scoreboard (2019), ‘Main Report.’ Retrieved from https://ec.europa.eu/docsroom/documents/38781 [accessed 10 April 2020]
Fontes, M. (2005), ‘Distant networking: the knowledge acquisition strategies
of ‘out-cluster’ biotechnology firms,’ European Planning Studies, vol. 13, no. 6, pp. 899-920. https://doi.org/10.1080/09654310500188498
Fransman, M. (2008), ‘Disaggregating firms in analysing the costs
and benefits of the university–industry relationship: based on an analytical and empirical study from Scotland,’ Economics of Innovation
and New Technology, vol. 17, nos. 1–2, pp. 123–136. https://doi.
org/10.1080/10438590701279490
Fritsch, M. & Kauffeld-Monz, M. (2010), ‘The impact of network structure
on knowledge transfer: an application of social network analysis in the context of regional innovation networks,’ The Annals of Regional Science, vol. 44, no. 1, pp. 21–38. https://doi.org/10.1007/s00168-008-0245-8
Gould, R. V. & Fernandez, R. M. (1989), ‘Structures of mediation: a
formal approach to brokerage in transaction networks,’ Sociological
Methodology, vol. 19, pp. 89–126. https://doi.org/10.2307/270949 Granovetter, M. S. (1973), ‘The strength of weak ties,’ American Journal of
Sociology, vol. 78, no. 6, pp. 1360–1380. https://doi.org/10.1086/225469 Hanneman, R. A. & Riddle, M. (2005), Introduction to Social Network
Methods, Riverside: University of California.
Hargadon, A. & Sutton, R. I. (1997), ‘Technology brokering and innovation
in a product development firm,’ Administrative Science Quarterly, vol. 42, no. 4, pp. 716–749. https://doi.org/10.2307/2393655