RBRH, Porto Alegre, v. 23, e31, 2018 Scientific/Technical Article
https://doi.org/10.1590/2318-0331.231820170123
Combination of the SCS-CN and the GRADEX models to maximum flow estimation
Combinação dos métodos SCS-CN e GRADEX para cálculo de vazões máximas
Tainá Mota1,2, Mauro Naghettini1, Wilson Fernandes1 and Francisco Silva1
1Universidade Federal de Minas Gerais, Belo Horizonte, MG, Brasil
2Câmara de Comercialização de Energia Elétrica, São Paulo, SP, Brasil
E-mails: tainamota@uol.com.br (TM), mauro.naghettini@gmail.com (MN), wilson@ehr.ufmg.br (WF), fsilva@ehr.ufmg.br (FS)
Received: August 07, 2017 - Revised: April 27, 2018 - Accepted: June 04, 2018
ABSTRACT
The absence of hydrometric monitoring of adequate extension, periodicity, temporal resolution and quality is the Brazilian reality in many drainage basins. It’s common the use of rainfall-runoff models of simple application to determine rainfall excess volumes, such as the SCS-CN method. Although the SCS method is broadly accepted, many authors have questioned the results derived from its application to catchments with distinct characteristics than those studied during its original formulation. An alternate method for
maximum flow estimation in catchments with scarce monitoring is the GRADEX method, which proposes extrapolation of the flood volumes’ frequency curve from precipitation series. Despite being a consolidated method, it is rarely used in Brazil because of the difficulties found in fulfilling its initial hypotheses. This paper suggests, therefore, the combination of both methods, aiming for a methodology that better describes the uncertainties involved in the determination of the direct flood volumes’ probability distribution.
The case study is conducted on the Serra Azul river catchment, Juatuba – MG, which offers 12 years of continuous records. The referred
combination occurs on the definition of the lower and upper boundaries of the probability distribution of global water retention in the soil and in the catchment, as embedded in the GRADEX method, from the CNASYMPTOTIC concept. The modelled scenarios bear
evidence of the many possibilities that may exist in the extrapolation of the frequency curve of surface runoff volumes suggests
a range of results that better underpins the definition of the saturation condition and, consequently, the maximum rainfall excess
calculation, as compared to the originally proposed methods.
Keywords: SCS-CN method; GRADEX method; Probability distribution; Maximum flow-rate.
RESUMO
A ausência de monitoramento hidrométrico com extensão, periodicidade, resolução temporal e qualidade adequadas é a realidade brasileira
em muitas bacias hidrográficas. Assim, a determinação de volumes de cheia comumente ocorre a partir de modelos chuva-vazão de
simples aplicação, tal como o método SCS-CN. Embora o modelo SCS seja largamente aceito, diversos autores têm questionado os resultados de sua aplicação em bacias com características distintas daquelas estudadas originalmente. Uma alternativa para cálculo das
vazões máximas em bacias com escasso monitoramento fluviométrico é o método GRADEX, que propõe a extrapolação da curva
de frequência dos volumes de cheia a partir de séries de precipitação. Apesar de consolidado, é pouco aplicado no Brasil devido às
dificuldades encontradas na resolução de suas hipóteses iniciais. Este artigo sugere, portanto, a combinação de ambos os métodos,
visando uma metodologia que reduza as incertezas envolvidas na determinação da distribuição de probabilidades de volumes de
cheias. O estudo de caso é realizado na bacia hidrográfica do ribeirão Serra Azul, Juatuba - MG, que dispõe de 12 anos de registros contínuos. A referida combinação ocorre na definição dos limites inferior e superior da distribuição de probabilidades da retenção global de água no solo e na bacia, variáveis do método GRADEX, a partir do conceito do CNASSINTÓTICO. Os cenários modelados
evidenciam as diversas possibilidades existentes na extrapolação dos volumes de escoamento superficial, dispondo-se de uma faixa de resultados que melhor embasam a definição da condição de saturação da bacia e, consequentemente, o cálculo das vazões máximas,
comparativamente aos métodos originais.
INTRODUCTION
The study of maximum flows is necessary for floodplains’
protection, hydraulic structures designing, setting of reservoir
flood control volumes, among other essential goals to social and
economic development on a sustainable basis. In this context,
maximum flow estimation has been an ever-present problem in engineering. The maximum flood values of interest are usually much greater than the discharges sampled in regular flow records. Therefore, a flood flow frequency analysis, based upon short
samples of systematic data, may lead to unrealistic estimates of the exceedance probabilities and related extreme quantiles.
Faced with such a difficulty, and with the knowledge
that rainfall gauging stations are, usually, more numerous, with
longer series and more readily regionalized than flow series, the
hydrologist may proceed in two different ways: either by applying methods that incorporate hydrometeorologic information into
flood frequency analyses or by applying hydrological models that transform design rainfall rates into design flows.
Among the former methods, the GRADEX – Gradient of Extreme Values method stands out, as originally described by Guillot and Duband (1967) and developed by the energy company Electricité de France. According to Naghettini, Potter and Illangasekare
(1996), the goal of the GRADEX method is to extrapolate the flood volumes’ frequency curve from rainfall volumes, based on two initial hypotheses. The first posits that, in saturated
conditions, any increase of rainfall volume over the catchment
tends to produce an equal increase in flow volume. The second
suggests that the probability distribution of rainfall volumes has an exponentially decaying upper tail. As it shall be seen later in
this paper, a difficulty that arises in the rigorous application of the GRADEX method refers to the estimation of the translation
distance (r0) between the rainfall and flood volumes frequency curves, which is a function of the gradex parameter (a) and the probability distribution of the global water retention in the soil and the catchment, hR(r).
In parallel, there are hydrological models that aim to
transform rainfall rates into flows through the effective rainfall
volume calculation and its temporal distribution by a transfer function. In this context, the method developed by the SCS – Soil Conservation Service (current NRCS – Natural Resources Conservations Service) has been the most often applied in design
flood estimation. Its main parameter, the CN (Curve Number), depends on the soil hydrological classification, the Antecedent
Runoff Condition (ARC) and on land use and soil management. In ungauged or poorly gauged catchments, the transfer function usually applied on hydrograph synthesis is the SCS’ synthetic unitary hydrograph. The function’s entry variables are the rainfall discretization interval, basin response time and catchment area.
Despite its ease of application, case studies and technical analyses
have reported errors resulting from model’s direct application in conditions that are diverse from those originally recommended. Cunha et al. (2015) report a case study in a Brazilian drainage basin, comparing observed rainfall excess to those predicted by the SCS-CN method and reinforce the suspicions that the method may lead to oversized hydraulic structures.
Considering the SCS-CN’s limitations, the difficulties arising from the GRADEX application and the need to reduce
the uncertainties involved in the process of flood estimation,
this paper proposes an association between both methods.
Specifically, this paper’s objectives are: (i) to check the apparent
analogy between these methods in regards to their respective
base premises, initial hypotheses and parameters; (ii) to define the
probability distribution of the retention R, as introduced in the
GRADEX method, and its upper and lower limits, in association
with the conceptual structure of the SCS-CN method, along with the required adaptations; (iii) to apply the proposed association to
the Serra Azul river catchment, with 12 years of continuous flow data and up to 26 years of rainfall data; and (iv) extract conclusions
about the applicability of the proposed association.
THE GRADEX METHOD
Consider Pi as the maximum rainfall depth, for a given duration d, over a catchment, as abstracted in a given month, season or year. The duration d is usually specified as the average base time of the catchment, as estimated from observed hydrographs. Consider also that the runoff volume associated to Pi, for the same duration d, is denoted by Xi and that Ri represents the
runoff deficit. In other words, Ri = Pi – Xi, assuming that such variables are expressed in the same volume units. Figure 1 depicts a schematic chart of the relation between P and X, in which all points (Pi, Xi), concerning a set of occurrences indexed by i, are located under the bisecting line X = P, except for a few relatively low values of X which have been affected by snowmelt. As made explicit by Guillot and Duband (1967), the retention value R is associated with complex and interdependent factors, such as the antecedent runoff conditions, the groundwater storage capacity and the spatial-temporal distribution of rainfall over the catchment.
Therefore, the GRADEX method considers R as a random variable with a probability distribution conditioned to the precipitation P, characterized on Figure 1 as hypothetical quantile curves.
The GRADEX method first hypothesis establishes that
this quantile curve tends to be parallel to the X = P line as the basin soil approaches a saturated condition. The starting position
Figure 1. Schematic relationship between storm rainfall (P) and
flood volume (X). Source: Adapted from Naghettini, Potter and
of this asymptotic trend for each curve depends on the initial soil moisture conditions. Therefore, the cumulative probability distribution of R, conditioned on P, tends to have a stable form and a constant variance for P > P0.
Still on Figure 1, the region defined by the points (Pi, Xi) may
be divided in two domains, as follows: (i) D1 domain, defined by the
P < P0 and X ≤ X0 points, for which the probability distribution of R is conditioned on P and can be estimated from the observed
data; and (ii) D2 domain, of extrapolations, in that all curves that associate X and P are parallel to the bisecting line X = P.
Let f(p), g(x) and h(r) be the probability density functions of P, X and R, respectively. The density function of X is given by:
( ) ( ) X R( )
0
g x =∞∫f x r h+ + r dr (1)
where hX+R(r) is the probability density function of R, conditioned on the variable (P = X + R). In the D2 domain, it is assumed that
the distribution of R is no longer dependent on P, i.e., hX+R(r) becomes h(r) and Equation 1 can be rewritten as
( ) ( ) ( )
0
g x =∞∫f x r h r dr+ (2)
The second hypothesis of the GRADEX method refers
to the upper tail of the cumulative distribution function F(p), which is assumed to approach asymptotically an exponential tail, as per the equation
( ) x r K
1 F x r exp a + − − + = − (3)
in which the location parameter K is a positive constant and the scale parameter a is the gradex rainfall parameter. In this case, the density function f(p) becomes:
( ) 1 x r K ( ) r
f x r exp f x exp
a a a
+ −
+ = − = −
(4)
Substituting this result in Equation 2, it follows that
( ) ( ) ( )
0 r
g x f x exp h r dr a ∞
= −
∫ (5)
In this expression, the integral is definite and equal to a
positive constant less than or equal to 1. Assuming, for mathematical convenience, that this constant is equal to exp(-r0/a), Equation 5 becomes:
( ) ( 0)
g x =f x r+ (6)
Therefore, the probability density function g(x) in the
D2 domain can be derived from f(p) by a simple translation of the quantity r0, on the variable axis, which is also valid to the distribution functions G(x) and F(p).
For the translation distance r0, the integral in Equation 5 represents the expected value of exp(-R/a). As a result, we have:
. 0
R
r a ln E exp a
=− −
(7)
The distance r0 is referred by Duband et al. (1988) as a “practical limit” for R. In practice, Guillot and Duband (1967) recommend using the empirical distribution of the observed
maximum runoff volumes (annual or seasonal) up to a return period of 10 to 20 years for relatively impermeable basins and up
to 50 years for basins with a greater infiltration capacity. From this
point onwards, the cumulative probability distributions of rainfall
and flood volumes are separated by a translation distance r0. Stemming from the mathematical properties of the exponential
distribution, in the D2 domain, both distributions will plot on an
exponential probability paper as straight lines, both with slope equal to the gradex parameter a. As such, application of the GRADEX method depends mostly on the estimation of parameter a.
The validity of Equation 6 is conditioned to the premise
that the upper tail of the rainfall volumes distribution is of the exponential kind, and not just to the premise that the retention R and rainfall P are independent for P > P0. CTGREF (1972)
justifies this assertion by equalling Equations 2 and 6, so that:
( 0) ( ) ( )
0
f x r+ =∞∫f x r h r dr+ (8)
Denoting (x + r0) by τ, replacing it on Equation 8 and rearranging the terms, we have:
( )
( ) 0 ( )
0
f r r
h r dr 1 f τ τ ∞ + − = ∫ (9)
Differentiating with respect to τ, it follows that:
( )
( ) 0 ( )
0
f r r
d h r dr 0
d f τ τ τ ∞ + − =
∫ (10)
The f(τ+r-r0)/f(τ) ratio must be constant with respect to τ to ensure the validity of Equation 10. The functions that exhibit such property are the exponential functions of the form A exp(Bτ), being A and B constants. As a result, f(p) and g(x) must be exponential functions. Among the probability distributions that exhibit an exponential upper tail are the Normal, Log-Normal, Gamma, Gumbel (NAGHETTINI; POTTER; ILLANGASEKARE,
1996) and TCEV, added by Fernandes and Naghettini (2008). The proof that some of these distributions, such as the Gumbel model, tend asymptotically to an exponential tail as the variable
tends to infinity may be performed by their respective expansion
into Taylor series.
Originally, the GRADEX method recommends the fitting
of the Gumbel probability distribution to the maximum rainfall events. Guillot and Duband (1967) and CTGREF (1972) advocate the use of the Gumbel model for such a purpose, on the basis of extensive studies performed in France, US, South Africa, Australia and Israel, reporting that rainfall data at a considerable number of gauging stations follow the referred distribution. Studies conducted by Costa and Fernandes (2015) indicate that
the Gumbel distribution also proved itself the best fit parametric form to model flows and extreme precipitations in Brazil.
Lastly, in application of the method, the influence of
the choice of the duration d in the results must be carefully considered. The time interval choice is fundamental and must be judiciously made, for the gradex parameter varies with this
duration. If the durations of the rainfall and flood events are significantly distinct, the relation between precipitated and runoff
(or base time, in some cases) of the observed flood hydrographs. CTGREF (1972) reports to be impossible to find a duration that rigorously satisfies the equivalence between volumes, under all
conditions. However, the method seeks to relate the frequencies of maximum rainfall and runoff volumes in a given time interval, not being necessary that the maximum runoff value is caused by the maximum rainfall value, since runoff depends, mostly, on the previous soil moisture conditions.
THE SCS-CN METHOD
The Curve Number (CN) method, developed by the U.S.
Department of Agriculture (USDA) Soil Conservation Service (SCS), current NRCS, had its first version published in 1954 in the
National Engineering Handbook Section 4: Hydrology (NEH-4). This publication has been revised since, but the proposed technique
has not been significantly altered.
Let, again, P be the total rainfall volume in a given drainage basin and X represent the runoff volume. Consider further that the initial abstraction, represented by the storage in
depressions, interception and incipient infiltration, are denoted
by Ia, that F represents the maximum infiltration volume and that S is the maximum potential retention. The SCS-CN method consists of the water balance in the catchment and is based upon two fundamental hypotheses that can be expressed as follows:
a
P=I + +F X (11)
a
X F
P−I =S (12)
By combining Equation 11 and 12, we have the general formula for the SCS-CN method’s runoff:
X=0, for P ≤ Ia (13)
The maximum potential retention (S), also named storage index or maximum potential losses, is then transformed into the CN by means of an arbitrary identity. CN varies from 0 to 100, as corresponding to S = ∞ and S = 0, respectively. Equation 14,
as given in SI units, identifies this transformation proposed by
the method.
25400
S 254
CN
= − (14)
The value of CN depends on antecedent moisture conditions, on the use, management and coverage of the soil and its respective
hydrological classification, and it is calculated in accordance to
tables available on NEH (NRCS, 2004).
The SCS-CN method was developed from studies on small rural basins in the US Midwest, but has been applied to basins with different physical characteristics, very distinct from the originals. Among the studies on the subject, Mishra, Pandey and Singh (2012) justify the Journal of Hydrologic Engineering special issue, by questioning the method’s limitation and credibility, whilst highlighting that its popularity is due to its simplicity, stability and ease of understanding and application. Ponce and Hawkins
(1996) also report that the above rainfall-runoff model is widely
accepted due the authority of its institution of origin and because of the limited number of entry parameters demanded. According to the referred authors, the greatest uncertainties are due to the consideration of the effect of the rainfall intensity and spatial scale effects, the high sensibility to changes in the CN value and its ambiguity in relation to the antecedent humidity conditions.
Chow, Maidment and Mays (1988), Hjelmfelt Junior (1991),
Hawkins (1993), Mullem et al. (2002), Mishra, Suresh Babu and Singh (2007), Tedela et al. (2012) and Bartlett et al. (2016) are some of the authors that also question the method’s results.
Those critiques and limitations motivates modified versions of the original formulation over the years. One of these
modifications refers to the CN calibration proposed by Hawkins
(1993), named Asymptotic Fitting method. In it, from monitored rainfall-runoff pairs (Pi, Xi), the author identified that CN varies with rainfall depth, and described three possible behaviours: (i) standard behaviour, more often observed, in which CN shows a decline with the increase of rainfall depths, approaching an asymptotic value for high rainfall depths (Figure 2a); (ii) complacent behaviour, in which CN declines continuously with the increase of rainfall depth, with no approximation of a constant value, as indicated in Figure 2b; and (iii) abrupt behaviour, less common amongst observed data, in which the CN value increases abruptly and approaches a constant value for greater depths, illustrated in Figure 2c.
In the cases of standard and abrupt behaviour, Hawkins
(1993) adjusted asymptotic equations to approach the limiting value of CN, as determined in regression analysis.
METHODOLOGY
Having presented the GRADEX and SCS-CN methods
as examples of methods that aggregate, in distinct ways,
hydrometeorological information into flood estimation, their
respective limitations restricting their widespread usage stand out. Thus, it is proposed a combination of both methods to develop a new methodology, that is of easier application and that reduces
the uncertainties associated to the flood volumes determination.
Analogy between SCS-CN and GRADEX methods
The combination of the methods must be justified first by their conceptual analogy. As previously presented, the GRADEX
method is based on the following hypotheses: (i) in saturated condition, any increase on the precipitation volume tends to produce an equal increase in the runoff volume; and (ii) the upper tail of the precipitation P volumes’ distribution has an exponential decay.
The SCS-CN method doesn’t make any probabilistic analysis about the rainfall distribution and, therefore, there are no considerations to be made about hypothesis (ii). In relation to hypothesis (i), SCS-CN considers the proportion between direct runoff X and precipitation P for large volumes, indicated in Equation 12. Assuming a rainfall increase of ∆P when the catchment is completely saturated, and substituting F by P – Ia – X, we have:
X X P P Ia X X
P P Ia S
+ ∆ = + ∆ − − − ∆
As Ia and S are constants, an equivalence between ∆X and ∆P is necessary to ensure that Equation 15 is valid and that the ratio
is maintained. Such a conclusion agrees with the GRADEX’s first hypothesis, thus allowing the conceptual analogy between
both methods and justifying their association as proposed herein.
Global water retention in the soil and the basin
Retention in the SCS-CN method, denoted by S, refers
to the continual infiltration losses and is dependent on the initial
soil moisture conditions in the catchment. There are also losses related to the initial abstractions, denoted by Ia. Therefore, total losses, here represented by R, are given by R = S + Ia. This equals to R = P - X and, therefore, is analogous to the notion utilized on
the GRADEX method. The difference lies on the fact that, in the GRADEX method, the retention R is treated as a random variable,
such that, in the D1 domain, the probability distribution of R is conditioned on P and, in the D2 domain, all curves associating
X and P are parallel do the bisecting line X = P.
The domain D2 is of greater interest, in order to extrapolate
the distribution of flood volumes X and to obtain its upper tail from the distribution of rainfall volumes P. In this domain, through
GRADEX method and from Equation 7, it can be proved that, if
the probability density function of the global water retention in
the catchment, hR(r), is known, the translation distance between
the frequency curves of flood and rainfall volumes is given by Equation 16:
( )
. .
max
min
r
0 R
r
r
r a ln h r exp dr
a
= − −
∫
(16)
where a is the gradex parameter and rmin and rmax are the minimum and maximum values of the retention R, respectively.
It is proposed here that the definition of the retention’s
probabilities distribution (rmin and rmax) should be made from the observed data of isolated events which represent maximum rainfall and runoff volumes. To better illustrate the proposed methodology, a case study is presented next.
Study area
As this is the first application of the methodology and the association of the SCS-CN and GRADEX methods, the choice of
a case study has focused on catchments for which continuous and reliable data were available. As per this criterion, it was selected the Juatuba River Representative Basin (Bacia Representativa de Juatuba), installed by the former Brazilian water regulation agency
DNAEE in the early 70’s, and so named because it presents
characteristics that are prevalent over a vast region situated in the center of the Minas Gerais state, such as typical vegetation, geology and orography (DNAEE, 1986).
For the specific application described herein, the Serra Azul
river catchment at the recording gauging station of Jardim (code 40511100) has been selected. Its drainage area is of 113 km2 and is
graphically depicted in Figure 3. According to Cunha et al. (2015), the catchment terrain varies from undulated to steep, with an
average slope of 14.6% and a maximum of 82.1%. The longitudinal
section obtained from topographic charts in the 1:50,000 scale
shows a total elevation drop of 412.9 m and an equivalent slope of 0.65%, over the 22.4 km length of the Serra Azul river.
In addition to flow data at the Jardim gauging station
(40511100), rainfall data at the recording gauging stations of Alto
da Boa Vista (2044021), Fazenda Laranjeiras (2044041), Jardim
(2044052) and Serra Azul (2044054) were employed. The mean areal rainfall over the catchment was estimated through the Thiessen polygons method. These procedures produced samples of around 12 years of continuous hourly data, encompassing the
period from 08/jan/1997 to 28/may/2008.
On the map of Figure 4 the mentioned gauging stations
are identified and pinpointed inside the catchment.
Association between the SCS-CN and GRADEX
methods
In this step of the case study, 77 maximum events which represent a causal relationship between rainfall and runoff were selected, with a duration d equal to the average base time of the observed hydrographs, estimated as 28 hours. Generally, there are events with total rainfall depths between 15 and 88 mm, representing diverse situations as far as the runoff responses are concerned.
For the analysis of complex rainfall-flood events be
meaningful from a hydrologic viewpoint, a careful separation of distinguishable episodes was carried out. Being an often times
subjective stage, the distinct rainfall episodes were identified based on the assumption they should be apart in time by, at least, 6 hours
without any precipitation. Furthermore, the criteria given in Linsley
Junior, Kohler and Paulhus (1975) helped in understanding the
flood hydrograph separation points, as associated with complex
rainfall events.
On situations in which missing data were observed, possible record errors or high rainfall depths not followed by
commensurate flow responses were disregarded during events
analysis. In Figure 5 the (Pi, Xi) pairs of the 77 selected events are depicted, for the common duration of 28 hours.
Figure 4. Location of the stations accounted for in the case study.
Figure 5. (Pi, Xi) points of the 77 selected events in the Serra Azul river catchment at Jardim.
For each event, selected as previously described, the retention Ri = Pi – Xi was calculated. As the GRADEX method is applicable for large rainfall depths and the actual interest is in the
D2 domain, a screening of these 77 events was necessary. For this, the calculation steps described by Zuffo (1993) were followed, in which the annual maximums are selected as representative
events. Amongst these, the ones with the largest annual runoff
values, occurring between the hydrological years 1996/1997 and
2007/2008, were utilized. The annual maximum surface volumes
varied between 2.0 and 6.7 mm in those 12 events and occurred, mainly, in the months of December and January.
In this way, it is assumed that the smallest retention value calculated for the observed annual maxima is equivalent to the lower limit rmin. For the upper limit, rmax, it is proposed the association
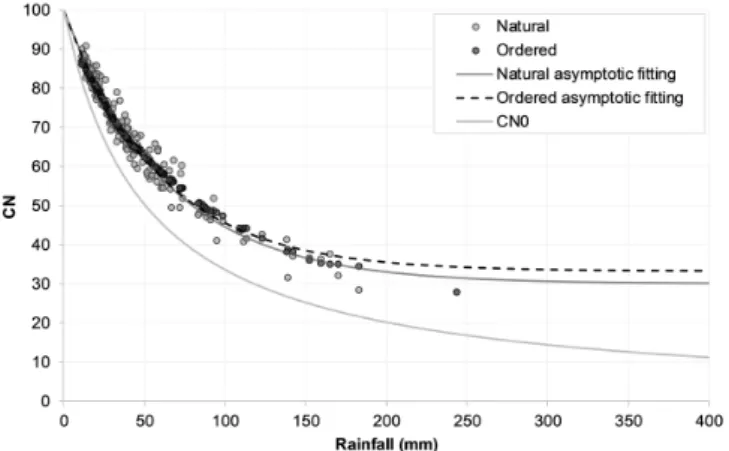
with the SCS-CN method and the CN behaviour as typified by Hawkins (1993). Cunha et al. (2015), after analysing the observed records, concluded that the Serra Azul river catchment at Jardim presents a standard behaviour, such as indicated in Figure 6,
obtained from 190 events. In such a case, for large rainfall volumes
P, the CN value tends to an asymptotic value, here designated as CNASYMPTOTIC. According to the referred authors, the CNASYMPTOTIC in the basin is estimated as 30.0, when the naturally selected (Pi, Xi) pairs are considered, and as 33.2 for ranked events. In Figure 6, the grey line, named CN0, is the threshold of runoff at the rainfall depth, or where P = 0.2S, and is given by the equation CN0 = 100/(1 + P/2) (HAWKINS, 1993).
max
ASYMPTOTIC
25400
r 254
CN
= − (17)
Once the retention limits (rmin and rmax) have been estimated,
the difficulty of prescribing the unconditional probability distribution
of the retention R remains. The uncertainty about the shape of hR(r) suggests the fitting of distinct distributions, defined between the minimum and maximum retention values.
Estimation of the gradex parameter and the
probability distribution of flood volumes
As previously shown, one needs to fit a probability distribution
with an asymptotically exponential upper tail to the annual rainfall maxima to calculate the gradex parameter and then estimate the
probability distribution of flood volumes. Originally, the GRADEX
method suggests that the advantages of its application only exist
when the precipitation series is longer than the flow series, so that the extrapolation is justifiable.
As the four rainfall gauging stations (Figure 4 and Table 1) do not cover the same data period and have missing records, it
would be necessary to fill the gaps and extend their data beyond
a common period, such that Thiessen polygons could be applied.
However, it requires operations that proved to be artificial and
unrepresentative, especially for dealing with continuous hourly data. Given the impossibility of calculating mean precipitation in all years, an alternative was to utilize the station with the largest number of hourly records (Jardim – 2044052, that has
26 hydrological years). Comparing its precipitated totals in years without significant missing records with those obtained through
Thiessen polygons, the values were close to each other and coherent with the dynamics of the monitored water levels in the basin. In this case, it’s assumed that Jardim is the most representative rainfall gauging station of the local pluvial regime.
Hawkins, Hjelmfelt Junior and Zevenbergen (1985) recommend that the selection of extreme events should follow the relation P/S > 0.456, with S defined for the antecedent runoff condition (ARC) II presented by the current NRCS method. According to Cunha et al. (2015), the average CN in the Serra Azul river catchment at Jardim, obtained by weighting the values tabulated
by NRCS (2004), is equal to 65.24. Thus, by applying Equation 14, the maximum retention S is 135.3 mm, and the minimum total precipitation to be considered, per Hawkins, Hjelmfelt Junior
and Zevenbergen (1985), would be P > 61.7 mm. The maximum annual rainfall depths recorded at the Jardim gauging station, with d = 28 hours, vary between 67 mm and 141 mm, thus complying with the guidance given by the referred authors.
The quantiles associated with the return periods of
interest were, then, calculated by fitting the theoretical probability distributions to the chosen 26-year sample. Among the theoretical
distributions that exhibit an exponential upper tail, there are the Normal, 2-parameter Log-Normal, Gumbel and the Exponential itself. In this case, the Gumbel distribution was selected due to its
good fit to the empirical rainfall maxima distribution.
According to Naghettini, Potter and Illangasekare (1996), the Gumbel distribution exhibits asymptotically an exponential
upper tail, as required in the GRADEX method’s second hypothesis.
In the sequence, knowing the probability distribution hR(r) and that the parameter gradex is the scale parameter of the Gumbel
distribution fitted to the rainfall maxima, one can readily estimate
the translation distance r0, as a result of Equation 16.
Throughout the D2 domain, the extrapolated frequency curve for the runoff volumes X is derived, from the frequency
curve defined for the rainfall volumes, by subtracting from P the constant value r0, for a given return period. In the D1 domain, where the annual maximum runoff records are known, one should proceed with the conventional frequency analysis.
Simulation scenarios
The lack of information about hR(r) leads to the consideration
of certain simulation scenarios. In the first place, it is supposed
that it is uniformly distributed between rmin and rmax. Further adjustments are made to analyse other candidate distributions, such as the beta model, which admits a large number of shapes as a result of the combined effects of the numerical values of
parameters α and β.
Lastly, it is modelled also the scenario where the extrapolation
point is fixated in 10-year return period, following a prescription that
seems consolidated in the technical literature (i.e., ZUFFO, 1993;
SANSIGOLO et al., 1984), that considers that the retention loss limit is the difference between 10-year rainfall and runoff. Although it was later realised that this was sometimes overconservative (CFGB, 1994), we keep the scenario as an example of those possible results. In this case, there is no association between the methods
described in the present paper, and it is not necessary to define
the retention’s probabilities distribution. Table 2 summarizes the simulated scenarios.
Figure 6. Standard asymptotic model adjustment of the basin data. Source: Adapted from Cunha et al. (2015).
Table 1. Extension of the pluviographic stations’ series existent in the Serra Azul river catchment at Jardim.
Code Station Name Data Period
RESULTS AND DISCUSSION
Rainfall probability distribution and the gradex parameter estimation
Figure 7 present the results of the Gumbel theoretical
distribution fitting to the sample of annual maximum rainfall volumes observed in the 26 recorded years at the Jardim gauging
station, with the parameters estimated by the method of L-moments
(α = 14.3 and β = 87.6). Accordingly, the gradex parameter
a = α = 14.3 mm corresponds to the slope of the straight line, in
the D2 domain, depicted in the chart of Figure 7.
It should be stressed, though, that the GRADEX method
relates the frequencies of maximum rainfall and runoff volumes
for a given duration, here fixed in 28 hours, not being required that
the maximum runoff volume would have been generated by the maximum rainfall depth. The events are treated as independent.
Probability distribution of retention and estimation of the translation distance
The calculation of Ri = Pi – Xi for the 77 observed events resulted in the empirical values of the global water retentions which vary between 14.1 mm and 85.1 mm. Among them, the annual maximum runoff volumes correspond to retentions upwards of 34.8 mm in the 12 years of continuous hourly data. In Table 3 are summarized the main calculated variables for these twelve maximum events of duration d = 28 hours, with highlight to rmin in the 11th event. It stands out that the precipitated volumes presented
in Table 3 are those of the (Pi, Xi) pairs, for i corresponding to each of the years of rainfall-runoff records, and not necessarily, those referring to the annual maximum precipitated volumes.
The maximum limits, calculated by Equation 17 for the natural and ordered CNASYMPTOTIC are equal to 591.7 mm and 511.5 mm, respectively. From the minimum retention (34.8 mm) and a ∆r of 1.0 mm up to the immediately superior value in relation to the maximum retentions, it is possible to obtain the retention’s probability distribution, through the uniform and beta models, with different
sets of parameters. As such, by applying Equation 16 for the natural
and ordered simulation scenarios (N1 to N6 and O1 to O6), the
estimates of the translation distances are obtained and shown in Table 4. In the T10 scenario, the calculation was based upon the calculation steps indicated by Zuffo (1993), in which translation occurs from the empirical runoff volume of 10-year return period.
As shown in Table 4 the r0 estimates vary from 67% to
112% in relation to that calculated by the T10 scenario. This, on
its turn, is very similar to scenario N3, with a beta distribution
with α = β = 2 and a CNNATURAL ASYMPTOTIC = 30.0.
Probability distribution of flood volumes
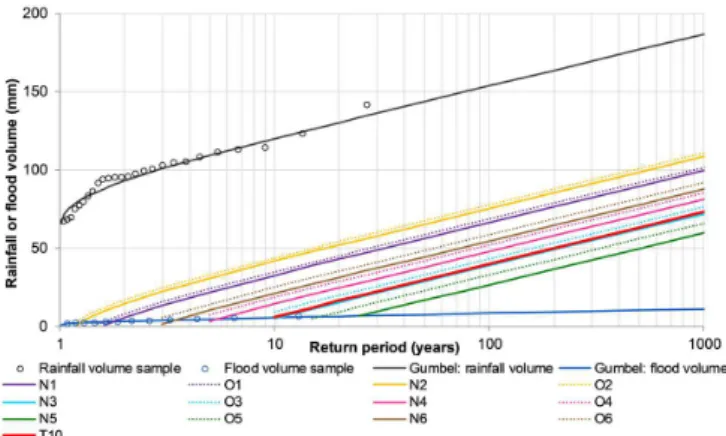
In the D2 domain, from the curve defined for the rainfall
depths P, the r0 values calculated on the 13 simulation scenarios
were employed to find the respective extrapolated curves for the
runoff values X through translation, as shown in Figure 8. In the
D1 domain, the conventional frequency analysis of the observed
annual maximum runoff volumes was carried out.
Table 2. Simulation Scenarios.
Scenario CNASYMPTOTIC hR(r) distribution
N1 CNNATURAL ASYMPTOTIC
= 30.0
Uniform
N2 Beta (α = 1, β = 2)
N3 Beta (α = 2, β = 2)
N4 Beta (α = 2, β = 3)
N5 Beta (α = 3, β = 4)
N6 Beta (α = 2, β = 4)
O1 CNORDERED ASYMPTOTIC = 33.2
Uniform
O2 Beta (α = 1, β = 2)
O3 Beta (α = 2, β = 2)
O4 Beta (α = 2, β = 3)
O5 Beta (α = 3, β = 4)
O6 Beta (α = 2, β = 4)
T10 -
-Table 3. Calculated variables for the annual maximum runoff volumes’ events.
ID
Rainfall Volume
(mm)
Runoff Volume
(mm)
Retention (mm)
1 68.0 4.99 63.0
2 44.0 1.97 42.1
3 78.0 5.27 72.7
4 64.2 4.11 60.1
5 63.1 2.07 61.0
6 74.5 3.24 71.3
7 68.0 6.74 61.2
8 57.2 3.46 53.7
9 58.8 2.91 55.9
10 51.6 2.17 49.4
11 36.9 2.17 34.8
12 78.0 3.18 74.8
Figure 7. Gumbel probability distribution fitted to the annual
Results have shown that the extrapolated curve of the
flood volumes for the Serra Azul river basin varied significantly
among the simulated scenarios. The O2 scenario shows the highest runoff volumes for a given return period, while scenario N5 is the one that represents the lowest values. Additionally, the scenario groupings N1/O1 and N2/O2 indicate overestimated runoff volumes, which do not match with the sample values of annual maximum runoff volumes.
To exemplify the obtained variations, a return period of
T = 100 years was made fixed to results extraction. Extrapolation
in the T10 scenario results in a X100 equivalent to 39.8 mm. The other scenarios resulted in surface runoffs that vary between
26.7 and 77.6 mm for the fixed return period, i.e., -33% up to +95% of X100 - T10. This discrepancy is considered to be significant
in the runoff volumes estimation, varying, in average, 135% in
relation to the reference quantile for T = 100 years.
A range of reasonable distributions seems to be among the curves of scenarios N4/O4 and N5/O5. Indeed, as mentioned in the translation distance r0 calculation, the T10 scenario is very much alike scenario N3, with a beta distribution of parameters
α = β = 2. Both result in extrapolations which are coherent with
the empirical runoff volumes, thus reinforcing the assumption founded in literature that the saturation condition for the basin
occurs from the frequency 0.90 on.
Considering a common distribution for analysing the CN marginal effects over the results, it is worthwhile to note that the differences between CNNATURAL ASYMPTOTIC and CNORDERED ASYMPTOTIC, as shown in Figure 8 by full lines very close to dotted lines of the same colour, are indeed subtle. These inferences seem to increase as r0 increases.
About the CN behaviour, Hawkins, Ward and Woodward (2015) proposed that, in the case of the runoff coefficients of the selected events be between 0.003 and 0.070, the basin could be considered of complacent behaviour (Figure 2b), for which case there is no explicit equations relating rainfall depths and the CN parameter. Knowing that, a more detailed investigation of
the superficial runoff coefficients was conducted, now for all
77 maximum events selected. In this case study, minimum and maximum observed values were, respectively, 0.013 and 0.105,
with an average of 0.041, and only 10% of the events showed
Table 4. Calculated translation distances.
Scenario r0 (mm) r0/r0 T10
Relation
N1 87.3 77%
N2 78.2 69%
N3 114.8 101%
N4 105.6 93%
N5 126.9 112%
N6 99.0 87%
O1 85.0 75%
O2 76.0 67%
O3 110.5 97%
O4 101.4 89%
O5 120.8 106%
O6 94.9 83%
T10 113.8
-Figure 8. Probability distributions of P and X for the 13 simulation scenarios.
C > 0.070. It was then required to check whether the Serra Azul river catchment exhibits a complacent behaviour, differently from
the findings of Cunha et al. (2015) and, therefore, not compatible with the requirements for the association of the SCS-CN and
GRADEX methods.
To such end, it was employed continuous hydrologic modelling techniques, as a way of obtaining new maximum events that would validate the standard or complacent behaviour curves developed by Hawkins (1993). The analyses pointed to the utilization of the GR4 model, described by Makhlouf and
Michel (1992). Briefly, it consists of a lumped conceptual model of 4 parameters that allows for a continuous simulation of flows
at the catchment outlet, from precipitation and evaporation data. To simulate maximum rainfall depths over the catchment – between 250 and 400 mm, that wasn’t found in data – some observed rainfall events were selected to represent different temporal distributions. For each one, the hypothetical maximum precipitations were discretized, proportionally in a duration of 28 hours.
Through the use of the GR4 model, these new rainfall
events generated typical flood hydrographs, thus allowing the
calculation of additional values for the CN, in order to identify the characteristic behaviours proposed by Hawkins (1993). The P x CN pairs were then plotted together with the events selected by Cunha et al. (2015) in order to define the characteristic behaviour of the Serra Azul river catchment at Jardim. Figure 9 shows that the simulated events do not tend to an asymptotic value and, in fact, reinforce the hypothesis that the basin appears to have a complacent behaviour.
Beforehand, this finding entails some questioning remarks
about the actual representativeness of the Juatuba river catchment, in relation to the Minas Gerais state. According to Hawkins et al.
(2009) standard behaviour is the one most often observed in
drainage basins, representing 70% of analysed cases in the United
States. By applying the method in Italian basins, D’Asaro and Grillone (2012) observed that 75% of them were also shown to
be standard, and only 20% to be complacent. If it is confirmed
behaviour, the latter could no longer be considered as a model to represent the typical hydrology over extended areas of the state.
In this context, it is put into question also the application of the methodology here proposed in a catchment that does not comply with the premise of standard behaviour. On the other
hand, it is worth noting that these preliminary findings result from
hydrologic simulations, with model and parameter uncertainties
that should be considered, before a final conclusion regarding the CN typical behaviour is reached. Given the difficulty in obtaining reliable rainfall and flow data in Brazilian catchments and for the
sake of exemplifying the theories involved in the association steps
between the SCS-CN and GRADEX methods, it was deemed
coherent to maintain the analyses for the Serra Azul river at Jardim.
It must be highlighted that the GRADEX relation with
CNASYMPTOTIC ensures a greater precision in the definition of the limits for the probability distribution of the retention and, consequently, the translation distance r0. Thus, by defining the best distribution hR(r), the uncertainties in the maximum flow frequencies curves are reduced. The adaptation of the SCS-CN method, proposed by Hawkins (1993) refers to the constant value of the parameter CN for large rainfall depths (when in standard
behaviour), which matches the analyses conducted for the GRADEX method’s domain D2, in which are assumed maximum values and
the distribution of R is no longer dependent on precipitation P.
Maximum flow estimation
As shown, the methodology produces flood volumes quantiles of specified duration and requires an additional step for obtaining the corresponding maximum flow. Among the many
existing methods for such an end, the average unit hydrograph developed by Cunha et al. (2015) for the Serra Azul river catchment at Jardim (Figure 10) stands out as a method of choice, as it
enables the analyses of the whole flood hydrograph and not only of peak flow.
So far in this text, the results obtained by the conventional SCS-CN were put into question, but they have not been compared to the simulated scenarios (N3/O3, N4/O4, N5/O5 and T10),
which best fitted the empirical quantiles. Therefore, the flood
hydrographs for the SCS-CN and Asymptotic Fitting methods, such as originally presented in the literature, were also calculated.
Moreover, with the availability of the GR4-model simulated
flows for the 26 years of observed rainfall at the Jardim gauging station, the sample of 12 years of observed flows, utilized in the
conventional frequency analysis, was expanded with the annual
maximum flows obtained through the continuous modelling.
The results for all scenarios are depicted in Figure 11.
The SCS-CN method, as proposed by the NRCS (SCS-CN scenario in Figure 11) showed a more coherent inclination
when compared to the one of flood flow’s empirical data, despite
being displaced in relation to them. For all return periods shown, this scenario seems to be the one with the highest-quantile’s over estimation.
In the case of the adaptations proposed by Hawkins
(1993) for the Asymptotic Fitting method, as represented by the SCS-Nat and SCS-Ord scenarios, the results were very close to the conventional frequency analysis. SCS-Nat showed quantiles that are lower than those given by the frequency analysis, while the SCS-Ord results are equivalent to them, with a subtle change in the slope from the 100-year return period on. In this case, given the
inherent difficulty of selecting events for the method application,
it is considered more advantageous the direct employment of the conventional frequency analysis technique.
For the scenarios of association between the methods (N3/O3, N4/O4 and N5/O5) and the one that was constantly
found in applications of GRADEX in literature (T10), there is
a variation range superior to the curves given by the frequency analysis and by the Asymptotic Fitting method, but inferior to the conventional SCS-CN, thus indicating reasonably plausible
maximum flows. Among the scenarios in this range, the one
that best approaches the empirical quantiles is N5, in which it is assumed that the retention’s probability distribution is a beta
with parameters α = 3 and β = 4. This scenario agrees with the
recommendations from CTGREF (1972) and Naghettini, Potter
and Illangasekare (1996) that the definition of the extrapolation
point of the runoff volumes should be made on the basis of the observed data, giving a greater emphasis to the higher-order statistics. In this case, the optimal extrapolation suggested from
Figure 9. Simulated events in GR4 in relation to standard behaviour
curve and events selected by Cunha et al. (2015). Figure 10. Average unit hydrograph developed for the Serra Azul
the association between the SCS-CN and GRADEX methods
would be of a return period of 30 years.
It must be remembered that, in practice, Guillot and
Duband (1967) recommend the use of an empirical distribution for the observed data up to a return period of 10 to 20 years for relatively impermeable basins and up to 50 years for basins with a
greater infiltration capability. Thus, the Serra Azul river catchment is confirmed in the more permeable classification.
It is highlighted that in none of these analyses, the simulation scenarios selected in the association methodology here presented
(N3/O3, N4/O4 and N5/O5) were incoherent or significantly
discrepant in relation to the methodologies currently consolidated in the literature (frequency analysis, SCS-CN, Asymptotic Fitting
and GRADEX). It must be stressed, therefore, that the association between the SCS-CN and GRADEX methods is conceptually possible and facilitates the specification of the translation distance
from the calculated values of CN in poorly gauged catchments. The results here reported refer only to a case study and, surely, the methodology must be applied to other data sets to verify its applicability and coverage. These applications may allow
for the confirmation that the standard behaviour is in fact the
most common in Brazilian basins, as well as establish isolines of
gradex parameters, for different durations, in regions of specific
interest, thus making the methodology of broad and simple use.
CONCLUSION
The studies here presented reinforce the complexity involved in the understanding of the response phenomenon of a given catchment to precipitation events. The representation of this phenomenon by the development and application of mathematical models requires the careful collection of data so that extrapolation for frequencies higher than those observed in the records may be allowed.
In Brazil, simultaneous rainfall and flow records in hourly
time intervals are scarce. The most frequent case is to not have
available flow record in quantity and quality enough for a detailed
hydrological analysis, which makes necessary the use of the so-called indirect methods, which employ rainfall data to estimate
runoff, such as the GRADEX and SCS-CN methods. The lack of a sufficient hydrometric monitoring has reflected in the prevalent
use and abuse of the SCS-CN method, making the situation even more complex, for its being a model originally conceived for application in small catchments with distinct hydrological characteristics, and sometimes even disparate from those that occur in Brazilian basins.
The results of the association proposed in this paper
indicate distinct possible extrapolations of the flood volumes
for the studied basin depending on the choice of the probability distribution of water retention. In any case, it is believed that the simulated scenarios cover the plausible range of results, allowing for a greater physical and theoretical basis to the choice of the
extrapolation point and, consequently, to the maximum flow
calculation.
Special attention must be given to the basin permeability
issue, to the complacent behaviour identified in it and to its
applicability to the methodologies here presented. However, as for the goal of showing the attributes of the proposed methodology, the available data seem to be reasonably coherent.
As previously mentioned, being this the first application
of the proposed method, it would be recommendable to apply it to other catchments, with continuous and simultaneous rainfall
and flow monitoring, so as to understand its limitations, extension and benefits.
ACKNOWLEDGEMENTS
The authors thank Professor Richard H. Hawkins for all the shared knowledge and attention given, CPRM and Professor
Éber Pinto for making available the rainfall and flow data utilized,
and the team of Potamos Engenharia e Hidrologia for their support during the development of this work. They also wish to acknowledge the support to this research from CNPq (“Conselho
Nacional de Desenvolvimento Científico e Tecnológico”) and
from CAPES (“Coordenação de Aperfeiçoamento de Pessoal de Nível Superior”). The authors also wish to thank the anonymous reviewers for their valuable comments and suggestions.
REFERENCES
BARTLETT, M. S.; PAROLARI, A. J.; MCDONNELL, J. J.; PORPORATO, A. Beyond the SCS-CN method: a theoretical framework for spatially lumped rainfall-runoff response. Water Resources Research, v. 52, n. 6, p. 4608-4627, 2016. https://doi.
org/10.1002/2015WR018439.
CFGB – COMITÉ FRANÇAIS DES GRANDS BARRAGES. Les
crues de projet des barrages: methode du gradex. In: CONGRÈS
CIGB/ICOLD, 18., 1994, Durban. Annales… Le Bourget-du-Lac:
CFBR, 1994. 96 p. v. 2.
CHOW, V. T. C.; MAIDMENT, D. R.; MAYS, L. W. Applied hydrology.
2nd. ed. New York: McGraw-Hill Higher Education, 1988.
COSTA, K. T.; FERNANDES, W. Avaliação do tipo de distribuição de probabilidades das vazões máximas diárias anuais no Brasil.
Figure 11. Probability distributions of maximum flows as
Revista Brasileira de Recursos Hídricos, v. 20, n. 2, p. 442-451, 2015.
http://dx.doi.org/10.21168/rbrh.v20n2.p442-451.
CTGREF – CENTRE TECHNIQUE DU GÉNIE RURAL, DES EAUX ET DES FORÊTS. L’Application de la Méthode du Gradex à l’estimation des Crues de Faible Fréquence. Paris: Ministère
de l’Agriculture, 1972.
CUNHA, S.; SILVA, F.; MOTA, T.; PINHEIRO, M. Avaliação da acurácia dos métodos do SCS para cálculo de precipitação efetiva e hidrogramas de cheia. RBRH – Revista Brasileira de Recursos Hídricos, v. 20, n. 4, p. 837-848, 2015.
D’ASARO, F., GRILLONE, G. Empirical investigation of curve number method parameters in the mediterranean area. Journal of Hydrologic Engineering, v. 17, n. 10, p. 1141-1152, 2012.
D’ASARO, F.; GRILLONE, G.; HAWKINS, R. H. Curve number: empirical evaluation and comparison with curve number handbook tables in sicily. Journal of Hydrologic Engineering, v. 19, n. 12, p. 04014035, 2014. http://dx.doi.org/10.1061/(ASCE)
HE.1943-5584.0000997.
DNAEE – DEPARTAMENTO DE ÁGUAS E ENERGIA
ELÉTRICA. Bacia representativa de Juatuba: dados do período
1976-1980. Brasília: DNAEE, 1986. (Série E-03).
DUBAND, D.; MICHEL, C.; GARROS, H.; ASTIER, J. Estimating extreme value floods and the design flood by the gradex method.
In: INTERNATIONAL CONGRESS ON LARGE DAMS, 16., 1988, San Francisco, California. Proceedings… Paris: ICOLD, 1988.
p. 1009-1047.
FERNANDES, W.; NAGHETTINI, M. Integrated frequency analysis of extreme flood peaks and flood volumes using the regionalized quantiles of rainfall depths as auxiliary variables. Journal of Hydrologic Engineering, v. 13, n. 3, p. 171-179, 2008. http://
dx.doi.org/10.1061/(ASCE)1084-0699(2008)13:3(171).
GUILLOT, P. Application of the method Gradex. In:
INTERNATIONAL SYMPOSIUM IN HYDROLOGY, 2., 1972,
Fort Collins. Proceedings... Colorado: Water Resources Publications,
1972. p. 44-49.
GUILLOT, P.; DUBAND, D. La méthode du gradex pour le calcul
de la probabilité des crues à partir des pluies. In: LENINGRAD SYMPOSIUM: FLOODS AND THEIR COMPUTATION, 1967, Gentbrugge. Proceedings... Gentbrugge: IAHS Publ., 1967.
p. 560-569.
HAWKINS, R. H. Asymptotic determination of runoff curve numbers from data. Journal of Irrigation and Drainage Engineering, v.
119, n. 2, p. 334-345, 1993. http://dx.doi.org/10.1061/(ASCE)0733-9437(1993)119:2(334).
HAWKINS, R. H.; HJELMFELT JUNIOR, A. T.; ZEVENBERGEN, A. W. Runoff probability, storm depth and curve numbers. Journal
of Irrigation and Drainage Engineering, v. 111, n. 4, p. 330-340, 1985.
http://dx.doi.org/10.1061/(ASCE)0733-9437(1985)111:4(330).
HAWKINS, R. H.; WARD, T. J.; WOODWARD, D. E. The complacent-violent runoff: a departure from traditional behavior.
Tucson: Watershed Management, 2015. p. 169-181.
HAWKINS, R.; WARD, T. J.; WOODWARD, D. E.; MULLEM, J. A. Curve number hydrology: state of the practice. Reston: ASCE/
EWRI Curve Number Hydrology Task Committee, 2009.
HJELMFELT JUNIOR, A. T. Investigation of curve number procedure. Journal of Hydraulic Engineering, v. 117, n. 6, p. 725-737,
1991. http://dx.doi.org/10.1061/(ASCE)0733-9429(1991)117:6(725).
LINSLEY JUNIOR, R. K.; KOHLER, M. A.; PAULHUS, J. L. H. Hydrology for engineers. New York: McGraw-Hill Book Co., Inc., 1975.
MAKHLOUF, Z.; MICHEL, C. Compléments sur le modèle pluie-débit GR4J et essai d’estimation de ses paramètres- Paris XI. Paris: Créteil
University, 1992.
MISHRA, S. K.; SURESH BABU, P.; SINGH, V. P. SCS-CN
method revisited. In: SINGH, V. P. (Ed.). Advances in hydraulics and hydrology. Littleton: Water Resources Publication, 2007. 36 p.
MISHRA, S.; PANDEY, A.; SINGH, V. Special Issue on Soil Conservation Service Curve Number (SCS-CN) Methodology. Journal of Hydrologic Engineering, v. 17, n. 11, p. 1157, 2012. http://
dx.doi.org/10.1061/(ASCE)HE.1943-5584.0000694.
MULLEM, V. A. J.; WOODWARD, D. E.; HAWKINS, R. H.; HJELMFELT, A. T. Runoff curve number method: beyond
the handbook. In: SECOND FEDERAL INTERAGENCY HYDROLOGIC MODELING CONFERENCE, 2., 2002, Las Vegas. Proceedings… Las Vegas: NOAA, 2002. 10 p.
NAGHETTINI, M.; POTTER, K. W.; ILLANGASEKARE, T. Estimating the upper tail of flood-peak frequency distributions using hydrometeorological information. Water Resources Research,
v. 32, n. 6, p. 1729-1740, 1996.
NRCS – NATURAL RESOURCES CONSERVATION SERVICE.
National engineering handbook. Part 630: hydrology. Washington:
USDA, 2004.
PONCE, V. M.; HAWKINS, R. H. Runoff curve number: has it reached maturity? Journal of Hydrologic Engineering, v. 1, n. 1, p. 11-19,
1996. http://dx.doi.org/10.1061/(ASCE)1084-0699(1996)1:1(11).
SANSIGOLO, C. A.; PALERMO, M. A.; GOMES, A. M. Predeterminação de vazões extremas pelo método do Gradex.
In: CONGRESSO BRASILEIRO DE METEOROLOGIA, 3., 1984, Belo Horizonte. Anais… Rio de Janeiro: SBMET, 1984.
TEDELA, N. H.; MCCUTCHEON, S. C.; RASMUSSEN, T. C.; HAWKINS, R. H.; SWANK, W. T.; CAMPBELL, J. L.; ADAMS, M. B.; JACKSON, C. R.; TOLLNER, E. W. Runoff curve numbers for 10 small forested watersheds in the Mountains of the Eastern United States. Journal of Hydrologic Engineering, v. 17,
n. 11, p. 1188-1198, 2012. http://dx.doi.org/10.1061/(ASCE) HE.1943-5584.0000436.
ZUFFO, A. C. Relações estatísticas entre precipitações intensas e vazões máximas: o método GRADEX. 1993. 261 f. Dissertação (Mestrado em Engenharia Hidráulica) - Universidade Politécnica de São
Paulo, São Paulo, 1993.
Authors contributions
Tainá Mota: Initial research design; acquisition, analysis and interpretation of data; drafting of manuscript.
Mauro Naghettini: Study conception and first design; contributions
to the analysis of the results and conclusions; critical revision.
Wilson Fernandes: Participation in initial research design; contributions to the conception and design; critical revision.