Ana Raquel Correia Gonçalves Marques
Licenciada em Ciências de Engenharia Química e Bioquímica
Development of a piezoelectric
biosensor based on PVDF films
Dissertação para obtenção do Grau de Mestre em Engenharia Química e Bioquímica
Orientador: Ana Cecília Afonso Roque, Professora
Auxiliar, Faculdade de Ciências e Tecnologia da
Universidade Nova de Lisboa
Co-orientador:
Pedro
Miguel
Vidinha
Gomes,
Investigador
em
pós-doutoramento,
REQUIMTE,
Faculdade de Ciências e Tecnologia da Universidade
Nova de Lisboa
Júri:
Presidente: Prof. Doutor Rui Manuel Freitas Oliveira Arguente: Doutor Abid Hussain
Vogal: Doutor Pedro Miguel Vidinha Gomes
Development of a piezoelectric biosensor based on
PVDF films
Copyright ©Ana Raquel Correia Gonçalves Marques, Faculdade de Ciências e Tecnologia da Universidade Nova de Lisboa, Universidade Nova de Lisboa
iii Acknowledgments
I am sincerely grateful to my supervisors Cecilia Roque and Pedro Vidinha, for the support and guidance they showed me throughout my dissertation. Many thanks for Paulo Inácio and Carlos Dias for allowing me to work with their project and for sharing their knowledge. It surely would have not been possible without their help and fruitful discussions with all four.
I would like to show my gratitude to Ana Pina, Abid Hussain, Ana Margarida, Ana Marcos, Íris Batalha and Ricardo, for all the help at the laboratory, discussions and for providing me an excellent working atmosphere. A very special recognition to Ana Pina, whose help in laboratorial work and friendship were determinant to accomplish my work. I would also like to thank Dr. Paulo Lemos at the Bioengineering group (FCT-UNL) for the help with the microscopy analysis and Tânia and Prof. João Sotomayor for the help with the water contact angle measurements.
iv Resumo
A presente dissertação tem como base um biosensor piezoeléctrico baseado em ondas acústicas que se propagam em filmes finos do polímero fluoreto de polivinilideno (PVDF), utilizado para produzir um dispositivo ressonante oscilatório. A essência deste dispositivo consiste num filme composto por um polímero piezoeléctrico, PVDF, responsável pela oscilação do filme, e por uma membrana porosa, Immobilon, um tipo especial de PVDF com capacidade de ligação a proteínas que pode actuar como receptor biológico.
Foi estudada a possibilidade de se utilizar um filme composto apenas por PVDF piezoeléctrico. Devido ao carácter extremamente hidrofóbico do PVDF, pretendia-se efectuar a modificação da superfície do polímero através da imobilização de uma camada funcional à sua superfície, de modo a melhorar a hidrofilicidade e biocompatibilidade do filme. Para tal, foi efectuado um método de imersão, aplicado tanto a PVDF piezoeléctrico não poroso como a membranas porosas de PVDF. Foram estudas três possíveis soluções para o revestimento, nomeadamente, soluções de polietilenoglicol (PEG), 3,4-Dihidroxi-DL-fenillalanina (DL-DOPA) e goma arábica. A hidrofilicidade das membranas foi caracterizada através da medição de ângulos de contacto e a sua composição elementar foi estudada por análise elementar. Marcou-se a proteína BSA com o fluoróforo isotiocianato de fluoresceína – FITC, para que se realizassem ensaios qualitativos e quantitativos para o estudo da sua ligação a membranas de PVDF. Os resultados obtidos indicaram que seria com uma solução de PEG aplicada a uma membrana porosa de tamanho de poro 0.2 µm que se obteria o melhor sistema a aplicar no sensor. A resposta do sensor foi testada utilizando um sistema composto por PVDF/Immobilon (0.2 µm) /PVDF para a detecção de PEG e BSA, sendo possível detectar a presença de ambos os compostos no meio líquido utilizado no sensor.
v Abstract
The core of this work is a piezoelectric biosensor in which acoustic waves are launched in very thin PVDF polymer films to produce an oscillatory resonant device. The essence of the device consists in a polymer film system made of a piezoelectric polymer, PVDF, responsible for the film oscillation and a porous membrane, Immobilon, a special type of porous PVDF with protein binding capacity which can act as a biosensitive area.
The possibility of using a film system composed only by PVDF was studied. Due to its strong hydrophobic nature, surface modification was aimed to be performed by coating a functional layer on the membrane surface, in order to improve the hydrophilicity and biocompatibility of PVDF. An immersion method was preformed and applied to porous and non-porous PVDF membranes. Three distinct coating solutions were studied, namely, polyethylene glycol (PEG), 3,4-Dihydroxy-DL-phenylalanine (DL-DOPA) and Gum Arabic solutions. Hydrophilicity improvements of the membranes were characterized by water contact angle measurements and its elemental composition was studied by elemental microanalysis. BSA protein marked with FITC fluorescein was used to perform quantitative and qualitative assays in order to study its adsorption to coated and uncoated PVDF membranes. Globally, the best results were obtained when a solution of PEG was utilized with 0.2 µm microporous membrane. The sensor response was tested with polyethylene glycol (PEG) and bovine serum albumin (BSA), using a film system composed by PVDF/0.2 µm Immobilon/PVDF, which was able to respond to the presence of both compounds in liquid medium.
vi Table of contents
Chapter 1 Introduction... 1
1.1 Biosensors ... 1
1.1.1 Biorecognition Systems ... 2
1.1.2 Transduction mechanisms... 3
1.1.3 Applications of Biosensors ... 4
1.1.4 Immobilization technniques ... 5
1.1.5 Piezoelectric gravimetric biosensors ... 6
1.2 The Piezoelectric Biosensor... 11
1.2.1 Operating Principal and Oscillating Circuit ... 11
1.2.2 Polymer film system ... 13
1.3 Aims of the Work ... 14
Chapter 2 Materials and Methods ... 15
2.1 Instrumentation ... 15
2.2 Chemicals ... 15
2.3 Chromatographic materials... 16
2.4 General Methods ... 16
2.4.1 Immersion method for surface coating/modification of hydrophobic PVDF membranes ... 16
2.4.2 Conjugation of BSA to FITC ... 17
2.4.3 Characterization techniques ... 18
2.4.4 Piezoelectric Biosensor experiments ... 21
Chapter 3 Surface modification of PVDF ... 26
3.1 Introduction ... 26
3.2 Results and Discussion ... 27
3.2.1 Surface modification PVDF with different porosity (non-porous, 0.2 µm and 0.45 µm) by immersion method in DL-DOPA, PEG and Gum Arabic solutions ... 27
3.2.2 Quantitative and qualitative study of BSA-FITC adsorption at modified/coated PVDF membranes ... 33
Chapter 4 The Piezoelectric Biosensor ... 40
vii 4.1.2 Detection of BSA using a PVDF/ImmobilonPSQ (0.2 µm)/PVDF film system, with
methanol pre-wetting ... 44
4.1.3 Sensor modifications ... 46
Chapter 5 Conclusion remarks and Future Work ... 47
5.1 Surface modification by coating of functional layers ... 47
viii Index of Figures
Figure 1.1 General block diagram of biosensors ... 2
Figure 1.2 Biosensor classification. ... 2
Figure 1.3 Chemical formula of PVDF ... 7
Figure 1.4 PVDF-α form and PVDF-β form ( Carbon, Hydrogen, Fluorine) ... 8
Figure 1.5 Surface modification of PVDF porous membrane via poly(DOPA) coating and heparin immobilization [38] ... 10
Figure 1.6 Schematic representation of the plausible mechanism of plasma grafting of PEG onto the PVDF microporous membrane [39] ... 10
Figure 1.7 - A piezoelectric film clamped between two pairs of electrodes ... 11
Figure 1.8 Oscillator electronics schematic ... 12
Figure 1.9 Polymer film system ... 13
Figure 2.1 BSA-FITC labelling of free hydroxide groups ... 19
Figure 2.2 BSA-FITC labelling of free amine groups ... 20
Figure 2.3 a) Opened reaction chamber b) Film system placed inside the reaction chamber ... 21
Figure 2.4 Piezoelectric Biosensor apparatus ... 22
Figure 2.5 Closed circuit scheme for input of solution ... 23
Figure 2.6 Open circuit scheme for washing procedure ... 23
Figure 2.7 Fabrication process of the polymer film systems ... 24
Figure 2.8 Area of immersed film ... 25
Figure 2.9 a) PVDF film system b) PVDF/Immobilon/PVDF film system, with plastic layer protection ... 25
Figure 3.1 Chemical structure of DL-DOPA ... 26
Figure 3.2 Chemical structure of PEG ... 26
Figure 3.3 Water contact angle results ... 28
Figure 3.4 Comparison between the amount of BSA-FITC unbounded onto PVDF surface according to the porosity type and coating solution. ... 34
Figure 3.5 Fluorescence background of PVDF membranes ... 36
Figure 3.6 Positive control (P) for fluorescence assays ... 39
Figure 4.1 Detection of PEG and BSA using a PVDF/0.2um/PVDF film system ... 40
Figure 4.2 Detection of PEG and BSA using a PVDF/0.2um/PVDF film system - Overnight experiment ... 42
x Index of Tables
Table 1.1 PVDF membrane modified by surface coating ... 9
Table 1.2 PVDF membranes modified by surface grafting ... 10
Table 2.1 Immersion solutions for positive and negative control ... 17
Table 2.2 Control Experiments for –OH labelling with BSA-FITC ... 19
Table 2.3 Control Experiments for –NH2 labelling with BSA-FITC ... 20
Table 3.1 PVDF hydrophilicity evaluation for different coating solutions and porous type ... 27
Table 3.2 Elemental microanalysis comparisons between DOPA, Gum Arabic and PEG modified PVDF with different porosity ... 31
Table 3.3 Control experiments for labelling assays with BSA-FITC (X = step preformed) ... 33
Table 3.4 Fluorescence microscopy results for pristine membranes (N4)... 35
Table 3.5 Fluorescence microscopy results for N3 control ... 36
Table 3.6 Fluorescence microscopy results for N2 control ... 37
Table 3.7 Fluorescence microscopy results for N1 and Positive control P ... 38
xi Acronyms
BSA Bovine serum albumin protein
CBB Coomassie Brilliant Blue
DI Deionized
DL-DOPA 3,4-Dihydroxy-DL-phenylalanine FITC Fluorescein isothiocyanate
FTIR Fourier transform infrared spectroscopy
GA Gum Arabic
1 Chapter 1 Introduction
1.1 Biosensors
In today’s world, there is a great need of detecting a wide diversity of compounds. Several common chemical and biological materials can be extremely dangerous to human health and to the environment. For example, industrial and agricultural use of chemicals can lead to food and water supplies contamination and food deterioration can lead to bacteriological contamination. Also, the potential threat of bioterrorism must be considered, due to the possible deliberate release of biological toxins. As a result, there is the need for a tool that can rapidly, accurately and reliably detect contaminating bio-agents. Biosensors are low-cost high efficient devices for this purpose which currently are in the focus of research activities in sensorics and analytical chemistry [1-2].
The biosensor field has grown enormously since the first demonstration of the biosensor concept by Leland C. Clark Jr., in 1962, with the development of an amperometric enzyme electrode for glucose. Since then, research communities from chemical, biological, material, physical sciences and engineering and computer sciences have come together to develop more reliable, robust and accurate biosensing devices. Therefore, the definition of biosensor varies with the field of application and was not uniform in the literature a few years ago.
A biosensor can be defined as “an analytical device, which converts the concentration of the
target substance, the analyte, into an electrical signal through a combination of a biological or biologically derived recognition system either integrated within or intimately associated with a suitable physic-chemical transducer” [3].
2
Figure 1.1 General block diagram of biosensors
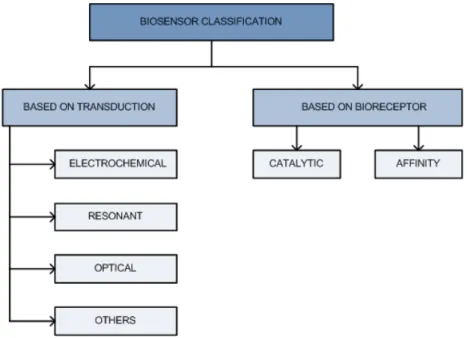
Biosensors can be distinguished either by their type of biorecognition system or their transducer mechanism. The classification is shown in Figure 1.2.
Figure 1.2 Biosensor classification.
1.1.1 Biorecognition Systems
3 According to the type of the bioreceptor, biosensors can generally be distinguished into the following groups:
Catalytic biosensors that use immobilized enzymes, microorganisms or living tissues as as bioreceptors. The use of an enzyme as a biorecognition element utilizes its selectivity to bind with a specific substrate and catalyze its conversion to a product. This enzyme–substrate-catalyzed reaction makes it possible for a signal to be produced by the transducer, which can be based on the reaction products, the charge exchange or heat generation.
Affinity biosensors are based on specific chemical binding. The analyte may simply bind to the biological material present on the biosensor, for example, antibodies, neuro-receptors and nucleic acids. These biosensors are based on affinity interactions by separating an individual or selected range of components from complex mixtures of biomolecules [5]. In immunosensors this would mean the antigen-antibody reaction. Each antibody recongnizes its antigen with great specificity. Neuro-receptors are neurologically active compounds such as insulin, other hormones and neuro transmitters that act as messengers via ligand interaction. In DNA sensors, the chemical selective chemical binding is the hybridization of molecule clusters with DNA molecules to form a double structure [4].
1.1.2 Transduction mechanisms
Biosensors can be classified based upon the transduction methods they employ. The transduction process transforms the physical, chemical or biological response of biorecognition into an electrical, optical or any other form of signal with high sensitivity. Transduction can be accomplished via a great variety of methods. Most forms of transduction can be categorized in one of three main classes: 1) optical detection methods, 2) electrochemical detection methods and 3) mass detection methods. Each of these three main classes contains many different subclasses, creating a nearly infinite number of possible transduction methods or combination of methods.[6]
1.1.2.1 Electrochemical biosensors
4 biosensors can be classified based on the measuring electrical parameters as: conductimetric, where the measured parameter is the electrical conductance/resistance of the solution;
amperometric, where current is the measured parameter; and potenciometric, where the measured parameter is oxidation or reduction potential of an electrochemical reaction. This class of biosensors is mainly used for detection of hybridized DNA, DNA-binding drugs, glucose concentration, etc. [1].
1.1.2.2 Gravimetric resonator biosensors
In resonant biosensors, an acoustic wave or piezoelectric transducer is coupled with a bio-element. When the analyte molecules get attached to the membrane, the mass of the membrane changes. The resulting change in the mass subsequently changes the resonant frequency of the transducer. This frequency change is then measured [1, 5].
1.1.2.3 Optical biosensors
In the most commonly used form of an optical biosensor, the transduction process induces a change in the phase, amplitude, polarization, or frequency of the input light in response to the physical or chemical change produced by the biorecognition process. For this type of biosensor, light is the output transducer signal measured. Optical transduction offers the largest number of possible subcategories of all three of the transducer classes. This is due to the fact that optical biosensors can be used for many different types of spectroscopy (e.g., absorption, fluorescence, phosphorescence, Raman, SERS, refraction, dispersion spectrometry, etc.) with different spectrochemical properties recorded. These properties include: amplitude, energy, polarization, decay time and/or phase [6].
Electrochemical, optical and acoustic transducers account for well over 90 % of the published literature in biosensors. However, new types of transducers are constantly being developed for use in biosensors as, for example, approaches based on thermal and magnetic principles.
1.1.3 Applications of Biosensors
Biosensors can be applied in any circumstances where analysis requires a rapid, direct, accurate, and a fool-proof read-out from a sample, proximal to where the analytical sample is taken.
5 sensors have been developed for measuring the concentration of biologically active, physiologically important compounds, such as glucose, urea, cholesterol levels in blood, testing of food flavour and components, allergens, meat quality, and fish freshness, monitoring of air, water and soil, herbicides, insecticides, detergents, fermentation and bioreactor processes, immunoreaction tests with immunosensors and fast genetic analysis using DNA chips. [11-12]
1.1.4 Immobilization technniques
One key issue of biosensor fabrication is the appropriate attachment of the biological elements onto the transducer surface (immobilization). The biorecognition elements are normally immobilized on a solid support, usually a membrane, polymer, copolymer, or semiconductor material. [5].
6 1.1.5 Piezoelectric gravimetric biosensors
Piezoelectric sensors have been developed based on very established theories in electricity, mass, and viscoelasticity and with commercially available instruments, such as quartz crystal microbalance (QCM). Piezoelectric sensors have shown their advantages over other sensors in terms of sensitivity, versatility, label free, low cost, and simplicity. They have been applied to the biomedical area mainly in the forms of immunosensors and genosensors for rapid detection of bacteria, viruses and proteins, and DNA/RNA hybridization, respectively [14-15].
Since the discovery of piezoelectricity in some simple crystals (e.g. quartz and topaz) by Jacques and Pierre Curie in the late 19th century, this phenomenon has kept minds excited. The Curies observed that a mechanical stress applied to the surfaces of various crystals, caused a corresponding electrical potential across the crystal, whose magnitude was proportional to the applied stress. Also, they verified the converse piezoelectric effect in which application of a voltage across these crystals caused a corresponding mechanical strain. These are the direct and reverse piezoelectric effects. Etymologically, the word “piezoelectricity'” derives from the
Greek word “piezo”, which means stress [16].
Many types of materials (quartz, tourmaline, lithium niobate or tantalate, oriented zinc oxide or aluminium nitride) exhibit the piezoelectric effect, but the properties of quartz make it the most common crystal type used in analytical applications. Most piezoelectric gravimetric biosensors are based on quartz crystal microbalances (QCM) or surface acoustic wave devices. Due to its piezoelectricity the crystal can be made to oscillate, by simple electronic circuitry, in a shear mode at a natural frequency which is inversely proportional to the crystal thickness. The addition of mass bounded to its surface reduces the frequency [17].
The polymer polyvinylidine fluoride (PVDF) can exhibit, when specially treated, piezoelectric properties and thus, has been reported to be used to replace the quartz crystal in gravimetric biosensors [17-18].
1.1.5.1 Piezoelectric biosensors based on acoustic waves in thin PVDF film
1.1.5.1.1 PVDF
7 alcohols and aliphatic, aromatic and chlorinated solvents [19-20]. However, its excellent chemical stability is of a particular concern when exposed to strong base solutions or esters and ketones.
Figure 1.3 Chemical formula of PVDF
PVDF is a semicrystalline polymer, usually containing 59 wt % fluorine and 3 wt % hydrogen [21]. As shown in Figure 1.3, the macromolecular linear chain structure of PVDF is -CH2CF2-.
The spacial arrangements of CH2 and CF2 groups along the polymer chains and the strong
interaction between both groups contribute to unique properties of PVDF. The bond between fluorine, which is highly electronegative, and the carbon atom is extremely strong (460 kJ/mol) and the C-C bond of the main polymer is surrounded by fluorine and hydrogen atoms, resulting in excellent chemical, thermal and mechanical stabilities [19-20].
Crystallinity can vary from about 35% to 70%, depending on the method of preparation and thermo-mechanical history and its degree affects PVDF’s toughness and mechanical strength.
8 Alfa
Beta
Figure 1.4 PVDF-α form and PVDF-β form ( Carbon, Hydrogen, Fluorine)
In recent years, PVDF has received great attention, especially as a membrane material regarding its outstanding properties, which make it suitable for a wide range of applications. PVDF membranes have been applied in water purification, medical purification, gas separation, food and beverages filtration, battery separators and fuel cell membranes. PVDF films can be applied in automotive and building industry, piezoelectric films and greenhouse. Piezoelectric PVDF films can particularly be used in medical and non-destructive evaluation transducers, loudspeaker, sonar detection, vehicle detection, and literally hundreds of other types of sensors.
PVDF membranes can be prepared by various methods such as phase inversion, use of inorganic particles [28], sintering [29-30] and track etching [31]. The main method for its preparation is phase inversion due to its simplicity, flexible production scale and low cost of production.
1.1.5.1.2 Hydrophilic modification of PVDF membrane
Despite PVDF’s excellent chemical, thermal and mechanical stabilities, there are some critical problems which limit further developments and applications of PVDF membranes. Its low surface energy and critical surface tension result in the poor wettability of PVDF membrane.
9 excluding the pores inside the membrane, due to the limited diffusion ability of the modifying agents into the membrane pores. Blending modification is used to achieve the desired functional properties along with the membrane preparation, accomplishing both preparation and modification process in a single step.
Surface modification of PVDF membranes can be classified into two categories: surface coating and surface grafting. Surface coating is the simplest way of improving the surface of PVDF membranes temporarily through coating or depositing a thin film functional hydrophilic layer onto its surface. However, the instability of the coated layer can be a problem, because it can be washed way along the operation and cleaning process due to the weak physical interaction between PVDF and coated layer. Chemical treatments (e.g. sulfonation or crosslinking) can be performed on the membrane surface to anchor the coated laye, while surface grafting can conquer the instable problem completely by the grafting polymerization of monomers, immobilizing the functional chains, brushes or layers onto the membrane surface through covalent bonding interaction[20]. Covalent attachment offers a long-term chemical stability of grafted chains in contrast with physically surface coating method and can be achieved by means of UV photo irradiation, plasma, high energy irradiation and controlled polymerization [32-33]. Examples of different surface coating approaches are listed in Table 1.1.
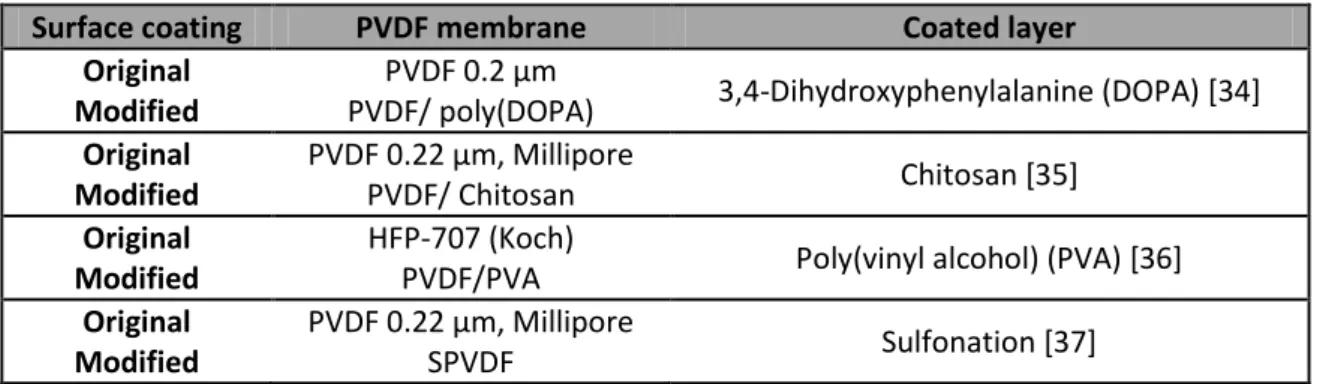
Table 1.1 PVDF membrane modified by surface coating
Surface coating PVDF membrane Coated layer
Original Modified
PVDF 0.2 µm
PVDF/ poly(DOPA) 3,4-Dihydroxyphenylalanine (DOPA) [34] Original
Modified
PVDF 0.22 µm, Millipore
PVDF/ Chitosan Chitosan [35]
Original Modified
HFP-707 (Koch)
PVDF/PVA Poly(vinyl alcohol) (PVA) [36] Original
Modified
PVDF 0.22 µm, Millipore
SPVDF Sulfonation [37]
10
Figure 1.5 Surface modification of PVDF porous membrane via poly(DOPA) coating and heparin immobilization [38]
Examples of versatile ways to modify PVDF membranes surface by surface grafting are listed in Table 1.2:
Table 1.2 PVDF membranes modified by surface grafting
Surface
coating PVDF membrane Monomer Grafting way
Original Modified
PVDF 0.65 µm, Millipore
PVDF-g-PEG Poly(ethylene glycol) (PEG) plasma [39] Original
Modified
PVDF
PVDF-g-PEGMA PEGMA
electron beam [40] Original
Modified
PVDF 0.45 µm, Millipore
PVDF-g-poly(2-vinylpyridine)
2-Vinylpyridine ATRP [41] Original
Modified
PVDF PVDF-g-PVP
N-vinyl-2-pyrrolidinone
(NVP) UV [42]
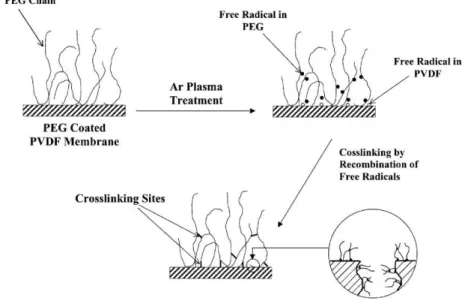
Figure 1.5 illustrates an example of a mechanism of plasma surface grafting of PEG onto PVDF membrane:
Figure 1.6 Schematic representation of the plausible mechanism of plasma grafting of PEG onto the PVDF
11 1.2 The Piezoelectric Biosensor
The piezoelectric biosensor, developed at CENIMAT, has a principle of operation identical to a QCM. This device uses a piezoelectric polymer film system made of PVDF, used to produce a mass sensitive oscillatory resonant device.
1.2.1 Operating Principal and Oscillating Circuit
A generic piezoelectric film is clamped between two pairs of electrodes, as shown in Figure 1.7. One set of electrodes acts as the transmitter and the other set as the receiver.
Figure 1.7 - A piezoelectric film clamped between two pairs of electrodes
In operation, a voltage signal is applied to the transmitter which launches a longitudinal acoustic wave through the film, due to the piezoelectric effect. When the wave reaches the other side, a charge is produced in the set of electrodes forming the receiver, due to the inverse piezoelectric effect. The acoustic wave is reflected and returns to the transmitter end where it is again reflected. An oscillatory resonant system can be obtained by driving again the transmitter at this precise time, resulting in the enhancement of the acoustic wave. The film will have a resonance frequency dependent on both its length and properties, given by Equation 1-1:
( )
Equation 1-1
where L is the length between the clamping electrodes, is the density of the film and is the elastic compliance.
12
Equation 1-2
where is the change in the original frequency produced by a change in density ρof Δρ. To express the bounded mass in terms of surface density, ngcm-2, the above equation can be easily changed to:
Equation 1-3
where is the added mass to the surface of the film with a surface mass of of the PVDF film expressed in the same units. The negative sign indicates that as increases the frequency decreases [17].
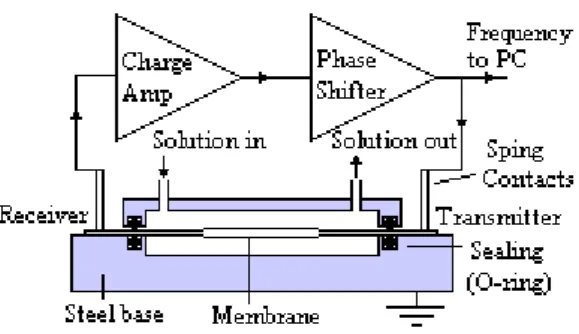
In order to obtain an oscillatory resonant device, this set-up must be connected to an appropriate electronic circuit, as shown in Figure 1.8:
Figure 1.8 Oscillator electronics schematic
The membrane can be totally immersed in a liquid solution and its extremities are left outside for electrical contacts. The oscillatory circuit is composed by the membrane (film), a charge amplifier and a phase shifter.
13 The output of the circuit is its frequency of oscillation, which is monitored by a frequency meter and register by a PC with appropriate software (eg. MATLAB, WaveStarTM).The voltage
signal applied to the transmitter is continuously monitored by an oscilloscope[43].
1.2.2 Polymer film system
The essence of this device is a polymer film system made of different forms of PVDF, namely a piezoelectric form and a porous form of PVDF: Immobilon, from Millipore Co. The polarized PVDF has good piezoelectric properties and it is responsible for the film mechanic oscillation while the porous forms of PVDF acts as a biosensitive area.
Figure 1.9 Polymer film system
A schematic of the fabrication process of both film systems is shown at Chapter 2 – Materials and Methods (2.4.4.3).
Although this film system has been applied successfully in protein detection experiments [43], it presents some irregularities in the junctions between PVDF and Immobilon and, consequently, improvements must be studied in order to minimize the noise in the output signal of the biosensor.
Immobilon Protective layer
14 1.3 Aims of the Work
The main goal of this project was to improve the film system applied to a Piezoelectric Biosensor, developed at CENIMAT [43-45]. A film system made of different forms of PVDF, namely a piezoelectric form and a porous form of PVDF has been utilized, where the polarized PVDF has good piezoelectric properties and is responsible for the film mechanic oscillation and the porous form of PVDF acts as a biosensitive area. As the constructed films presented some irregularities in the junctions between PVDF and Immobilon, a film system constructed only with PVDF was preferred.
15 Chapter 2 Materials and Methods
2.1 Instrumentation
Sessile drop experiments for the determination of the contact angles were carried out at room temperature with a CAM 200 optical contact angle and surface tension meter (KSV Instruments, Ltd.). The images were analyzed using the KSV CAM Optical Contact Angle and Pendent Drop Surface Tension Software Version 4.00. To reach the required pH for the buffer solutions a pH 211 microprocessor pH meter (HANNA Instruments) was used. To perform qualitative fluorescence assays, a Fluorescence Microscope Olympus BX 51 with an objective U-RFL-T (40x amplification), U-MWB (λ
exc= 460-490 nm; λem = 515 -570 nm), an Olympus
U-RFL-T lamp, an objective Uplam FLN, and Cell F software for monitoring, were used. Image J was utilised for analysis of data obtained from fluorescence microscopy. Incubation procedures were carried out in a IKA KS 4000 ic control Incubator shaker ( shaking incubator ) or using a Boekel Big SHOT III™ High Capacity Hybridization Oven Model 230402. Membranes were washed by centrifugation using a ScanSpeed Mini Personal Microcentrifuge. Solid reagents were weighed in anAcculab ATILON digital balance. FTIR spectra were performed in a Satellite FTIR Mattson Spectrometer. Absorbance and fluorescence intensity were measured on Tecan's Infinite®F200 multimode microplate reader. Black 96 well plate (flat bottom), 96 well transparent microplates (flat bottom) from Sarstedt and 96 well-UV star plate, half area, F-form from Greiner bio-one were used. When performing assays at the biosensor, the frequency of oscillation was registered by MATLAB® and WaveStar™ Software for Oscilloscopes.
2.2 Chemicals
PVDF Solef was obtained from Solvay and ImmobillonTM PVDF membranes were purchased
16 analytical grade and used without further purification. Deionized (DI) water was used for preparing solutions.
2.3 Chromatographic materials
PD-10 desalting columns were used for isolation of the labeled protein, BSA-FITC.
2.4 General Methods
2.4.1 Immersion method for surface coating/modification of hydrophobic PVDF membranes
Non-porous PVDF and Immobilon membranes were cut to 1 cm x 0.5 cm and each membrane was weighted. Each membrane was immersed in 1 ml of a solution, in a microtube, with gentle stirring for 24 hours, at room temperature. Then, the samples were washed thoroughly for 30 min with the respective solvent and dried in a vacuum excicator, at room temperature. The samples were characterized by water contact angle measurements, elemental analysis and qualitative and quantitative fluorescence assays were performed.
The solutions utilized for the immersion method are listed below:
DL-DOPA solution: The amount of DOPA was varied to obtain three DL-DOPA solutions
with different concentrations, a 2.0 g/L, a 3.0 g/L and a 15.0 g/L DOPA solution. DL-DOPA was dissolved in a mixture of Tris solution (10 mM, pH 8.5) and ethanol as solvent (Vtris:Vethanol=7:3).
PEG solution: 5 wt %, 9 wt % and 25 wt % PEG solutions were prepared by dissolving
PEG in chloroform or in DI water.
Gum Arabic solution: 40 mg/ml and 80 mg/ml Gum Arabic solutions were prepared, by
dissolving Gum Arabic in water, at 4°C.
In the specific case of Gum Arabic solutions, the PVDF membranes were immersed in solution, for 24 hours at 4°C, and not at room temperature
Negative control assays were also performed, by immersion of membranes in its respective solvents.
17
Table 2.1 Immersion solutions for positive and negative control
Positive Control Negative Control
DL-DOPA in Tris (10 mM, pH 8.5) Tris (10 mM, pH 8.5) Gum Arabic in DI water DI water PEG in chloroform / DI Water Chloroform / DI Water
2.4.2 Conjugation of BSA to FITC
2.4.2.1 Conjugation Procedure
The conjugation started by dissolving 5 mg of BSA protein in 1 ml of PBS buffer ( 15 mM sodium phosphate, 150 mM NaCl, pH 7.4) in a reaction vial labelled “5:1”. 1 mg of FITC was
added to 2 ml of 0,1 M carbonate-bicarbonate buffer pH 9 and vortexed until all FITC was dissolved (20:1 dilution). A 5:1 dilution of FITC in 0.1 M carbonate-bicarbonate buffer ( 0,25 ml of 20:1 solution + 0,75 ml of 0,1 M sodium carbonate-bicarbonate solution) was prepared. 250 µl of the 5:1 FITC dilution were added dropwise to the BSA solution, while stirring the reaction vial completely covered with aluminum foil to protect from light. The reaction mixture was incubated for 2 hours at room temperature with gentle stirring.
2.4.2.2 Isolation of labelled protein
A PD-10 column was supported over a suitable beaker. The cap was removed from the top of the column, the lower tip of the column was cut open and the excess of liquid was allowed to flow through. The column was equilibrated with 30 ml of PBS solution ( 15 mM sodium phosphate, 150 mM NaCl, pH 7.4) until the absorbance at 280 and 495 nm equalized zero. The reaction mixture (2.4.2.1) was then applied to top of the column gel bed and the flow through was collected (Fraction 1) in microtubes covered with aluminum foil to protect from light. The column was eluted with 10 ml of PBS, collecting 1.0 ml fractions (10 X 1 ml). The absorbance of each fraction was monitored at 280 nm and 495 nm. The fractions with A280>0,4 were pooled
18 2.4.2.3 Determination of Fluorescein/Protein Molar Ratio (F/P)
For the determination of the F/P ratio, it was necessary to first determine the absorbance of the conjugate sample (pool) (2.4.2.2) at 280 nm and then at 495 nm (dilution of 1:10). From the absorbance readings (A280 and A495) of the conjugate sample, the F/P of the FITC-BSA
conjugate was calculated according to the equation:
2.4.3 Characterization techniques
2.4.3.1 Water contact angle measurements
Water contact angle measurements were conducted to investigate the effect of the coating on the membrane hydrophilicity, using the sessile drop method measured by a contact angle goniometer.
A water droplet was deposited by a syringe pointed vertically down onto the PVDF membrane sample surface and an image was captured by a high resolution camera, which was analysed using an image analysis software.
2.4.3.2 Folin-Ciocalteu colorimetric assay
A PVDF membrane sample was placed on a filter paper and it was pulverized with Folin-Ciocalteu reagent.
2.4.3.3 Coomassie Brilliant Blue staining of BSA proteins on PVDF
A CBB solution (0.5 % Coomassie brilliant blue, 40 % methanol, 10 % acetic acid in milli-Q water) and a destaining solution (30 % methanol and 10 % acetic acid in milli-Q water) were prepared in advance.
19 2.4.3.4 BSA-FITC labeling of functional groups
2.4.3.4.1 Labeling of free hydroxide groups present in PVDF coating
After performing the immersion method, epoxy groups were introduced by means of the reaction between the hydroxide groups present in PVDF coating, with epichlorohydrin. A volume of 0.6 ml of DI water and 0.4 ml of 10 M NaOH were added to each microtube, containing a PVDF membrane (0.5 cm X 0.5 cm). Then, 72 µl of epichlorohydrin were added and the microtubes were incubated for 2 hours at 34 °C with orbital shaking. After incubation, the membranes were washed 10 times with DI water.
A volume of 100 µl of BSA-FITC conjugated (0.5 mg/ml), prepared as described at 2.4.2, and 400 µl of PBS buffer (15 mM sodium phosphate, 150 mM NaCl, pH=7.4) were added to each microtube containing a membrane. The samples were incubated overnight at 35 °C. At the end of the incubation period, the samples were washed 5 times with PBS buffer and the respective washes were kept for posterior absorbance reading.
Figure 2.1 BSA-FITC labelling of free hydroxide groups
A calibration curve of BSA-FITC solution was performed and the absorbance of the washes was measured, at 280 nm and 495 nm. The control experiments preformed are summarized at Table 2.2.
Table 2.2 Control Experiments for –OH labelling with BSA-FITC
Control experiments
Positive control - P Step 1, Step 2, Step 3 Negative control - N1 Step 1, Step 3 Negative control – N2 Step 2, Step 3 Negative control – N3 Step 3 Negative control – N4 Pristine PVDF
PVDF
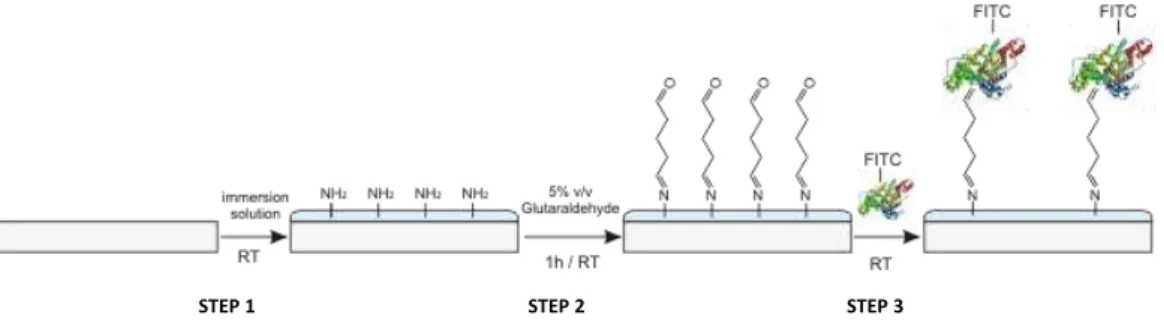
20 2.4.3.4.2 Labeling of free -NH2 groups present in PVDF coating
After performing the immersion method, a volume of 1 ml of 5 % (v/v) glutaraldehyde in PBS solution was added to each microtube, containing a PVDF membrane (0.5 cm X 0.5 cm) with NH2 groups present in its coating and then, it was incubated for 1 hour at room temperature,
with gentle stirring. After incubation, the membrane was washed 3 times with 1 ml of PBS buffer.
A volume of 100 µl of BSA-FITC conjugated (0.5 mg/ml), prepared as described at 2.4.2, and 400 µl of PBS buffer (15 mM sodium phosphate, 150 mM NaCl, pH=7.4) were added to each microtube tube containing a membrane. The samples were incubated for 1 hour at room temperature, with gentle stirring. At the end of the incubation period, the samples were washed 3 times with PBS buffer and kept in PBS to posterior fluorescence characterization.
Figure 2.2 BSA-FITC labelling of free amine groups
The control experiments preformed are summarized at Table 2.3.
Table 2.3 Control Experiments for –NH2 labelling with BSA-FITC
Control experiments
Positive control –P’ Step 1, Step 2, Step 3 Negative control –N’1 Step 1, Step 3 Negative control –N’2 Step 2, Step 3
Negative control –N’3 Step 3
Negative control –N’4 Pristine PVDF
21 2.4.4 Piezoelectric Biosensor experiments
2.4.4.1 Equipment’s instructions
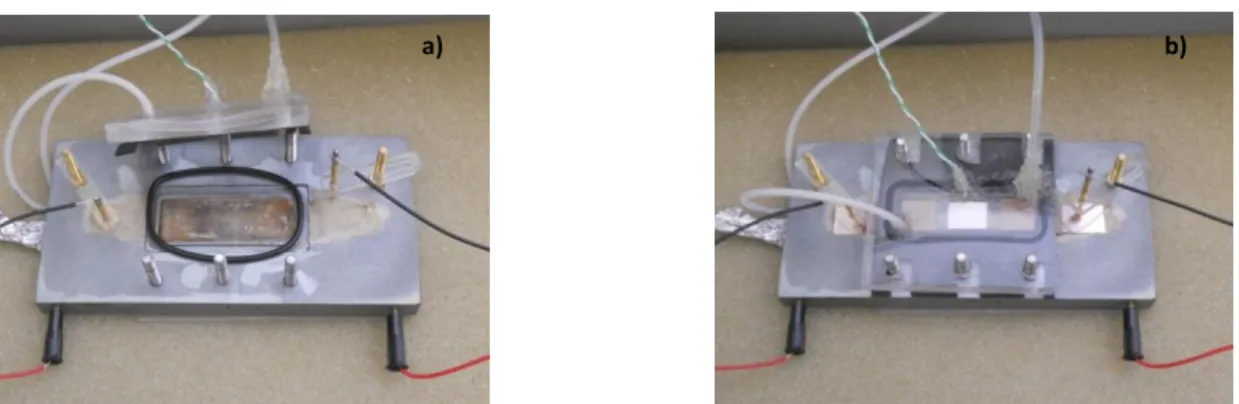
The film system is placed in the reaction chamber and the chamber is placed inside the biosensor’s box. The temperature sensor is connected to the oscilloscope and the thermocouple is connected to the base of the biosensor. The heating unit and the temperature controller are turned on. The tubing is connected to the peristaltic pump and the pump is
turned on pressing the “START” button to fill the reaction chamber with the chosen solution.
During this process, the reaction chamber must be slightly sloped. The electrodes are connected to the film system and the power supply is turned on. The frequency meter, the
oscilloscope, the amplifier ( x 50) and the charge amplifier are turned on. The “OPERATE”
button of the charge amplifier is turned on. The WaveStarTM Software for Oscilloscopes is used
to capture frequency and temperature measurements and save the experimental data. When an experiment is concluded, the “OPERATE” button of the charge amplifier is turned off and the connections to the film system are disconnected. The thermocouple is disconnected to the base of the biosensor and both heating unit and temperature controller are turned off. The reaction chamber is emptied with the peristaltic pump and the reaction chamber is sloped during this process. DI water is allowed to flow through the tubing in order to wash the tubing and the chamber. Further cleaning of the chamber occurs when the film system is removed.
Figure 2.3 a) Opened reaction chamber b) Film system placed inside the reaction chamber
22
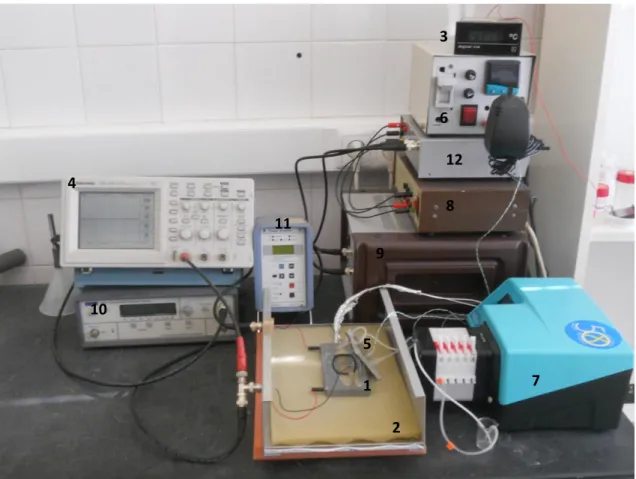
Figure 2.4 Piezoelectric Biosensor apparatus
Legend:
1 – Reaction chamber 7 – Peristaltic pump
2 –Biosensor’s box 8 – Power source
3 – Temperature sensor 9 – Amplifier
4 – Oscilloscope 10 – Frequency meter
5 – Thermocouple 11 – Charge amplifier
6 – Temperature controller 12 – Phase shifter
3
6
7 8
9
1
2 4
5 10
11
23 2.4.4.2 General procedure for experiments at the piezoelectric biosensor
Firstly, the reaction chamber was filled with water (or the respective solution solvent, e.g. PBS buffer for BSA assays). After stabilizing the temperature at 30 °C, the sensor oscillated for a few minutes, only with H2O in the chamber. At this stage, there was no flux in the chamber.
Then, 1ml of a solution was allowed to flow at a flow rate of 0.17 ml/min, for a period of 30 min (Figure 2.5), in closed circuit (Figure 2.5).
Figure 2.5 Closed circuit scheme for input of solution
After that period, the flux was stopped and the frequency was allowed to stabilize. Then, a washing procedure with water ( or the respective solution solvent, e.g. PBS buffer for BSA) was carried out, for 20 min in open circuit, as shown in Figure 2.6.
24 For every stage of the described procedure, the frequency of oscillation was acquired via MATLAB® and WAVESTARTM software.
2.4.4.3 Film system preparation
The polymer film system was made with different forms of PVDF, namely a piezoelectric form and a porous form of PVDF, Immobilon, which can have different porosity: ImmobilonP (0.45 µm) and ImmobilonPSQ (0.2µm). Figure 2.7 shows a schematic of the fabrication process of both
film systems:
Figure 2.7 Fabrication process of the polymer film systems Central part cut off
PVDF strip
a)
b)
c)
Nickel-Copper electrodes on both faces
Nickel-Copper electrodes etched off on both faces
Immobilon membrane thermally ‘glued’
25 At first, a polarized PVDF strip was cut into the intended dimensions (Fig. 2-7a). The central part of the electrodes was then etched off on both faces of the strip (Fig.2-7b). After cutting off part of the central area (Fig.2-7c), a piece of Immobilon was thermally glued to this central part at a suitable temperature, while a small pressure was being applied at the seams between PVDF and Immobilon (Fig.2-7d). Experiments were carried out with two different types of polymer film systems: a PVDF film system (Fig.2-7b) and a PVDF/Immobilon/PVDF film system (Fig.2-7d).
Figure 2.8 Area of immersed film
As it can be seen in Figure 2.8, a small area of electrodes (in grey) will be in contact with solution. In order to avoid that the electrodes are corrupted quickly, a protection is needed. Therefore, a plastic layer is placed on top of the electrodes. The final appearance of both film systems is shown in Figure 2.9.
Figure 2.9 a) PVDF film system b) PVDF/Immobilon/PVDF film system, with plastic layer protection
Area of immersed film
Plastic layer Area of immersed film
a)
26 Chapter 3 Surface modification of PVDF
3.1 Introduction
In order to study the possible formation of coatings onto PVDF films, containing functional groups, experiments were carried out with three distinct solutions, using the following compounds: DOPA, Gum Arabic and PEG.
DOPA is an important component of mussel adhesive proteins (MAPs). DOPA and its derivatives were reported to exhibit powerful interfacial adhesion strength and recently it has been used to perform surface modification for both organic and inorganic materials. In particular, the strong adhesive behavior of poly(DOPA) on microporous PVDF has been reported [34, 38].
DL-DOPA was used to study the possible formation of an adhesive DOPA coating onto PVDF films. As shown in Figure 3.1, DL-DOPA contains reactive groups that can provide an important platform for further surface functionalization.
Figure 3.1 Chemical structure of DL-DOPA
Polyethylene glycol (PEG) is a polyether compound with many applications, commercially available over a wide range of molecular weights from 200 g/mol to 10,000,000 g/mol. While PEGs with different molecular weights find use in different applications and have different physical properties due to chain length effects, their chemical properties are nearly identical. PEG has unique properties such as hydrophilicity, flexibility, nontoxicity and non-immunogenicity, which make it appropriate to be used for coatings, creating a hydrophilic biocompatible layer on a wide variety of surfaces (ex. polymers, magnetic nanoparticles, etc.).
27 Gum Arabic (GA), the gum exudate from stems and brunches of Acacia trees, is extensively used in food, pharmaceuticals and cosmetics industry because of its unique properties like emulsification, film forming, and encapsulation [46-47]. GA is a branched-chain, complex polysaccharide, either neutral or slightly acidic, and it has been described as a complex mixture of calcium, magnesium and potassium salt of a polysaccharidic acid (arabic acid), with rhamnose and glucuronic acid end units and containing a small proportion (ca. 2%) of protein [48-49].
An immersion method for PVDF coating surface modification was applied to three different types of PVDF: a non-porous type of PVDF and two different microporous PVDF (known as Immobilon) with 0.2 µm and a 0.45 µm porous size. For each type of PVDF, the concentration of DOPA, PEG and Gum Arabic solutions was varied. As DOPA, PEG and GA are hydrophilic compounds, its immobilization at the membranes would raise the number of functional groups which have affinity to water, originating more hydrophilic membranes, that could provide an important platform for further functionalization.
3.2 Results and Discussion
3.2.1 Surface modification PVDF with different porosity (non-porous, 0.2 µm and 0.45 µm)
by immersion method in DL-DOPA, PEG and Gum Arabic solutions
3.2.1.1 Water contact angle measurements
After performing the immersion method (2.4.1), the changes of PVDF surface hydrophilicity were evaluated by water contact angle measurements. The results are showed in Table 3.1.
Table 3.1 PVDF hydrophilicity evaluation for different coating solutions and porous type
Water contact angle (°)
Coating solution Non-porous PVDF 0.2 µm PVDF 0.45 µm PVDF Pristine PVDF 94 ± 6 105± 4 103 ± 6
3.0 g/L DOPA 75 ± 7 112 ± 9 110 ± 9
15.0 g/L DOPA 77 ± 5 99± 12 101 ± 12
5 wt % PEG 61 ± 3 63 ± 2 88 ± 3
9 wt % PEG 56 ± 11 80 ± 2 71 ± 10
25 wt % PEG 64 ± 3 78 ± 3 89 ± 2
40 mg/ml GA 68 ± 4 94 ± 1 94 ± 12
80 mg/ml GA 64 ± 8 85 ± 3 83 ± 11
28
Figure 3.3 Water contact angle results
The results for water contact angle measurements confirmed that pristine non porous PVDF, 0.2 µm and 0.45 µm PVDF membranes have a hydrophobic surface, with contact angles higher than 90° (94 ± 6°, 105 ± 4° and 103 ± 6°, respectively).
When 3.0 g/L and 15.0 g/L DOPA solutions were used, it can be observed that hydrophilicity improvements were only verified for the non porous PVDF, where the water contact angle decreased from about 94° to approximately 75° and 77°, respectively. To both porous types of PVDF, water contact angle measurements remained higher than 90°, i.e., the membranes maintained a hydrophobic surface. Considering that DOPA molecules are very small, it is possible that a certain amount of DOPA could be immobilized only inside the porous of the membranes and not at its surface. Therefore, the surface hydrophobic character would not be modified for porous membranes.
The results depicted in Table 3-1 show that the highest hydrophilicity improvements were obtained with PEG solutions, for each of the three types of PVDF. For non porous PVDF, it is observed that the water contact angle decrease is similar, independently to the increase of concentration of PEG. This can be due to the type of interaction between the molecules and the surface, which is believed to be only electrostatic. When comparing the porous membranes, it can be seen that except for 9 wt % PEG, it was for the 0.2 µm PVDF that the best hidrophilicity improvements were obtained. This can be related to the porous size of the
0 20 40 60 80 100 120 140 Pristine PVDF 3.0 g/L DOPA 15.0 g/L DOPA
5 wt % PEG
9 wt % PEG
25 wt % PEG 40 mg/ml GA 80 mg/ml GA Wate r c o n tac t an g le ( °) Coating solution Non-porous PVDF
0.2 µm PVDF
29 membranes. For higher porous size (0.45 µm) it is possible that a higher amount of PEG molecules can be immobilized at the bulk of the membrane and less at the surface, when compared to 0.2 µm porous size membrane. Results for 9 wt % should be repeated. Also, it with be interesting to perform more assays with different concentrations of PEG, using different types of porous membranes, in order to better understand the relation between the increase of concentration of PEG according to the porous size of the membrane and its impact in hydrophilicity improvements.
For the Gum Arabic solutions, improvements were only considerable when the non porous PVDF membranes were used, with a decrease of 94° to about 68° and 64° to the 40 mg/ml and 80 mg/ml GA solutions, respectively.
It is believed that the surface hydrophilicity improvements obtained when non porous PVDF was used, for all the solution, can be due to electrostatic interactions between the coating compounds and its surface.
In summary, the highest surface hydrophilicity improvements were obtained when PEG solutions were utilized, for each of the three types of PVDF: non-porous, 0.2 µm and 0.45 µm PVDF. Particularly, the best results were obtained when non porous PVDF samples were immersed in PEG solutions and when a 5 wt % PEG solution was utilized with 0.2 µm porous size membrane.
It can be observed that, in some cases, the experimental error obtained was high, which could be caused by a non uniform coating onto the surface of the samples, for example, or irregularities at the samples. Also, water contact angle measurements can be difficult to interpret the porous membranes because of capillarity forces within pores and roughness. Studies about time dependence of water contact angle on the porous membranes should be performed better evaluate hydrophilicity improvements.
3.2.1.2 Elemental microanalysis results
30 Non-porous PVDF results show that there was no significant change in the composition of the immersed samples when compared to pristine PVDF membranes. For PVDF membranes with a porosity of 0.2 µm it can be seen that there was a variation on the percentage of carbon and hydrogen, when PEG solutions were utilized, when compared to pristine 0.2 µm PVDF (% C = 39.38 and % H = 3.08). It is observed that the % H increases with the increase of concentration of PEG solution, which indicates that the amount of incorporated PEG increases with the increase of PEG concentration. In the specific case of 5 wt % PEG solution, both percentages of hydrogen and carbon increased, after the immersion procedure. For both 9 wt % and 25 wt % PEG solutions, a similar behavior would be expected, however, their correspondent percentages of carbon decreased to 29.57 % and 31.28 %, respectively, while the amount of hydrogen increased. In fact, it can be seen that for the 25 wt % PEG solution the percentage of hydrogen was raised to more than the double when compared to the 0.2 µm PVDF control. The results for these two membranes were unexpected. It is believed that there could have been a problem with these samples, related with their handling during the experimental work or to the elemental analysis procedure and, consequently, these analysis should be repeated. When using the 0.45 µm PVFD membranes, there was an increase of both carbon and hydrogen percentages, correspondent to the utilization of 9 and 25 wt % PEG solutions, which might indicate that a certain amount of PEG was incorporated at this type of PVDF.
When Gum Arabic and DOPA solutions were used, there were no remarkable variations on the elemental composition of the samples, for the three types of PVDF. In the specific case of DOPA, the atomic percentage of nitrogen remained null, indicating that there was no DOPA coated at the surface of the samples or immobilized in the bulk of the porous membranes.
31
Table 3.2 Elemental microanalysis comparisons between DOPA, Gum Arabic and PEG modified PVDF with different porosity
PVDF porosity Samples Nitrogen % Carbon % Hydrogen %
Non-porous
Unmodified PVDF 0.00 41.91 3.36
3.0 g/l DOPA solution 0.00 39.63 3.75
15 g/l DOPA solution 0.00 39.43 3.01
5 wt % PEG solution 0.00 40.44 3.66
9 wt % PEG solution 0.00 41.31 3.63
25 wt % PEG solution 0.00 40.50 3.50
40 mg/ml Gum Arabic solution 0.00 43.00 3.63
80 mg/ml Gum Arabic solution 0.00 39.51 3.60
0.2 µm
Unmodified 0.2 µm PVDF 0.00 39.38 3.08
3.0 g/l DOPA solution 0.00 39.35 3.76
15 g/l DOPA solution 0.00 39.70 3.79
5 wt % PEG solution 0.00 43.25 4.81
9 wt % PEG solution 0.00 29.57 5.96
25 wt % PEG solution 0.00 31.28 6.77
40 mg/ml Gum Arabic solution 0.00 39.22 3.63
80 mg/ml Gum Arabic solution 0.00 39.41 3.34
0.45 µm
Unmodified 0.45 µm PVDF 0.00 39.72 3.13
3.0 g/l DOPA solution 0.00 39.53 3.76
15 g/l DOPA solution 0.00 39.33 3.63
5 wt % PEG solution 0.00 40.22 3.53
9 wt % PEG solution 0.00 43.03 4.88
25 wt % PEG solution 0.00 44.91 5.54
40 mg/ml Gum Arabic solution 0.00 39.49 3.31
32 3.2.1.3 Conclusions
In an overall observation, it can be verified that the most considerable water contact angle decreases were obtained when PEG solutions were utilized for each of the three types of PVDF membranes, suggesting that surface hydrophilicity improvements were achieved.
However, the surface hydrophilicy results obtained by water contact angle measurements were not entirely supported by elementary microanalysis. For example, when non porous PVDF was used, there were no significant changes on the composition of the membranes, on the contrary to what would be expected considering the water contact angle results, where decreases (hydrophilicity improvements) were registered for all solutions applied.
Results were in accordance for the following systems: 5 wt % PEG – 0.2 µm PVDF and 25 wt % PEG – 0.45 µm PVDF, where both carbon and hydrogen percentages increased after performing the immersion procedure. In the case of 9 wt % PEG – 0.2 µm PVDF and 25 wt % PEG – 0.2 µm PVDF, the amount of hydrogen was considerably raised, although, the carbon amount inexplicably decreased.
33 3.2.2 Quantitative and qualitative study of BSA-FITC adsorption at modified/coated PVDF
membranes
Fluorescein isothiocyanate (FITC) is widely used to attach a fluorescent label to proteins, reacting with amino terminal and primary amines in proteins. As described at 2.4.3.4, FITC was used for the labeling of BSA, to be further coated on PVDF surfaces. In order to remove unbound BSA-FITC from the surface of PVDF membranes, the membranes were washed with PBS buffer and the washes were kept. The absorbance of the washes was read directly in a microplate reader to quantify the amount of BSA-FITC that was unbounded to the surface of the samples and the samples were observed with a fluorescence microscope. Positive and negative control experiments are summarized in Table 3.3 or in more detail in Table 2.2 Control Experiments for –OH labelling with BSA-FITC and Table 2.3 Control Experiments for –
NH2 labelling with BSA-FITC.
Table 3.3 Control experiments for labelling assays with BSA-FITC (X = step preformed)
Control experiments
Pristine PVDF
membrane Coating solution
Epoxyactivation or
Glutaraldhyde BSA-FITC
P X X X X
N1 X X - X
N2 X - X X
N3 X - - X
N4 X - - -
P-Positive control, N-Negative control
3.2.2.1 Quantitative determination of unbounded BSA-FITC onto the surface of PVDF
The results for the amount of BSA-FITC unbounded onto PVDF samples are shown in Figure 3.4, according to the type of PVDF used and coating solution.
N4 P N1 N2 N3 0 0,02 0,04 0,06 0,08 0,1 0,12 PEG
200 DOPA GA PEG
200 DOPA GA PEG
200 DOPA GA
PVDF 0.2 µm 0.45 µm Σ washes ( mg )
Porosity and Coating solution
N4
P
N1
N2
34
Figure 3.4 Comparison between the amount of BSA-FITC unbounded onto PVDF surface according to the porosity type and coating solution.
As observed, the results for all N4 samples (pristine PVDF) were null. BSA-FITC was not used and, therefore, the absorbance was zero, as it was expected. When comparing N3 results, it can be seen that the amount of BSA unbounded is higher for PVDF than for both Immobilon types of PVDF. Without surface modification, PVDF does not have the ability to immobilize protein, although, porous PVDF membranes show that capacity. The results indicate that 0.2 µm membranes have a higher protein adsorption capacity and a higher retention than 0.45 µm membranes. In fact, in literature, it can be found that 0.45 µm has a BSA binding capacity of 215 µg/cm2 and 0.2 µm has a BSA binding capacity of 340 µg/cm2. The same behavior was observed when N2 control was performed, although, the amount of BSA unbounded was lower than for N3 control. This can indicate that the use of epicholorohydrin or glutaraldhyde can contribute to the improvement of BSA adsorption to PVDF surface, through the establishment of covalent bonds.
When observing N1 control, it can be seen that, in the case of PVDF samples, the amount of unbounded BSA-FITC was lower that for N2 and N3. This might indicate that the existence of a coating compound at the surface of the membranes improved the ability of BSA to be physically adsorbed to the membranes. In the case of 0.2 µm, the possible existence of a coating compound seems to have no significant influence when compared to N3 control, when DOPA and Gum Arabic solutions were used. As for PEG, improvements can be visualized comparing to N3 but when compared to N2, the change was not significative indicating that both PEG and epichlorohydrine have a similar influence on the immobilization of protein. For 0.45 µm, the results obtained for N1 for all three coating compounds were identical to N3, meaning that whether the coating compound were not successfully attached to the membranes or that its presence does not improve the immobilization of BSA to the membranes. Positive control experiments related with PVDF do not show a considerable variation to N1. This can be justified by a possible unsuccessful attachment of epicholohydrine or glutaraldehyde to the coating compound, and consequently, results are similar to N1. Positive controls for 0.2 µm show the lowest values obtained for unbounded BSA, however, similar to N2 which is indicative of the unspecific binding of BSA to the membrane.
35 3.2.2.2 Fluorescence Microscopy study of BSA-FITC adsorption onto PVDF
The fluorescence microscopy study of BSA-FITC adsorption at PVDF membranes was performed in order to qualitatively assess if there was BSA-FITC coated at the surface of the membranes, in accordance to the results obtained by the quantitative method presented above. The fluorescence photographs were taken with exposure periods of 500 ms, the time necessary for the observation of the BSA-FITC solution alone.
Firstly, it was important to verify if pristine PVDF membranes, per se, presented background fluorescence. While observing N4 control samples (pristine), it was found that non porous PVDF and the 0.2 µm pore size PVDF membrane did not present background fluorescence, whereas 0.45 µm pore size PVDF (Immobilon-P) showed high background fluorescence and, therefore, it was not adequate for use with fluorescence probes (Table 3.4 , Figure 3.5). As a consequence, the results obtained for 0.45 µm pore size PVDF were compromised and will not be considered at this stage for discussion. The possibility of a contamination was raised, although several confirmation experiments were preformed with pristine membranes from different sheets which were not kept near a possible source of FITC, always presenting a similar result for background fluorescence. Also, in literature, a reference was found referring to similar experimental observations when using these types of membranes for fluorescence probes.
Table 3.4 Fluorescence microscopy results for pristine membranes (N4)
Control Type of PVDF Black and White Fluorescence
N4
PVDF
0.2 µm
36
PVDF 0.2 µm 0.45 µm
Figure 3.5 Fluorescence background of PVDF membranes
When visualizing N3 samples, it can be seen that non porous PVDF exhibits some fluorescence at the margins of the sample. Probably, a small amount of BSA-FITC was retained at its margins as a consequence of irregularities of the cut of the sample. Absorbance results indicated that there was a higher amount of unbounded BSA-FITC to PVDF than to 0.2 µm membrane. The results are confirmed by fluorescence microscopy, as it can be seen that PVDF show lower fluorescence than 0.2 µm sample (Table 3.5).
Table 3.5 Fluorescence microscopy results for N3 control
Control Type of PVDF Black and White Fluorescence
N3
PVDF
0.2 µm
37
Table 3.6 Fluorescence microscopy results for N2 control
Control Type of PVDF Black and White Fluorescence
N2
PVDF
0.2 µm
Fluorescence microscopy results for N1 and P control are presented in Table 3.7. Considering the quantitative results for unbounded BSA-FITC, where there was no significative variation of results for N1 and P controls to PVDF assays, similar microscopy results were also expected. As before, for all fluorescence microscopy experiments with PVDF, fluorescence is only present at the margins of PVDF samples and not at its surface.
Actually, the highest microscopy fluorescence result was obtained for the positive control, when PEG was utilized at a 0.2 µm microporous membrane. When DOPA and GA were used, positive control showed an improvement of fluorescence at the surface, although, when N1 was performed, there was no fluorescence at all.
38
Table 3.7 Fluorescence microscopy results for N1 and Positive control P
N1 control P control
Coating
solution
Type
of
PVDF
Black and White Fluorescence Black and White Fluorescence
PEG
PVDF
0.2 µm
DOPA
PVDF
0.2 µm
GA
PVDF
39 Previous water contact angle measurements revealed that hydrophilicity improvements were achieved when utilizing PEG as coating solution for 0.2 µm membranes. Also, elementary microanalysis revealed that, after the immersion method, the amount of carbon and hydrogen had significant variations. Both characterization techniques indicated that PEG was successfully immobilized to 0.2 µm membranes, although, information about how it was immobilized could not be given by these two techniques. It was more likely that PEG was physically adsorbed to its surface or entrapped inside its porous. Both quantitative and qualitative results obtained for fluorescence assays with PEG and 0.2 µm membranes, reveal that the lower amount of unbounded BSA-FITC was obtained when the positive control procedure was executed (Figure 3.6). Fluorescence microscopy image confirmed that there was a high amount of BSA-FITC at the sample. Thus, it is believed that the positive control procedure was effectively achieved, promoting the specific binding of BSA to the epichlorohydrin bound to PEG, although some unspecific immobilization of BSA must not be set aside.
40 Chapter 4 The Piezoelectric Biosensor
4.1 Results and Discussion
According to the results obtained for surface modification of PVDF the PVDF/ImmobilonPSQ (0.2
µm)/PVDF film system was selected to be studied at the biosensor. Also, the sensor itself was used as a “characterization technique” to support the results presented above. Unfortunately, the use of epichlorohydrine and solvents such as chloroform were not compatible with the biosensor construction material, therefore, control experiments such as P and N2 could not be applied to the sensor.
Taking these limitations in consideration and the results obtained above, it was chosen to test the response of the sensor to a PEG solution and BSA solution. The response of the biosensor was registered by measuring the frequency output during the experiments.
4.1.1 Detection of PEG and BSA using a PVDF/ImmobilonPSQ (0.2 µm)/PVDF film system
The following experiments were performed with a PVDF/ImmobilonSQ (0.2 µm)/PVDF film system. Although it is known that the time axis would preferably be in minutes or hours, the frequency results are given as a function of time in seconds, to allow a better visualization of the frequency output acquired during the experiments.
Experiment A.1
Figure 4.1 Detection of PEG and BSA using a PVDF/0.2um/PVDF film system 22200 22250 22300 22350 22400 22450 22500 22550
0 2000 4000 6000 8000 10000 12000 14000 16000 18000
Fr e q u e n cy (H z) Time (s)
ImmobilonSQ whithout methanol pre-treatment
~100 Hz PEG input BSA input ~200 Hz ~200 Hz ~50 Hz Washing Washing