______________________________________
1 Prof. Associado I, Departamento de Engenharia, Universidade Federal de Lavras (UFLA), Lavras - MG.
2 Engo Agrícola, Doutorando em Engenharia Agrícola, Departamento de Engenharia, Universidade Federal de Lavras (UFLA),
Lavras - MG.
3 Matemático, Doutorando em Estatística e Experimentação Agropecuária, Departamento de Ciências Exatas, Universidade Federal
de Lavras (UFLA), Lavras - MG.
4 Zootecnista, Doutoranda em Engenharia Agrícola, Departamento de Engenharia, Universidade Federal de Lavras (UFLA), Lavras
-MG.
5 Professor Adjunto III, Departamento de Ciências Exatas, Universidade Federal de Lavras (UFLA), Lavras - MG.
Recebido pelo Conselho Editorial em: 14-6-2010
TADAYUKI YANAGI JUNIOR1, LEONARDO SCHIASSI2, DIOGO F. ROSSONI3,
PATRÍCIA F. PONCIANO4, RENATO R. DE LIMA5
ABSTRACT:The knowledge of the spatial variability of noise levels and the build of kriging maps can help the evaluation of the salubrity of environments occupied by agricultural workers. Therefore, the objective of this research was to characterize the spatial variability of the noise level generated by four agricultural machines, using geostatistics, and to verify if the values are within the limits of human comfort. The evaluated machines were: harvester, chainsaw, brushcutter and tractor. The data were collected at the height of the operator's ear and at different distances. Through the results, it was possible to verify that the use of geostatistics, by kriging technique, made it possible to define areas with different levels for the data collected. With exception of the harvester, all of machines presented noise levels above than 85 dB (A) near to the operator, demanding the use of hearing protection.
KEYWORDS: human environment, acoustic comfort, occupation health, geostatistics.
VARIABILIDADE ESPACIAL DO NÍVEL DE RUÍDO EM MÁQUINAS AGRÍCOLAS
RESUMO: O conhecimento da variabilidade espacial de níveis de ruído e a construção de mapas de krigagem podem auxiliar na avaliação da salubridade de ambientes ocupados por trabalhadores agrícolas. Portanto, este trabalho teve como objetivos caracterizar a variabilidade espacial do nível de ruído gerado por quatro diferentes máquinas agrícolas, utilizando a geoestatística, e verificar se os valores se encontram dentro dos limites de conforto humano. As máquinas avaliadas foram: derriçadora, motosserra, roçadora e trator. Os dados foram coletados na altura média do ouvido do operador e em diferentes distâncias. Por meio dos resultados obtidos, foi possível verificar que o uso da geoestatística, através da técnica de krigagem, possibilitou definir áreas com diferentes níveis para os dados coletados. Excetuando a derriçadora, todos os outros equipamentos apresentaram níveis de ruído acima de 85 dB(A) próximo ao operador, demandando o uso de protetores auriculares.
INTRODUCTION
Concern for the welfare of workers is directly based on factors that allow the work with safety and a greater degree of comfort. The agro-industry workers are exposed to risks to their physical and psychological integrity, which may result in his dismissal from the company for considerable periods of time, damaging them and causing damage to businesses as well (SAMPAIO et al., 2007). Noise is one of the most common harmful physical agents found in work places. Unlike other types of pollution, noise pollution leaves no visible traces of its influence on the environment. That is, after the air pollution and water, the environmental problem which affects many people (NASCIMENTO et al., 2007).
Given this, the noise as unwanted factor to humans has been receiving more attention. Increasing emphasis on air pollution, water pollution and environmental quality in general, created the need to examine the acoustic environment that surrounds the man, especially in the work place (MINETTE et al., 2007; DAMASCENO et al., 2008; BRAVALHERI et al., 2010).
According to the Regulatory Standard NR-15 (1990), in Annex No.01 (Limits of tolerance for continuous or intermittent noise), the levels of continuous or intermittent noise should be measured in decibels (dB) with an instrument of sound pressure level operating in the compensation circuit "A" and slow response circuit, and the readings should be taken close to the ear of the worker. The maximum intensity of exposure to salubrious conditions for people working daily is 8 hours with a level of 85 dB (A) and 7 minutes to noise level of 115 dB (A), and it is not allowed the exposure to noise levels above this limit for individuals who are not adequately protected, it may provide serious or imminent risk to them.
CUNHA & TEODORO (2006) evaluated the noise caused by agricultural machines and concluded that the transactions were extremely uncomfortable for the operator. Even with the use of hearing protection may still be noticeable health risks. RODRIGUES et al. (2006) evaluated the effectiveness of small, medium and large protectors and concluded that to fulfill their role; they need to be specific in size for each worker.
One way to assess and characterize the noise in the work place is through the use of geostatistics. This basically consists in geospatial modeling allowing interpolation by kriging and with the advantage of providing accurate contour maps (VIEIRA, 2000; MACHADO et al., 2007).
Given the above, this study aimed to assess the level of noise from farm machinery and using geostatistics to characterize the structure and magnitude of spatial dependence of noise levels, in order to evaluate the comfort of workers.
MATERIAL AND METHODS
The experiment was conducted in Lavras, Minas Gerais; with geographical coordinates 21° 14'S latitude, 45° 00' W longitude, altitude 918.8 m. Data were collected in an area free of obstacles, with dimensions of 45.0 x 90.0 m, with all the surrounding vegetated with bamboo species Bambusa vulgaris and soil covered with Bahia grass (Paspalum notatum).
The machines evaluated were: agricultural tractor, engine model AGCO Sisu Power maximum power of 62.5 kW at 2200 rpm and 3-aspirated cylinder; agricultural chainsaw, engine
with maximum power of 2.6 kW at 13,500 rpm and 50.2 cm3 of displacement, motorized backpack
brushcutter, engine with maximum power of 2.0 kW at 12,000 rpm and 39 cm3 of displacement;
portable harvester, engine with maximum power of 1.3 kW at 12,300 rpm and 30.8 cm3 of
displacement.
The evaluations were performed according to methodology described in the NBR-9999 (ABNT, 1987) in which the temperature should be between -5 and 30 °C and wind speed must be
circuit and of equalization "A", expressed in dB (A), and the draft shield of decibelimeters was used in all measurements.
Readings were taken at the height of the operator's ear and one meter in circumference equidistant to the edge of the sample area with a radius of 22 meters. In each circle were distributed 12 registered sensors equally spaced, and the collection time in each circle was 1 minute 1 second interval between collections, totaling 60 repetitions per circumference (Figure 1), according to the methodology proposed by BAESSO et al. (2008) and MION et al. (2009). By studying changes in the level of noise as a function of radius distance, it was possible to determine the noise levels to which operators and also workers are subject near the machines.
C
oorde
na
tes
y (m)
20 20
10
0
-10
-20
-20 -10 0 10 20
Legenda:
Máquina avaliada
Ponto de coleta de dados
30º
Coordenates x (m)
FIGURE 1. Lay-out of the experimental area.
The spatial dependence was analyzed by means of adjustments semivariograms (VIEIRA, 2000), assuming the intrinsic hypothesis. The semivariance was estimated by (eq.(1)):
N(h)
21 i
i
i Z x h
x Z 2N(h)
1 h
γˆ
(1) In which,
ŷ(h) - estimated semivariance between pairs of points Z(xi) and Z(xi + h), observed in xi e xi +
h,
N(h) - number of pairs of experimental observations Z(xi) e Z(xi + h), separated by distance h.
The semivariance estimates ˆ
h were graphed as a function of the values of h, resulting inthe experimental or empirical semivariogram. The semivariogram characterizes the behavior of the spatial dependence of the studied phenomenon (SANTOS, 2010). From the experimental semivariogram proceeded to fit a theoretical model to the values calculated, from which parameters
were estimated from the theoretical model for semivariogram, called nugget effect, C0; level, C; and
range, a.
According to McBRATNEY and WEBSTER (1986), the nugget effect is an important parameter of the semivariogram, and indicates the variability is not explained, taking the shortest distance of a sample used. The level indicates the stability region of the semivariogram, or from a
Legend:
0 Evaluated machine
given value of the distance between the samples the region where there is more space dependence (FARIA et al., 2008).
The range parameter determines the distance within the samples are presented spatially correlated, then, beyond the range is considered that there is no spatial dependence (CHAVES & FARIAS, 2009; JOHANN et al., 2010).
To analyze the degree of spatial dependence of the attributes under study, it was used the classification of CAMBARDELLA et al. (1994), where in the spatial dependence is classified according to the value of the relative nugget effect, that constitutes the division of the nugget effect
(C0) at level (C), being considered: strong spatial dependence when (C0 / C) <25%, moderate spatial
dependence when 25% ≤ (C0 /C) ≤ 75% and weak spatial dependence when (C0 /C) >75%.
The semivariograms models considered were spherical (eq.(2)), the exponential (eq.(3)) and the Gaussian (eq.(4)).Subsequently, it was performed a kriging interpolation of the data in order to enable the visualization of spatial distribution of the noise of the machines tested.
3
0 1
1
0 , 0
1,5 0,5 , 0
,
o
h
h h
h C C h a
a a
C C h a
(2)
0 1
0 , 0
1 exp , 0
h
h h
C C h
a
(3)
20 1
0 , 0
1 exp , 0
h
h h
C C h
a
(4)
The reference area was carried out based on the coordinates obtained in the demarcation of sampling points (meters). For the geostatistical analysis and to obtain the kriging maps was used statistical computing system R (R DEVELOPMENT CORE TEAM, 2010), through the package geoR (RIBEIRO JÚNIOR & DIGGLE, 2001).
RESULTS AND DISCUSSION
The minimum, maximum, average, standard deviation and standard error of the noise data are evaluated for the machines presented in Table 1.
TABLE 1. Minimum, maximum, mean, standard deviation and standard error for noise levels (dB(A)) in equipment evaluated.
Equipment Noise Level(dB(A))
Minimum Average Maximum Average Standard error
Harvester 53.49 65.94 81.85 64.29 0.41
Chainsaw 73.85 85.18 102.28 84.13 0.39
Brushcutter 71.64 84.45 99.31 83.40 0.38
From the analysis of the minimum and maximum values, and also the average noise levels, you can see that there is great variation in the data. This range shows the problems that can occur when using the mean to establish safety standards for workers, because at the same time that an individual is being subjected to a noise level below the maximum allowed, others may be being subjected to an unhealthy situation, generating productivity losses and damages your health.
Given this, only the knowledge of this range is not enough to know which the places are where there are high levels and the lowest values of this variable. In this case, it is interesting to make use of appropriate methodologies to characterize the spatial variability of the data, as well as to obtain maps, to enable the satisfactory management of the necessary interventions.
For all units evaluated, the theoretical semivariogram model that showed the best adjustment was the Gaussian, and the estimates of this parameter for machines evaluated are presented in Table 2. This model is transitive (FARIA et al., 2008), it possesses level, or from a given value of the distance between samples there is no more spatial dependency (the variance of the difference between pairs of samples becomes invariant with distance), and similar results were observed for MILES et al. (2008) and FARIA et al. (2008).
TABLE 2. Parameters estimates of the experimental semivariogram for the variable noise level on the equipment evaluated.
Equipment Parameters
Nugget Effect (C0) Range (a) Level (C) 1C0 / C
Harvester 3.23 12.66 76.29 0.04
Chainsaw 7.38 15.11 71.60 0.10
Brushcutter 3.99 13.05 64.58 0.06
Tractor 5.76 13.68 43.22 0.13
1C
0/ C = Degree of spational dependency
The nugget effect reflects the variability not explained by distance from the sample used, as local variations, errors of analysis, sampling errors and other errors. As it is impossible to quantify the individual contribution of these errors, the nugget effect can be expressed as a percentage of level thus facilitating the comparison of the degree of spatial dependence of the variables under
study (TRANGMAR, 1985). Therefore, the ratio C0/C showed that the noise data showed strong
spatial dependence grade for equipment rated.
Based on the results obtained with the use of geostatistics, it was possible to quantify the magnitude and the structure of spatial dependence of varying noise level in all analyzed equipment, which can be seen in FIGURE 2.
a)
0 5 10 15 20
60 40 20 0 Se m iva riâ nc ia
0 5 10 15 20
70
50
30
10
b)
0 5 10 15 20
0 10 20 30 40 50 60 70 Se m iva ri ânc ia S emi va ria nc e S emi va ria nc e
Distance (m) Distance(m)
c)
00 55 1010 1515 2020 0 10 20 30 40 50 60 Se m iva riâ nc ia d)
00 55 1010 1515 2020
0 10 20 30 40 Se m iva riâ nc ia S emi va ria nc e Se mi va ria nc e
Distance(m) Distance(m)
semivariogram sample data
FIGURE 2. Semivariograms for the Gaussian function of the noise data for the equipments: a) harvester b) chainsaw, c) brushcutter and d) tractor.
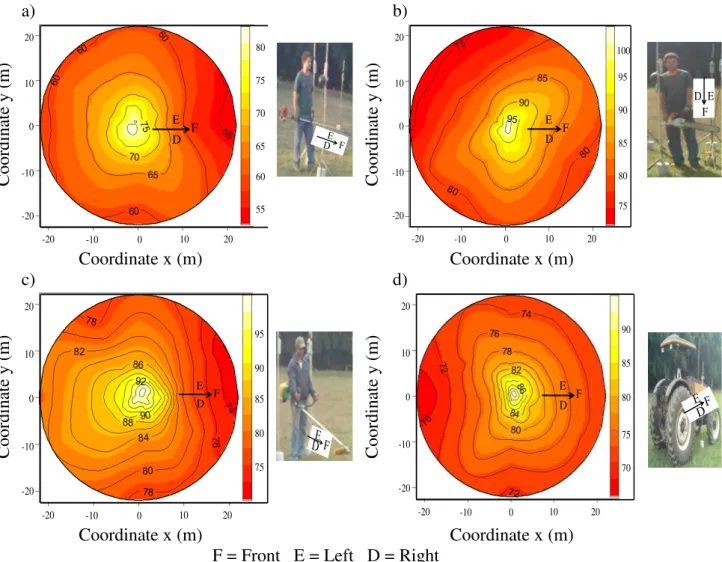
Later noise values were estimated by kriging, based on the spatial dependence of the semivariogram models (FARACO et al., 2008; SOUZA et al., 2010). Thus, it was noted that kriging performed well in estimating the values of this variable that was not sampled due to the achievement of best fits of the semivariogram. Therefore, it was possible to construct maps of spatial distribution for all equipment in this study (Picture 3), which allowed to visualize the spatial variability of the data, and enables the observation of variability between devices.
For each map of the spatial distribution of noise is shown in Figure 3 the image of the positioning device and the operator. Analyzing the Kriging maps and positioning machines it can be observed the effect of the directional distribution of noise in the direction of motor position, reflecting the need for greater distance of the equipment so that the sound pressure level is not harmful to humans and higher attention on the use of personal protective equipment for those people who are working in the area around the engine.
C oordina te y (m) a) 20 10 0 -10 -20
-20 -10 0 10 20 60 65 70 75 80 55 F D E Coordina te y (m) b) 20 10 0 -10 -20
-20 -10 0 10 20 75 80 85 90 95 100 F D E F D E
Coordinate x (m) Coordinate x (m)
C oordina te y (m) c) 20 10 0 -10 -20
-20 -10 0 10 20 75 80 85 90 95 F D E Coordina te y (m) d) 20 10 0 -10 -20
-20 -10 0 10 20 75 80 85 90 70 F D E
Coordinate x (m) Coordinate x (m)
F = Front E = Left D = Right
FIGURE 3. Spatial distribution of noise level (dB(A)) for the equipments: a) harvester, b) chainsaw, c) brushcutter and d) tractor.
By analyzing the maps, it can be found a high concentration of high noise levels on all machines tested. This shows the necessity of using personal protective equipment for operators and other workers that remain around the equipment making maintenance or monitoring activities.
Looking at the maps to the chainsaw and harvester is possible to identify locations where noises above the maximum level recommended for sanitation by the NR-15 and these devices requires a greater distance from the center of the noise so that do not occur exposure to unhealthy environment. Therefore, the use of these maps can contribute to the study or the development of management techniques from different machines, thus enabling more efficient operations and safety for the worker.
CONCLUSIONS
It was possible to characterize the spatial variability of the magnitude of the noise data evaluated on the machines, harvester, chainsaw, mower and tractor. Since the variable studied showed spatial dependence structure, this allowed the mapping by kriging.
The Gaussian model was adjusted for the variables studied in all equipment evaluated, and the use of geostatistics enabled set points with different spatial variability in these devices.
ACKNOWLEDGEMENT
The authors express their thanks to CAPES, CNPq and FAPEMIG for financial support for this research.
REFERENCES
ABNT. ASSOCIAÇÃO BRASILEIRA DE NORMAS TÉCNICAS. Norma NBR 9999: Medição do
nível de ruído no posto de operação de tratores e máquinas agrícolas. Rio de Janeiro, 1987. 21 p. BAESSO, M. M.; TEIXEIRA, M. M.; JUNIOR, F. A. R.; JUNIOR, R. G. M.; FERNANDES, H. C. Avaliação do nível de ruído emitido por um conjunto trator-pulverizador com e sem assistência de ar. Revista Engenharia na Agricultura, Viçosa, MG, v.16, n.4, p.400-407, out./dez. 2008.
BRAVALHERI, A. C.; BERNARDO, L. A.; MIRANDA, M. A. M.; ANGELO, T. N.;
PARAHYBA, V. E. S. Poluição sonora em ambientes da Unicamp. Revista Ciências do Ambiente
On-Line. Campinas, v.6, n.1, jul. 2010. Disponível em: <http://sistemas.ib.unicamp.br/be310/>. Acesso em: 20 dez. 2010.
CAMBARDELLA, C.A.; MOORMAN, T. B.; NOVAK, J. M.; PARKIN, T. B.; KARLEN, D. L.; TURCO, R. F.; KONOPKA, A. E. Field scale variability of soil properties in Central Iowa soils. Soil Science Society of America Journal, Madison, v.58, n.5, p.1501-1511, 1994.
CHAVES, L. H. G.; FARIAS, C. H. A. Variabilidade espacial de cobre e manganês em argissolo sob
cultivo de cana-de-açúcar. Revista Ciência Agronômica, Fortaleza, v.40, n.2, p.211-218, abr./jun.
2009.
CUNHA, J. P. A. R.; TEODORO, R. E. F. Avaliação do nível de ruído em derriçadores e
pulverizadores motorizados portáteis utilizados em lavouras de café. Bioscience Journal,
Uberlândia, v.22, n.3, p.71-77, 2006.
DAMASCENO, F. A.; YANAGI JUNIOR, T.; GOMES, R. C. C.; LIMA, R. R.; SCHIASSI, L.; MORAES, S. R. P. Avaliação do nível de ruído produzido por caminhões de ração no município de
Itaberaí (GO). Revista Ciências do Ambiente On-Line, Campinas, v.4, n.1, ago. 2008. Disponível
em: <http://sistemas.ib.unicamp.br/be310/viewarticle.php?id=133>. Acesso em: 20 fev. 2010. FARACO, M. A.; URIBE-OPAZO, M. A.; SILVA, E. A. A.; JOHANN, J. A.; BORSSOI, J. A. Seleção de modelos de variabilidade espacial para elaboração de mapas temáticos de atributos
físicos do solo e produtividade da soja. Revista Brasileira de Ciência do Solo, Viçosa, MG, v.32,
n.2, p.463-476, mar./abr. 2008.
FARIA, F. F.; MOURA, D. J.; SOUZA, Z. M.; MATARAZZO, S. V. Variabilidade espacial do
microclima de um galpão utilizado para confinamento de bovinos de leite. Ciência Rural, Santa
Maria, v.38, n.9, p.2498-2505, dez. 2008.
JOHANN, J. A.; SILVA, M. C. A.; URIBE-OPAZO, M. A.; DALPOSSO, G. H. Variabilidade
espacial da rentabilidade, perdas na colheita e produtividade do feijoeiro. Engenharia Agrícola,
Jaboticabal, v.30, n.4, p.700-714, jul./ago. 2010.
MACHADO, L. O.; LANA, A. M. Q.; LANA, R. M. Q.; GUIMARÃES, E. C.; FERREIRA, C. V. Variabilidade espacial de atributos químicos do solo em áreas sob sistema plantio convencional. Revista Brasileira de Ciência do Solo, Viçosa, MG, v.31, n.3, p.591-599, 2007.
McBRATNEY, A. G.; WEBSTER, A. G. Choosing functions for semi-variograms and fitting them to
sampling estimates. Journal of Soil Science, Champaign, v.37, p.617-639, 1986.
MILES, D.M.; ROWE, D. E.; OWENS, P. R. Winter broiler litter gases and nitrogen compounds:
MINETTE, L. J.; SILVA, E. P.; SOUZA, A. P.; SILVA, K. R. Avaliação dos níveis de ruído, luz e
calor em máquinas de colheita florestal. Revista Brasileira de Engenharia Agrícola e Ambiental,
Campina Grande, v.11, n.6, p.664-667, nov./dez. 2007.
MION, R. L.; VILIOTTI, C. A.; DANTAS, M. J. F.; NASCIMENTO, E. M. S. Avaliação dos níveis
de ruído de um conjunto mecanizado trator e semeadora adubadora pneumática. Revista Engenharia
na Agricultura, Viçosa, MG, v.17, n.2, p.87-92, mar./abr. 2009.
NASCIMENTO, R. G.; GODOY, R. M. B.; SOUTO JUNIOR, C. A.; UEHARA, G. T. Avaliação da
poluição sonora na Unicamp. Revista Ciências do Ambiente, Campinas, v.3, n.1, p.60-64, fev. 2007.
On line.
NORMAS Regulamentadora de segurança e saúde no trabalho (NR-15): atividades e operações insalubres. Brasília, 1990. Disponível em:
<http://www.mte.gov.br/temas/segsau/legislacao/normas/conteudo/nr15>. Acesso em: set. 2007. R DEVELOPMENT CORE TEAM. R: A language and environment for statistical computing. R Foundation for Statistical Computing, Vienna, Austria. 2010. Disponível em: <http://www.R-project.org/>. Acesso em: 16 ago. 2010.
RIBEIRO JÚNIOR, P. J.; DIGGLE, P. J. GeoR: a package for geostatistical analysis. R-News, New
York, v.1, n.2, p.14-18, june, 2001.
RODRIGUES, M. A. G.; DEZAN, A. A.; MARCHIORI, L. L. M. Eficácia da escolha do protetor
auditivo pequeno, médio e grande em programa de conservação auditiva. Revista Cefac, São Paulo,
v.8, n.4, p.543-547, 2006.
SAMPAIO, C. A. P.; NÄÄS, I. A.; SALGADO, D. D.; QUEIRÓS, M. P. G. Avaliação do nível de
ruído em instalações para suínos. Revista Brasileira de Engenharia Agrícola e Ambiental, Campina
Grande, v.11, n.4, p.436- 440, jul./ago. 2007.
SANTOS, G. R. Hierarquização geométrica dos preditores geoestatísticos. 2010. 200 f. Tese
(Doutorado em Estatística e Experimentação Agropecuária) - Universidade Federal de Lavras, 2010.
SILVEIRA, J. C. M.; FERNANDES, H. C.; RINALDI, P. C. N.; MODOLO, A. J. Níveis de ruído em função do reio de afastamento emitido por diferentes equipamentos em uma oficina agrícola. Engenharia na Agricultura, Viçosa-MG, v.15, n.1, p.66-74, 2007.
SOUZA, G. S.; LIMA, J. S. S.; XAVIER, A. C.; ROCHA, W. S. D. Krigagem ordinária e inverso do
quadrado da distância aplicados na espacialização de atributos químicos de um argissolo. Scientia
Agraria, Curitiba, v.11, n.1, p.73-81, jan./fev. 2010.
TRANGMAR, B. B. Applications of geostatistics to spatial studies of soil properties. Advances in
Agronomy, San Diego, v.38, n.1, p.45-94, jan. 1985.
VIEIRA, S.R. Geoestatística em estudos de variabilidade espacial do solo. In: NOVAIS, R.F. et al.
(Ed.). Tópicos em ciência do solo. Viçosa: Sociedade Brasileira de Ciência do Solo, 2000. v.1,