www.rbceonline.org.br
Revista
Brasileira
de
CIÊNCIAS
DO
ESPORTE
ORIGINAL
ARTICLE
Mechanical
stiffness:
a
global
parameter
associated
to
elite
sprinters
performance
Fernando
López
Mangini
a,
Gabriel
Fábrica
b,∗aUniversidaddelaRepública(UDeLaR),FacultaddeMedicina,UnidaddeInvestigaciónenBiomecánicadelaLocomoción
Humana,Montevideo,Uruguay
bUniversidaddelaRepública(UDeLaR),FacultaddeMedicina,DepartamentodeBiofísica,Montevideo,Uruguay
Received24July2013;accepted12March2014 Availableonline12March2016
KEYWORDS
Stiffness; Sprint; Biomechanics; Performance
Abstract Thisstudyanalyzesvertical stiffnessasaglobalparameterthatcouldbedirectly associatedtosprinter’sperformance.Weevaluatedverticalstiffness,performance,heartrate andlactateconcentrationonfifteenmalesprintersthatranonatreadmillatgaittransition speedand13kmh−1.VerticalStiffnesswasdeterminedbytheratioofthevertical
accelera-tion peakandmaximum displacementofthecenterofmass.Physiologicalparameterswere measuredthroughouttheexperimentalprocedureandperformancewasestimatedbyathlete’s timerecordson100mtrackrace.Asexpected,verticalstiffnessandheartrateincreasedwith runningspeed.Wefoundahighcorrelationbetweenheartrateandverticalstiffnessatgait transitionspeed.However,at13kmh−1,lactatepeakshowedahighercorrelationwithvertical
stiffness,suggestingagreaterparticipationoftheanaerobicsystem.Aninverserelationship betweenperformanceandverticalstiffnesswasfound,wherefasterathleteswerethestiffer ones.Performanceandlactatepeakpresentedthesameinverserelationship;fasterathletes hadhigherlactatepeaks.Asaresult,fasterathleteswerestifferandconsumemoreenergy.All inall,thesefindingssuggestthatmechanicalstiffnesscouldbeapotentialglobalparameterto evaluateperformanceinsprinters.
©2016Col´egioBrasileirodeCiˆenciasdoEsporte.PublishedbyElsevierEditoraLtda.Allrights reserved. PALAVRAS-CHAVE Rigidez; Corridade velocidade; Biomecânica; Desempenhofísico
Rigidez mecânica: um parâmetro global associado com desempenho em velocistas deelite
Resumo Esteestudoanalisaarigidezverticalcomoumparâmetroglobalquepoderiaser dire-tamenteassociadoaodesempenhoemvelocistas.Avaliou-searigidezvertical,odesempenho, afrequênciacardíacaeaconcentrac¸ãodelactatoem15velocistasdosexomasculino,todos altamentetreinados,quecorreramemumaesteiraàvelocidadedetransic¸ãoea13km.h−1. ∗Correspondingauthor.
E-mail:[email protected](G.Fábrica). http://dx.doi.org/10.1016/j.rbce.2016.02.004
Arigidezverticalfoideterminadapelarazãoentreopicodeacelerac¸ãoverticaleo desloca-mentomáximodocentrodemassa.Osparâmetrosfisiológicosforammesuradosnacoletade dadoseodesempenhofoiestimadoporregistrosdetempoem100metrosdecorrida.Como esperado,arigidezverticaleafrequênciacardíacaaumentaramcomavelocidade.Arigidez eafrequênciacardíacaobtiveramaltacorrelac¸ãonamenorvelocidade.Contudo,a13km.h−1
opicodelactatomostroualtacorrelac¸ãocomarigidez,oquesugereumamaiorparticipac¸ão dosistemaanaeróbico.Umarelac¸ãoinversafoiachadaentrerigidezeregistrosdetempo,nos quaisosatletasmaisrápidossãoosmaisrígidos.Alémdisso,osatletasmaisrápidosforamos queapresentaramosmaiorespicosdelactato.Assim,esteestudosugerequearigidezvertical poderiaserumparâmetroglobalparaavaliarodesempenhodosvelocistas.
©2016Col´egioBrasileirodeCiˆenciasdoEsporte.PublicadoporElsevierEditoraLtda.Todosos direitosreservados. PALABRASCLAVE Rigidez; Sprint; Biomecánica; Rendimiento
Rigidez mecánica: un parámetro global asociado con el rendimiento en velocistas deélite
Resumen Esteestudioanalizalarigidezverticalcomounparámetroglobalquepodríaestar directamenterelacionadoconelrendimientoenvelocistas. Seevaluó larigidezvertical,el rendimiento, la frecuencia cardíaca y la concentración delactato en 15velocistasde sexo masculino, muy entrenados, que corrieron en una cinta a la velocidad de transición y a 13km/h−1.Larigidezvertical secalculó porelcocienteentreelpicode aceleración
verti-calyeldesplazamientomáximodelcentrodemasa.Losparámetrosfisiológicossemidieron duranteelprocedimientoexperimentalyelrendimientoseestimóatravésdeltiempodecada atletaen100mllanos.Comoeradeesperar,larigidezverticalylafrecuenciacardíaca aumen-taronconla velocidad.Seencontróunaaltacorrelaciónentrefrecuenciacardíacayrigidez verticalalavelocidadmásbaja.Sinembargo,a13km/h−1,elpicodelactatomostróunaalta
correlaciónconlarigidezvertical,loquesugeríamayorparticipacióndelsistemaanaeróbico. Seencontróunarelacióninversaentreelrendimientoylarigidezvertical,dondelosatletasmás rápidosfueronmásrígidos.Asimismo,elrendimientoyelpicodelactatopresentaronlamisma relacióninversa;losatletasmásrápidosmostraronlospicosmásaltosdelactato.Por consi-guiente,losatletasmásrápidosfueronmásrígidosyconsumieronmásenergía.Estosresultados sugierenquelarigidezmecánicapodríaserunparámetroglobalparaevaluarelrendimiento delosvelocistas.
©2016Col´egioBrasileirodeCiˆenciasdoEsporte.PublicadoporElsevierEditoraLtda.Todoslos derechosreservados.
Introduction
Arunningsprintercoordinatestheactionsofmanymuscles, tendons, and ligaments in its leg so that the overall leg behaves like a single mechanical spring during ground contact(Farleyetal.,1993).Infact,thesimplestmodelofa runningsprinterisaspring-masssystemconsistingofalinear springrepresentingthestancelimbandapointmass equiv-alenttobodymass (Blickhan,1989;Mcmahon and Cheng, 1990).Duringsupport,verticalforcecomponentisactingon thespringandthusmechanicalstiffnesscanbecalculated fromtheratioofthisforcetothechangeinspringlength.
The spring mass model has been used in optimization studies (Alexander, 2003) and totest hypothesis that are directly related tosport andtraining fields (Morin etal., 2011; DiMichele et al.,2012).The reasons for usingthis modelintheseareasaremainlyitssimplicityandglobality sinceevaluations generallyhave the tendency toanalyze oneorafewparametersonly.
Assumingthespring massmodel,previous studieshave used different methods and equipments for estimating mechanical stiffness when running (Brughelli and Cronin, 2008).Oneoftheapproachesmostcommonlyusedis verti-calstiffness(Kvert)(Mcmahon etal.,1987;Cavagnaetal.,
1988; Morin et al., 2005, 2011; Di Michele et al., 2012). This parameter relatestothepeakvertical forceand the vertical motion of the center of mass during the contact with the ground (Brughelli and Cronin, 2008). Both, the force peak and the displacement of the center of mass depend on muscular activation, fiber type and muscular volume (Herzog, 2000) and is thought to influence sev-eralathleticvariables,includingrateofforcedevelopment, storageofelasticenergy,stridefrequency,groundcontact time and sprint kinematics (Farley and Gonzalez, 1996; Mcmahon and Cheng, 1990). In this way, changes in Kvert
could influence sprinter’s performance when running and its quantification could provide a useful tool to evaluate sprinters.
It is widely known that strengthis amajor qualityfor athletestodevelop,thusitiscloselyassociatedtorunning speed. All elite sprinters have a common feature; huge leanmuscleswithhigh percentageofexplosivefibers that areintensivelyactivatedwhen racing(Kuboetal., 2011). Duringeach stepphase,athletes performmaximum force in averyshortperiodof time,recruitinghigh percentage ofmusclefibersandactivatingcontractileelementsto gen-erate intensive stretch-shorteningcycles in acoordinated manner (Nigg et al., 2000). Therefore, maximum power is perform during ground contact, increasing speed and improvingtimerecords.
Having a largermuscular volume,build up byfast and explosivefibers,withalargercrosssectionthanslowfibers andahighpercentageofactivatedfibers,coulddetermine anincreaseinforcepeakduringgroundcontactphase lead-ingtoanincreaseinKvert.
Nonetheless,an athletewithalargermuscular volume and ahigh percentage of activatedfibers would consume moreenergy.Kvert dependsdirectly ontheforce peakand
thisonmusclecharacteristicsthatwoulddetermindenergy consumption. Energy consumption during exercise can be estimated throughout different physiological parameters such as heart rate and blood lactate concentration. The analysisoftheseparameterswouldprovidefurtherinsight onKvertvaluesconsideringthemasarealfeedbackof
phys-iologicalprocesseshappeninginsidemuscletendonunitof thelimbs.
Theaimofthisstudyistoprovideabetter understand-ing ontheimportance ofmechanical stiffnessasa global parameter that could be directly associated to athlete’s performance.
Our hypothesis isthat athletes withhighermechanical stiffnesswillconsumemoreenergyandwillhavefastertime recordsin100m.
For that purpose, we analyzed Kvert of elite sprinters
througha3D filmingandreconstructionprocedureat con-trolledconditionsandlactateconcentrationandheartrate to assay their relationship withathlete’s performance. If the hypothesis is correct,the physiological and mechani-calparametersstudiedhereshouldfollow thesametrend ofchange andhave ahigh correlation withathlete’stime records.Asaresult,mechanicalstiffnesscouldbea poten-tialglobalparametertopredictperformanceinsprinters.
Methods
Experimentalapproachtotheproblem
Thestudy designiscomposedbytheanalysisofthree dif-ferentvariables.
By using a three dimensional filming method (cineme-try),athlete’smechanicalstiffness(Kvert)wasassayed.This
method,basedonthespring-massmodel,providesinsights on the motion of the center of mass when running. Sec-ondly, physiological parameters such as lactate peak and heartrateweremeasuredtoanalyzeenergyconsumption. These canbeconsidering asarealfeedbackof the physi-ologicalprocesseshappeninginsidemuscletendonunitsof thelimbs.
Finally,wemeasuredathlete’sperformancebytheirtime recordsin100mtrack race.Timerecordswere measured undercontrolledconditions(sameday,track,distance,wind speedandchronometer)forallsprinters.
With these information, we tested our hypotheses to provideabetter understanding onthe importanceofKvert
asaglobal parameterthatcouldbedirectly associatedto athlete’sperformance.
Subjects
Asampleoffifteenmaleathletes,allhighlytrainedsprinters (19.7±1.28years,69.50±2.68kg)voluntarilyparticipated inthisstudy.Thesamplewasconvenientlyselectedamong athleteswiththebesttimerecordsin100minthecountry.
The sample size (n) was estimated throughout a
comparisonmodel: n= 2(Za+Zb)
2∗S2
d2
where n=number of athletes, Za and Zb=risk values,
S2=variance of K
vert (taken from bibliography) and
d=minimumdifferencedetectedwhencomparingtwoKvert
valuesatdifferentspeeds.Also,weconsideredunilaerality andset˛=0.05andˇ=0.05.
Theexclusioncriteriaconsidered werethepresenceof anyinjurywithinthelast6monthorifthetrainingperiod wasdifferentfrompre-competition/competition.Oncethe sample was selected, none of the individuals had to be excludedfromthetrial.
This study complied with the requirements of the local Committee for Medical Research Ethics and cur-rentUruguayanlawandregulations.Theparticipantswere informed about the objectives and characteristics of the study,andtheirconsentwasobtained.
Procedures
Performance was measured by athlete’s time records on 100mtrackrace.Athleteswererequestedtoracea100m onan officialtrail in theNational AthleticStadium. Time recordswere measuredundercontrolledconditions(same day,track, distance,windspeed andchronometer)for all sprinters.
After evaluating performance, athletes were taken to theLaboratoryofMovementintheHospital deClínicas to evaluateKvertandphysiologicalparameters.
Athletes were dressed up in black tight clothes and coveredwith18whitemarkersindifferentanatomical land-markstoidentify them for subsequent digitalization. The selectedpointswerethefifthmetatarsal,lateralmalleolus, femoralcondyle, greater trochanter, acromion, sphenoid, lateralepicondyleofthehumerus,radialstyloidprocessand headofthethirdmetacarpal.Priortoperformingthe exper-imental procedures, two anthropometric variables were measured: body mass and leg length (trochantericheight measuredfromthegreatertrochantertothefloor).
Eachsubjectranonatreadmillfor10minattwodifferent speeds. We used twodifferent running speedsto confirm thatKvert and physiological parameters varywithchanges
invelocity(ArampatzisandMetzle,1999).Duringthefirst 5min,athletesranattheirgaittransitionspeedestablished byFreud’sequation:
V2=0.5.g.l
where V is the running speed, 0.5 is Freud’s number for gait transition speed, g is acceleration due to gravity (9.8ms−2onearth)andlistheleglengthinmeters(Saibene
and Minetti, 2003). The remaining 5min athletes ran at 13kmh−1,speedat whichmuscles workmainly in
isomet-ric contraction (Fisher, 2010). We selected these running speedssincethemodelweareusingtocalculateKvert
per-fectlyadjustsandisvalidatlowrunningvelocities. Inthis way,althoughwearenotmeasuringKvert attheusualhigh
speedof a race, thisparameter calculated at low speeds reflectstheglobalmechanic characteristicsof theathlete (Cavagnaetal.,1988).
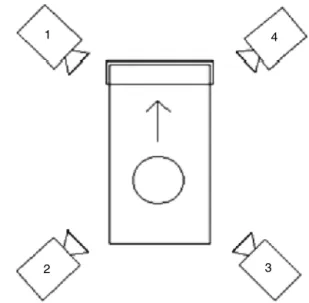
Images were recorded with 4 synchronized DCR-H28E digitalvideocameras,thesewereplacedon950ALS UNO-MATtripodsfollowinga90degreeanglelayoutwithineach other toensure that athlete’s sagital plane wascaptured bytwo cameras(Fig.1). In thisway, a three-dimensional reconstructionwasperformedtodeterminethepositionof athlete’scenterofmass(CM)andcalculatethemechanical stiffnessthroughoutKvert.
Oncethefilmingprocesswasfinalized,imageswere cap-turedandloadedinDvideowsoftware(DigitalforVideofor BiomechanicsWindows32bits).Thisprogramallows decen-tralizingthefieldsthatcomposetheimagesofeachframe ofthevideosothatthefrequencyofdataacquisitioninthis workwas50framespersecond(Barrosetal.,1999;Figueroa etal.,2003).
Upon finishing the above process, the position coor-dinates of the markers placed over specific landmarks were determined by digitalizing each marker referenced to a three dimensional coordinate system associated to a calibration volume. The system used for calibration, was chosen according to the International Society of
1 4
3 2
Figure1 Schematiclayoutofthecamerasplacedroundthe treadmill.Thearrowindicatesmovementdirection.
Biomechanics recommendations, in order to unify the kinematics datacommunication. Throughout a 3-D recon-struction,athree-columnmatrix wasobtained,describing thepositioncoordinatesofthemarkers.
The digitalized sequence was selected from 10 step cyclesof thelast minuteof each runningspeed toassure less stepvariability (Fisher, 2010). After establishing this sequenceinonecamera,wecalculatedtheframerangeto acquirethesamerangeinallcameras.Thustoperformthis, we synchronizedthe deviceswithasoundsignal thatwas recordedinthevideoandreadbythesoftware.TheCM coor-dinates weredetermined by 3D reconstructionanalysis in Matlab7.0® (Mathworks,Inc.),consideringthecoordinates
ofthepartialcenterofmassofthefeet,legs,thighs,hands, forearms,arms,trunkandhead.Knowingthepositionofthe CMineachstep,weproceededtocalculatetheacceleration oftheCMbyderivingitspositiontwicewithrespecttotime. Fromthe accelerationcurve we determinedtheeffective contacttimeforeachstancephase(Cavagna,2006).Using thistimewecalculatethemaximumdisplacement(MD)of theCMfromthepositioncurve(Cavagna,2006).
Finally,the effective vertical stiffness wasdetermined bytheratioof theverticalaccelerationpeak(avmax)and MD(BrughelliandCronin,2008)oftheCM.
Kvert=avmax.MD−1
Twophysiologicalparameterswereanalyzedinthisstudy (heartrateandlactateconcentration).Heartratewas mon-itored prior to performing the experimental procedures (basal heart rate) and during both running speeds by a Nike triax c8 heart rate monitor. The lactate concentra-tionwasdeterminedbyaRocheAccutrendpluslactimeter. This device worked throughout a colorimeter method to determine the amount of blood lactate concentration.To carryoutthemeasurementproceduresweused20specific reagentsforlactateand20disposablelancets(allpurchased fromRoche).Fourlactatemeasurementswereperformedto allathletes.Thefirstonewascompletedbeforethestartup oftheprotocol(basallactateconcentration)andtheother threewere accomplished2,5 and8min afterthe experi-mentalprocedureswerefinalized.
Statisticalanalysis
Kvert at both speeds was plotted against athlete’s time
records,andlactatepeakwasplottedagainstathlete’stime records.
Pairedsample t-test(p<0.01) wereperformed to ana-lyze howKvert and physiological parameters change when
increasingrunningspeed.
Pearsoncorrelationswereimplementedbetween: - Kvertandphysiologicalparametersatbothspeeds
- Kvertandathlete’stimerecordson100m
- Lactatepeakandathlete’stimerecordson100m. AllthestatisticanalysiswasperformedinSPSSStatistics 17.0.
Table1 Mean andstandarddeviation ofKvert andheart
ratebothrunningspeedsp≤0.01isthesignificanceofthe changeoftheseparametersfromgate transitionspeed to 13kmh−1.
Variable Gaittransitionspeed 13kmh−1 p
Kvert(s−1) 161.5±22.9 194.5±27.4 0.001
Heartrate 143.9±11.2bpm 177.2±5.7 0.001
Table2 Resultsofcorrelations,notethattheanalysisare notperformedforlactatepeakandKvertV1,sincethe
sam-plesweretakenafterthesecondrace(13kmh−1).Thelevel
ofsignificanceisshownbetweenbrackets.
Variable KvertV1 KvertV2
Lactatepeak --- 0.83(0.000)
Heartrate 0.74(0.001) 0.52(0.05)
Results
Allathletesanalyzedincreasedtheirheartrate,blood lac-tateconcentrationandKvert whenenhancingrunningspeed
asestablishedinpreviousinvestigations(Kerdoketal.,2002; BrughelliandCronin,2008;Fisher,2010).
Paired sample t-tests (p<0.01) showed significant changesinheartrateandKvertwhenraisingrunningvelocity
fromgaittransitionspeedto13kmh−1(Table1).
Also, blood lactate concentration exhibited an impor-tant peak (7.63±2.41mmoll−1) 2min after finalizing the
experimental procedures which was significantly higher (p<0.01)thanthebasalconcentrationobtainedinthiswork (1.89±0.4mmoll−1).
Pearson correlations between heart rate and Kvert for
gait transition speed were higher than the ones found at 13kmh−1,andlactatepeak,washighlyassociatedtoK
vert
values(r=0.83)whenrunningat13kmh−1(Table2).
HighcorrelationswherefoundwhenplottingKvertvalues
measuredatgatetransitionspeedandat13kmh−1against
sprinter’s time records in 100m (r=0.907 and r=0.922 respectively), where the fastest sprinters (shortest time record)weretheoneswiththehighestKvert(Fig.2).
The same inverse relationship and similar correlation (r=0.95)wasfoundwhenplottingbloodlactatepeakagainst
300
Kv
er
t (s
–2)
Sprinter’s time records in 100 meters (s)
Kvert values at gait transition speed Kvert at 13 Km.h–1
250 200 150 100 50 0 10.7 10.8 10.9 11 11.1 11.2 11.3 11.4 11.5
Figure 2 Kvert measured at gait transition speed and at
13kmh−1vstimerecordsin100m. 14 12 10 8 6 4 2 0 10.7 10.8 10.9 11 11.1 11.2 11.3 11.4 11.5
Lactate peak (mmol.L
–1)
Sprinter’s time records in 100 meters (s)
Figure3 Lactatepeakvstimerecordsin100m.
athlete’stimerecords,wherethefastestathleteshadthe highestlactatepeaks(Fig.3).
Discussion
Inthis study, we focuson howKvert is associated toelite
athlete’s performance. Therefore, to achieve this aim, we calculated Kvert and analyzed heart rate and blood
lactate concentration to estimate energy consumption, considering these variables asa realfeedback of physio-logical processes happening inside muscle tendon unit of thelimbs. To estimate Kvert, we useda method based on
imagingreconstruction. Although thiscouldbeconsidered asalimitationofthestudymethodssinceforceplatesare moreprecise,we understandit isfundamental toanalyze and evaluate the study parameters at controlled speed. Thus,weconsideredcinemetryasthebestoption.
We used two different running speeds (gait transition speed and 13kmh−1) to confirm that K
vert varies when
increasingrunningvelocity(ArampatzisandMetzle,1999). Weselectedtheserunningspeedssincethemodelwe are usingto calculate Kvert better adjusts and is valid at low
runningvelocities. Athighervelocities,asymmetriesoccur intheverticaldisplacementoftheCMduringtheeffective ground contactphase(Cavagnaet al.,1988). In thisway, althoughwearenotmeasuringKvertattheusualhighspeed
ofarace,thisparametercalculatedatlowspeedsreflects theglobalmechaniccharacteristicsoftheathlete.
TheKvert average valuesfound forgaittransitionspeed
(161.5±22.9s−2)andfor13kmh−1(194.5±27.4s−2),were
slightly below the values usually established in previous investigations.Forinstance,Ferrisetal.(1999)found val-ues of 18kNm−1 (225s−2) when running at 10.8kmh−1
(Ferrisetal.,1999);DuttoandSmith(2002)founddataof 23.5kNm−1(293s−2)forarunningspeedof14kmh−1(Dutto
andSmith,2002).
The difference in Kvert valuesfound in thisstudy from
the ones reported in literature is probably associated to themethodusedtocalculatethisparameter,sinceinthis study athletes ran on a treadmill while in most back-ground investigationsKvert is determined by using a force
platform (Brughelli and Cronin, 2008). In this way, our resultsincludedthestiffnessofthetreadmill(Kerdoketal., 2002) that promoted the whole body-treadmill system to become more compliant than running in a non-compliant surface.However, we found a significant increase in Kvert
values(p=0.001) when enhancing running speed which is coherent with previous studies findings (Arampatzis and Metzle,1999; Brughelli andCronin, 2008). The significant changes in Kvert when raising running speed have been
fully explained in former studies by enhancing the force peak and decreasing the displacement of the CM during thestance phase (Brughelli andCronin, 2008). These dif-ferences in force and displacement are determined by changes in muscular contractile capacity. This combined withmetabolicchangescouldmaketheneuromuscular sys-temregulatethemuscle-tendonstiffnessbyincreasingthe level of pre-activation and thus affecting global stiffness (Fisher, 2010). It has been demonstrated that enhancing running speed, increases Kvert and as a result, a smaller
amount of elastic energy is used (Brughelli and Cronin, 2008). The supporting explanation for this statement is that Kvert depends onboth, the vertical acceleration and
the effective deformation of the lower limb, while the elasticenergydependsonthesquareddeformation. There-fore,thesmaller effective deformationof the lowerlimb due to the increase on running speed becomes deter-minant in the use of elastic properties (Fisher, 2010). Thus,this should reflect an increase onenergy consump-tion, as analyzed in previous studies where Kvert was
assayed in different running speeds in fatigue condition (Borranietal.,2003;Candauetal.,1998;Slawinskietal., 2008).
Inthis paper,wefound thatheart rateincreaseswhen enhancing running speed and that blood lactate concen-tration shows a significant peak (7.63±2.41mmoll−1)
compared to the basal values (1.89±0.4mmoll−1),
con-firming that higher energy is consumed. In addition, increasingrunningspeedimpliesamajoreffortandagreater number of muscle fibers activated, thus raising muscu-lar activation andthe force performed during the ground contactphase(Herzog,2000).Asaresult,moreenergy(ATP) andoxygen is consumedby the musclefibers that is sup-portedbyanintensifybloodsupplydrivenfromtheheart, increasingitsrateandvolumeofventricularejection(Nigg etal.,2000).Pearsoncorrelationsbetweenheartrateand Kvert forgaittransitionspeed(r=0.74)washigherthanthe
one found at 13kmh−1 (r=0.52), probably becausewhen
runningatalowervelocity,themainsystemrestoringATP is the aerobic system. On the other hand, running at a fasterspeed derives in agreater muscleactivity implying an increase on the amount of lactate concentration. The presence of this molecule in the muscle fibers, promotes theacidificationofthecellsenvironmentwhichspeedsup oxygenrelease tothe tissues, profiting cellular breathing (Niggetal.,2000).Wefoundthatlactateconcentration,was highlyassociatedtoKvert values(r=0.83)whenrunning at
13kmh−1whileheartratecorrelationdecreased(r=0.52).
Thisshowsanimportantparticipationoftheanaerobic sys-teminrestoringATP.
Wefound thatfasterathleteswerestiffer andalsothe onesthatreachedthehighestlactatepeak,thusconsuming moreenergy.Therefore,changesinphysiologicalvariables highlighttheimportanceofKvertasaglobalparameter.
Hav-ingalargermuscularvolumebuildupbyfastandexplosive fiberswithalargercrosssectionthanslowfibersandahigh percentageofactivatedfiberscoulddetermineanincrease in force peak during ground contact phase leading to an
increase in Kvert.This increase in muscular activation due
toalargervolumewillconsumemoreenergy.Asaresult, stiffersprinterswouldconsumemoreenergy.
ThefindingsofthisstudysuggestthatKvertisanimportant
determinant and a potential global parameter to evalu-atesprinter’sperformance.Consideringthatitismeasured whenracingandsimpletoevaluate,thisparameterhasan importantpracticalapplicationinthecoachingfield.Inthis sense, for future studies we will focus on a longitudinal approachtoanalyzehowdifferentcapacitiessuchaspower, explosive force andcoordination canaffect Kvert and
ath-lete’sperformance.Uptodate,therehavebeennostudies thatanalyzetheeffectsoftraininginotherwaysof estimat-ingmechanicalstiffness,suchaslegstiffness,andrunning speed.
Conclusions
Whenincreasingrunningspeed,heartrateandKvertfollow
thesametrendofchange.
At gaittransition speed, Kvert is highly correlatedwith
heartrate. At13kmh−1K
vertishighlycorrelatedwithlactatepeak.
Our results suggest that the fastest athletes have a greatermechanicalrigidityandconsumemoreenergy.
Conflicts
of
interest
Theauthorsdeclarenoconflictsofinterest.
References
AlexanderRMcN.Modellingapproachesinbiomechanics.PhilTrans RSocLondB2003;358:1429---35.
ArampatzisBG,MetzleV.Theeffectofspeedonlegstiffnessand jointkineticsinhumanrunning.JBiomech1999;32:1349---53. BarrosRML,BrezinkoferR,LeiteNJ,FigueroaPL.Desenvolvimento
eavaliac¸ãodeunsistemaparaanálisetridimensionalde movi-mentoshumanos.RevBrasEngBioméd1999;15:234---9. Blickhan R. The spring-mass model for running and hopping. J
Biomech1989;22:1217---27.
BorraniF, Candau R,Perrey S, Millet GY, Millet GP,RouillonJD. DoesthemechanicalworkinrunningchangeduringtheVO2slow
component?MedSciSportsExerc2003;35:50---7.
BrughelliM,CroninJ.Influenceofrunningvelocityonvertical,leg andjoint stiffness:modelingandrecommendationsforfuture research.SportsMed2008;38:647---57.
Candau R, BelliA, Millet GY,Georges D,BarbierB, RouillonJD. Energy costand runningmechanics duringa treadmillrun to voluntaryexhaustioninhumans.EurJApplPhysiolOccupPhysiol 1998;77:479---85.
CavagnaGA,FranzettiP,HenglundN,WillemsP.Thedeterminants ofthestepfrequencyinrunning,trottingandhoppinginman andothervertebrates.JPhysiol1988;399:81---92.
CavagnaGA.Thelanding-take-offasymmetryinhumanrunning.J ExpBiol2006;209:4051---60.
Di Michele R, Del Curto L, Merni F. Mechanical and metabolic responsesduringahigh-intensitycircuittrainingworkoutin com-petitiverunners.JSportsMedPhysFitness2012;52:33---9. DuttoDJ, Smith GA.Changes inspring-mass characteristics
dur-ing treadmill running to exhaustion. Med Sci Sports Exer 2002;34:1324---31.
FarleyC,GlasheenJ,McMahonT.Runningsprings:speedandanimal size.JExpBiol1993;185:71---86.
FarleyCT,GonzalezO.Legstiffnessandstridefrequencyinhuman running.JBiomech1996;29:181---6.
FerrisDP,LiangK,FarleyCT.Runnersadjustlegstiffnessfortheir firststeponanewrunningsurface.JBiomech1999;32:787---94. FigueroaPJ,LeiteNJ,BarrosRML.Aflexiblesoftwarefortracking ofmarkersusedinhumanmotionanalysis.ComputMethodsProg Biomed2003;72:155---65.
FisherG. AnálisedaMecânicadaCorridacomesemo efeitoda Fadiga[Dissertac¸ãoMestrado].PortoAlegre:Ciênciasdo Movi-mento Humano, Universidade Federal do Rio Grandedo Sul, UFRGS;2010.
HerzogW.Cellularandmolecularmusclemechanics.In:HerzogW, editor.Skeletalmuscle mechanics:from mechanismsto func-tion.NewYork:JohnWiley&Sons,Ltd;2000.p.33---52. KerdokAE,BiewenerAA,McMahonTA,WeyandPG,HerrHM.
Ener-geticsandmechanicsofhumanrunningonsurfacesofdifferent stiffness.JApplPhysiol2002;92:469---78.
McmahonTA, ValiantG, FrederickEC.Grouncho running.JAppl Physiol1987;62:2326---37.
Kubo K, Ikebukuro T, Yata H, Tomita M, Okada M. Mor-phological and mechanicalproperties of muscle and ten-don in highly trained sprinters. J Appl Biomech 2011;27: 336---44.
McmahonTA,ChengGC.Themechanicsofrunning:howdoes stiff-nesscouplewithspeed?JBiomech1990;23:65---78.
Morin J, Delleau G, Kyrolainen H, Jeannin T, Belli A. A simple methodformeasuringstiffnessduringrunning.JApplBiomech 2005;21:167---80.
Morin JB, Tomazin K, Edouard P, Millet GY. Changes in running mechanics and spring-mass behavior induced by a mountain ultra-marathonrace.JBiomech2011;44:1104---7.
NiggB,MacIntoshB,MesterJ.Biomechanicsandbiologyof move-ment.Champaign,IL,USA:HumanKinetics;2000.
Saibene F, Minetti AE. Biomechanical and physiological aspects of legged locomotion in humans. Eur J Appl Physiol 2003;88:297---316.
SlawinskiJ, Heubert R, Quievre J, Billat V, Hannon C.Changes in spring-mass model parameters and energy cost during track running to exhaustion. J Strength Cond Res 2008;22: 930---6.