Escola de Engenharia
Celso Filipe Nogueira Coutinho
A Data Mining approach towards
effective Dengue outbreak prediction in
Seremban, Malaysia
Dissertação de Mestrado
Escola de Engenharia
Departamento de Informática
Celso Filipe Nogueira Coutinho
A Data Mining approach towards
effective Dengue outbreak prediction in
Seremban, Malaysia
Mestrado em Engenharia Informática
Trabalho realizado sob orientação de
Professor Professor Manuel de Oliveira Orlando
Belo!
Acknowledgements
This study was made possible only due to my family. The unconditional support of my parents, grandparents, brother and sister has always been what kept me going and to them I am especially grateful.
I would like to express my gratitude to my supervisors, Professor Orlando Belo for his support and guidance throughout my work and for always showing me the next step, and Professor Zalizah Awang Long for providing me with such an interesting subject.
I would also wish to thank everyone with whom I have worked as a volunteer in ESN Minho, for being the motivation I needed to do one step backwards in order to be able to do two steps forward. Without having been a member of ESN Minho I would not have the courage to get back to my studies and I would not have even started this dissertation.
I want to thank the UniKL international office, the international relations office in University of Minho and Professor Paulo Azevedo for all the help provided before, during and after my exchange in the University Kuala Lumpur, where I have started this research.
A thorough revision has been made to this document, and for that I must acknowledge the great contribution of Claire Rees. Not only she revised the whole document, but also provided me with good advice and a bit of motivation throughout most of the writing, and for that I am truly thankful.
Last, but not least, a word of appreciation to Frank Grieshaber for being the voice of reason in the early days of my dissertation, for his invaluable advice, and for everything that makes him one of the best friends someone can have.
Resumo
Uma abordagem de mineração de dados para a previsão eficaz de
surtos de dengue
Na Malásia, a taxa de incidência de febre de dengue e febre hemorrágica de dengue atingiu o nível de epidemia, continuando os seus números a crescer. Nos últimos anos, um grande esforço tem sido empreendido no desenvolvimento de métodos para prever surtos de dengue, mas o caminho para realizar de forma eficaz essas previsões, e, portanto, salvar vidas humanas, é ainda muito longo. Este trabalho de dissertação incidiu no uso de técnicas de mineração de dados para descobrir padrões escondidos nos dados obtidos através do cruzamento de informação acerca de pacientes infectados com dengue na Malásia e dados meteorológicos relativos às áreas geográficas onde os pacientes foram infectados.
Palavras-Chave: Árvores de Decisão, Descoberta de Conhecimento em Bases de Dados, Febre de
Dengue, Mineração de dados, Processo Padrão Inter-Indústrias para Mineração de Dados, Segmentação.
Abstract
A data mining approach towards effective dengue outbreak prediction
In Malaysia, the incidence rate of Dengue Fever and Dengue Haemorrhagic Fever has reached the level of epidemic, and its numbers keep growing. In the last few years, a big effort has been put into developing methods for predicting dengue outbreaks. However, the path for undertaking effectively those predictions, and therefore save Human lives, is still a very long one. This dissertation work focused on the use of Data Mining techniques, for discovering hidden patterns on data obtained by crossing information related to patients infected with dengue in Malaysia and meteorological data coming from the areas where those patients got infected.
Keywords: Clustering, Cross-Industry Standard Process for Data Mining, Data Mining, Decision
Index
1
Introduction ... 1
1.1
Contextualisation ... 1
1.2
Motivation and objectives ... 10
1.3
Research methodology ... 13
1.4
Document structure ... 18
2
Literature review ... 20
2.1
Descriptive and predictive Data Mining models ... 21
2.2
Mining Association Rules through Genetic Algorithms ... 26
3
Understanding and preparing the data ... 30
3.1
Business understanding ... 30
3.1.1
Background information ... 30
3.1.2
Business objectives ... 31
3.1.3
Assessing the situation ... 32
3.1.4
DM goals ... 33
3.1.5
Project plan ... 34
3.2
Data understanding ... 36
3.2.1
Collecting Initial Data ... 36
3.2.2
Describing Data ... 36
3.2.3
Exploring Data ... 39
3.2.4
Verifying Data Quality ... 50
3.3.1
Selecting Data ... 52
3.3.2
Cleaning Data ... 53
3.3.3
Constructing New Data ... 53
3.3.4
Integrating Data ... 55
3.3.5
Formatting Data ... 55
3.3.6
Implementing ... 56
4
Modelling the data ... 59
4.1
Selecting Modelling Techniques ... 59
4.2
Generating Test Designs ... 61
4.3
Building the Models ... 62
5
Conclusions and future work ... 83
Bibliography ... 87
Appendices ... 95
a.
Original demographic dataset ... 95
Index of Figures
Figure 1 – Life cycle of aedes aegypti - based on (M., 2010) ... 3
Figure 2 - Incidence rate of dengue in Malaysia per year per 100.000 inhabitants ... 6
Figure 3 - Cases of dengue in Malaysia per year ... 7
Figure 4 - Number of deaths due to dengue infection in Malaysia per year ... 7
Figure 5 – The KDD process for the dissertation work ... 15
Figure 6 – CRISP-DM methodology - based on (Cios, et al., 2007) ... 17
Figure 7 – Life cycle of aedes aegypti ... 22
Figure 8 - Comparison of models using similar datasets ... 24
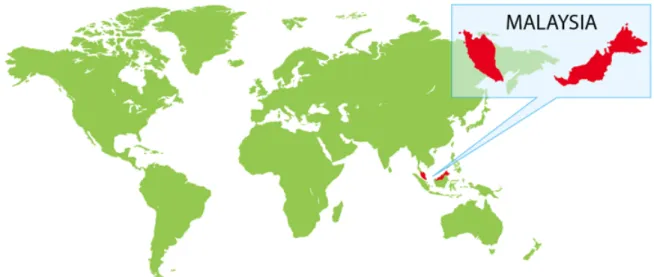
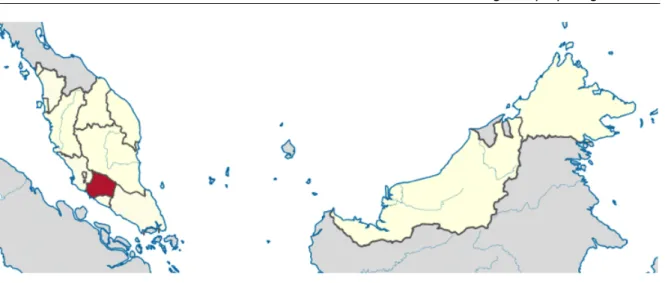
Figure 9 - Malaysia's location within a world map ... 40
Figure 10 - Negeri Sembilan state, in Malaysia ... 41
Figure 11 - Seremban district highlighted in Negeri Sembilan map ... 41
Figure 12 – Occurrences of DF and DHF grouped by week ... 43
Figure 13 - DT grown with the default 'rpart' parameters for the demographic dataset ... 63
Figure 14 - DT grown after calibrating for the demographic dataset ... 64
Figure 15 - DT grown with the default 'rpart' parameters for the ‘week0’ dataset ... 66
Figure 16 - DT grown after tuning for the 'week0' dataset ... 67
Figure 17 - DT grown with the default parameters for the 'week1' dataset ... 68
Figure 18 - DT grown after tuning for the 'week1' dataset ... 69
Figure 19 - DT grown with the default 'rpart' parameters for the 'week2' dataset ... 70
Figure 20 - DT grown after calibrating for the 'week2' dataset ... 71
Figure 21 - Silhouette plot related to the 'week0' PAM model ... 79
Figure 22 - Silhouette plot related to the 'week1' dataset ... 80
Index of Tables
Table 1 – The project plan ... 34
Table 2 – The description of the dataset’s attributes ... 39
Table 3 – Occurrences of DF/DHF per year ... 42
Table 4 - Occurrences of DF and DHF in the dataset throughout the years ... 42
Table 5 – Means and lowest and highest values recorded for the continuous attributes ... 44
Table 6 – Frequency and percentage of the ‘Age group’ attribute ... 44
Table 7 – Distribution by age of people until 39 years old in Negeri Sembilan ... 45
Table 8 – Distribution by age of people over 39 years old in Negeri Sembilan ... 45
Table 9 – Distribution of people by age group in Negeri Sembilan ... 45
Table 10 – Frequency and percentage of the ‘Gender’ attribute ... 45
Table 11 - Distribution of population within the towns of Negeri Sembilan ... 46
Table 12 - Gender distribution in Negeri Sembilan ... 46
Table 13 - Gender distribution in Seremban ... 47
Table 14 – Frequency and percentage of the ‘Race’ attribute ... 47
Table 15 – Population distribution in Negeri Sembilan according to race ... 47
Table 16 – Population distribution in Seremban according to race ... 48
Table 17 – Frequency and percentage of the ‘Job’ attribute ... 48
Table 18 – Frequency and percentage of the ‘Town’ attribute ... 48
Table 19 – Distribution of the ‘District’ attribute ... 48
Table 20 – Frequency and percentage of different types of the ‘Epidemic’ attribute ... 49
Table 21 - Target class ('Outbreak' attribute) calculation example ... 54
Table 22 – Distribution of values for the 'Outbreak' attribute per week ... 54
Table 24 – Predicted TN, FN, TP and FP with calibrated parameters for the demographic dataset
... 65
Table 25 – Predicted TN, FN, TP and FP with default parameters for the ‘week0’ dataset ... 67
Table 26 – Predicted TN, FN, TP and FP with tuned parameters for the ‘week0’ dataset ... 68
Table 27 – Predicted TN, FN, TP and FP with default parameters for the ‘week1’ dataset ... 69
Table 28 – Predicted TN, FN, TP and FP with calibrated parameters for the 'week1' dataset ... 70
Table 29 – Predicted TN, FN, TP and FP with default parameters for the 'week2' dataset ... 70
Table 30 – Predicted TN, FN, TP and FP with tuned parameters for the 'week2' dataset ... 72
Table 31 – Internal validation measures of the clusters generated for the demographic dataset . 73
Table 32 – Internal validation measures of the clusters generated for the ‘week0’ dataset ... 74
Table 33 – Internal validation measures of the clusters generated for the ‘week1’ dataset ... 74
Table 34 – Internal validation measures of the clusters generated for the ‘week2’ dataset ... 74
Table 35 - Algorithm chosen for each dataset according to the studied measures ... 75
Table 36 – Observations per cluster after applying K-means to the demographic dataset ... 76
Table 37 - Observations per cluster after applying PAM to the 'week0' dataset ... 78
Table 38 - Observations per cluster after applying PAM to the 'week1' dataset ... 79
List of Symbols and Acronyms
AI Artificial IntelligenceAIS Artificial Immune System ANN Artificial Neural Network AR Association Rule
ARFF Attribute-Relation File Format CC Correctly Classified
CP Complexity Parameter
CRISP-DM CRoss-Industry Standard Process for Data Mining
DB Database
DF Dengue Fever
DHF Dengue Haemorrhagic Fever
DM Data Mining
DSS Dengue Shock Syndrome DT Decision Tree
FP False Positive GA Genetic Algorithm
IBM International Business Machines ID Identifier
KDD Knowledge Discovery in Databases MAV Multiple Attribute Value
minConf Minimum confidence minSup Minimum support NCR National Cash Register NSA Negative Selection Algorithm PAM Partitioning Around Medoids PD Port Dickson
RMSE Root Mean Square Error
ROC Receiver Operating Characteristics
RS Rough Set
SE SouthEast
SPSS Statistical Package for the Social Sciences TN True Negative
TP True Positive UI User Interface
Chapter 1
1 Introduction
1.1 Contextualisation
Dengue Fever (DF) is a mosquito-borne viral infection caused by the dengue virus that occurs when a mosquito that is infected with the virus bites a person. The infection causes an illness similar to influenza (commonly known as flu), and can develop itself into a potentially lethal complication called Dengue Haemorrhagic Fever (DHF), which is characterised by leaky blood vessels. It can also evolve to other diseases, namely dengue shock syndrome (DSS), encephalitis and hepatitis. “The clinical features of classical DF include fever, headache, retro-orbital pain, myalgias and arthralgias, nausea, vomiting, and often a rash. Some patients develop haemorrhagic manifestations, such as haematuria, bleeding gums, epistaxis, haematemesis, melaena, and ecchymosis. DHF patients develop thrombocytopenia and haemoconcentration. Some may progress into DSS, leading to profound shock and death if not properly treated” (Ghazali, et al., 2012). Since both DHF and DSS correspond to late stages of infection with dengue virus and no distinction between them will be made in the remaining of this document, from this moment onwards only references to DHF will be made, for the sake of simplicity.
Aedes aegypti, a highly resilient mosquito species, is the main vector of dengue virus. Although dengue outbreaks have also been attributed to aedes albopictus, aedes polynesiensis and several
species of the aedes scutellaris complex (World Health Organization, 2009), this introductory section will only present data related with the aedes aegypti species. This mosquito is a tropical and subtropical species widely distributed around the world, mostly between latitudes 35º N and 35º S, but has already been found as far north as 45º N. Also, because of lower temperatures, aedes aegypti is relatively uncommon above 1000 metres (World Health Organization, 2009). It has 4 serotypes1, DENV-1, DENV-2, DENV-3 and DENV-4, whereas the existence of a fifth has been
discussed (Campbell, et al., 2013; Normile, 2013). Biological and immunological criteria are used to distinguish between the different serotypes. The details about the characteristics of the dengue serotypes go beyond the scope of this work - further readings about this topic can be consulted in the following works (Balmaseda, et al., 2006; Caribbean Epidemiology Center, Pan American Health Organization and World Health Organization, 2001; Kalayanarooj and Nimmannitya, 2000). Aedes aegypti, prefers to lay its eggs in artificial containers commonly found in and around homes, for example, flower vases, old automobile tires, buckets that collect rainwater, and trash in general. Containers used for water storage, such as 55-gallon drums, cement cisterns, and even septic tanks, are also used by aedes aegypti to lay its eggs, and large numbers of adult mosquitoes in close proximity to human dwellings are produced within them. Aedes aegypti eggs acquire resistance to drying very rapidly, only 15h after having been laid. From then on, they can withstand long periods of drought - up to 450 days, according to WHO studies. This resistance is a major advantage for the mosquito since it allows the eggs to survive for many months in a dry place, until the next rainy and warm period, which is conducive to the outbreak.
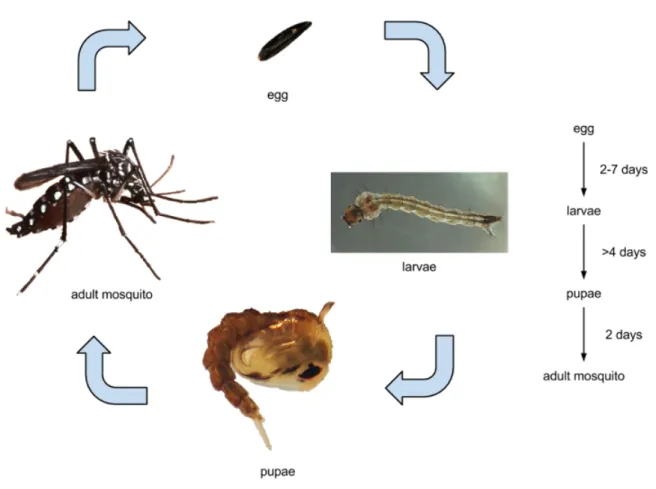
The entire lifecycle of the species, which takes between 8 and 10 days, is depicted inFigure 1. Its
growth starts from an egg, transforming itself in larvae afterwards. The next stage is the pupae, and then it finally becomes an adult mosquito. An adult mosquito can live from 2 to 3 weeks, and only the females will bite to feed on blood, which is necessary for the production of eggs. On average, each female produces 3 to 4 batches of eggs in her lifetime, and about 70 to 80 eggs per batch. According to the WHO, an interesting fact about the dynamics of the disease is that people, rather than mosquitoes, rapidly move the virus within and between communities and places. That happens because most female aedes aegypti may spend their lifetime in or around the houses where they emerge as adults and they usually fly an average of 400 metres.
Figure 1 – Life cycle of aedes aegypti - based on (M., 2010)
Adult mosquitoes prefer to rest indoors. They are unobtrusive, and prefer to feed on humans during daylight hours. There are two peaks of biting activity, namely early morning for 2 to 3 hours after daybreak and in the afternoon for several hours before dark. However, these mosquitoes will feed all day indoors and on overcast days. The female mosquitoes are very nervous feeders, disrupting the feeding process at the slightest movement, only to return to the same or a different person to continue feeding moments later. Because of this behaviour, aedes aegypti females will often feed on several people during a single blood meal. When infective, they may transmit dengue virus to multiple people in a short time period, even if they only probe2 without taking
blood. It is not uncommon to see several members of the same household become ill with dengue
within a 24- to 36-h time frame, suggesting that a single infective mosquito infected all of them. It is this behaviour that makes aedes aegypti such an efficient epidemic vector (Gubler, 1998; World Health Organization, 2009).
After an infective mosquito bites a person, the virus undergoes an (intrinsic) incubation period of 3 to 14 days (average, 4 to 7 days). After that, the person may experience acute onset of fever accompanied by a variety of nonspecific signs and symptoms. This acute febrile period may be as short as 2 days and as long as 10 days. If other aedes aegypti mosquitoes bite the ill person during this febrile viremic stage, those mosquitoes may become infected and subsequently transmit the virus to other uninfected people, after an extrinsic incubation period3 of 8 to 12 days.
The extrinsic incubation period is influenced in part by environmental conditions, especially ambient temperature. Thereafter, the mosquito remains infective for the rest of its life (Gubler, 1998; World Health Organization, 2009). Mosquitoes can also inherit the disease. If a female mosquito is infected with dengue, there is the possibility that its descendant larvae will already be born with the virus, which is called vertical transmission.
During the 19th century, dengue was an intermittent disease that caused epidemics4 at long
intervals, a reflection of the slow pace of transportation and limited travel at that time. Moreover, the disease pattern associated with dengue-like illnesses from 1780 to 1940 was characterised by relatively infrequent but often large epidemics. DF and DHF incidence escalated dramatically due to many factors, namely the rapid and unplanned urbanisation, increased human movement, and ineffective mosquito control. The combination of these factors in developing countries contributed to the expansion of DF and DHF in the urban centres, especially because of the increase of inadequate water storage and disposable containers, which are the ideal breeding sites for aedes aegypti mosquitoes. Nevertheless, it was especially due to the ecological disruption in the Southeast (SE) Asia and Pacific theatres during and following World War II that ideal conditions for increased transmission of mosquito-borne diseases were created, and it was in this setting that a global pandemic5 of DF began, which led to the rise of DHF. The first known epidemic of DHF
occurred in Manila, Philippines, between 1953 and 1954. But within 20 years the malady had spread throughout SE Asia. By the mid-1970s, DHF had become a leading cause of hospitalisation
3 The extrinsic incubation period is the time the disease takes to develop in the aedes aegypti mosquito.
4 An epidemic of a certain disease occurs in areas where its transmission reaches high levels and is then interrupted. For example, in a country where there is a dry season and no mosquitoes breed in a given time of year.
and death among children in the region (Gubler, 1998; Wearing and Rohani, 2006; World Health Organization, 1991).
Today, according to World Health Organisation (WHO), dengue ranks as the most important arthropod-borne6 viral disease in the world, and it been like that since 1983 (Focks, et al., 1993;
Rosen, 1982). In the last 50 years incidence has increased 30-fold. An estimated 2.5 billion people live in over 100 endemic7 countries and areas where dengue viruses can be transmitted. Up to 50
million infections occur annually with 500 thousand cases of DHF and 22 thousand deaths, mainly among children. Prior to 1970, only 9 countries had experienced cases of DHF. Since then the number has increased more than 4-fold and continues to rise (World Health Organization, 2009). Although these numbers are already frightening enough, some authors argue they fall short of the real picture. In (Bhatt, et al., 2013; Campbell, et al., 2013; Normile, 2013) the authors claim the yearly number of infections reaches 390 million, of which 96 million are manifested, far exceeding the WHO estimates in 2009. In (Normile, 2013) the author goes even further, stating that 10% of the DF cases evolve to DHF, contrary to the 1% (500 thousand of 50 million) presented by WHO. In Malaysia, notwithstanding the government’s effort towards sensitising the population on how to deal with DF and DHF, through several awareness campaigns and properly educating the community, the malady has reached the epidemic level. According to the BBC news, the number of people who have died from one of the dengue variants in Malaysia has more than tripled in the first 3 trimesters of 2014, compared to the same period in 2013, with 250 cases being reported daily. The following pictures show the growth of the malady in Malaysia throughout the years.
6 Invertebrate animal that has an exoskeleton, a segmented body, and jointed limbs. This Includes insects, arachnids, myriapods and crustaceans.
7 A disease is endemic when its transmission rates are somewhat stable over the year. In the case of dengue, it occurs in hot countries, with high humidity values, wherein mosquitoes breed throughout the whole year.
Figure 2 - Incidence rate of dengue in Malaysia per year per 100.000 inhabitants. Information
extracted from (Ministry of health Malaysia, 2002, 2003, 2004, 2005, 2006, 2007, 2008, 2009, 2010, 2011, 2012)
Figure 3 - Cases of dengue in Malaysia per year. Information extracted from (Ministry of health
Malaysia, 2002, 2003, 2004, 2005, 2006, 2007, 2008, 2009, 2010, 2011, 2012)
Figure 4 - Number of deaths due to dengue infection in Malaysia per year. Information extracted
from (Ministry of health Malaysia, 2002, 2003, 2004, 2005, 2006, 2007, 2008, 2009, 2010, 2011, 2012)
In Figure 2 it can be seen the incidence rate of the disease in Malaysia per each 100.000 inhabitants, from 1973 until 2012. Although there has been a decrease in the amount of people
infected with the disease in 2011 and 2012, the tendency since 1973 has been an increase in the incidence rate. This tendency is confirmed in Figure 3, which shows the number of cases of dengue in Malaysia since 1996 up until 2012. The number of deaths in Malaysia between 1996 and 2012 is shown in Figure 4. A closer look to the graphs depicted in Figure 3 and Figure 4 suggests a correlation between the number of cases and the number of deaths.
There is no specific treatment for the disease and only recently a vaccine to DF/DHF has been approved.
During December 2015, a vaccine named Dengvaxia has been approved for use in three countries. Mexico and the Philippines approved the vaccine in early December, while in late December the drug has received the green light in Brazil, which had more than 1.4 million cases of the disease in 2015. The clinical development of the product took over 20 years of study and more than 40000 participants, including children, adolescents and adults in 15 countries. The French pharmaceutical company Sanofi developed this vaccine. Exactly when the inoculations will be deployed, and at what price, remains unclear as terms of the vaccine are being negotiated between the company and the countries (clicRBS, 2015; Maron, 2015). Other dengue vaccines are also in development (Bocchini, 2015) but none received approval (Maron, 2015).
Nonetheless, Dengvaxia is not a perfect vaccine. In clinical trials it only reduced the chances of developing the disease by 66%. Also, it is only approved for use in people 9 to 45 years old who live in dengue-endemic areas, not young children or the elderly, or tourists coming from non-endemic areas. "Patients who do chemotherapy treatment, pregnant women, patients who have, for example, AIDS, with very weakened immunity system can not make use of this vaccine", said the Emilio Ribas Institute's virologist, Jean Gorinchteyn. The vaccine seems to be least effective in children younger than nine years old, particularly among kids under six, whose immune systems are especially vulnerable and are therefore the ones who need the vaccines the most. There are also unanswered questions regarding vaccinated individuals who could potentially have more severe cases of the disease if they contract it later in life (Globo, 2015; Maron, 2015).
The approval of Dengvaxia in the three aforementioned countries is remarkable and the next few months will be very interesting and important to assess about how good the vaccine really is, and discuss about its implementation in the vaccination system of endemic countries. But there is still a
long way to go. In Brazil, it will take at least three months for the vaccine to start to be sold, and in April 2016 advisers from WHO will examine the vaccine and provide recommendations for its use (clicRBS, 2015; Globo, 2015; Maron, 2015). Therefore, it is important to devise the means to increase the effectiveness of dengue prevention, in order to avoid that it becomes pervasive (Bee, Lye and Yean, 2009; Tarmizi, et al., 2013b; Yusof and Mustaffa, 2011).
For a disease that is complex in its manifestations, management is relatively simple, inexpensive and very effective in saving lives, as long as correct and timely interventions are performed. It is critical for the public to seek treatment immediately after the appearance of the first symptoms of dengue, and if there has been a previous warning concerning an outbreak, people showing symptoms could look for proper care earlier, that way avoiding any complications that could lead to death. Furthermore, the existence of a surveillance system for dengue might suggest in advance that an outbreak was about to take place in a resource-limited and endemic location, allowing the government to take appropriate measures in due time (Long, 2014; Tarmizi, et al., 2013b; World Health Organization, 2009).
Surveillance can be defined as a reporting system that consists of collection, analysis and dissemination of information to authorities, facilitating timely decision-making and further actions. Through appropriate surveillance systems, agencies dealing with public health might be able to trim down the consequences of outbreaks by predicting potential outbreaks or detecting its occurrence as early as possible. This can lead to a reduction in the mortality, morbidity, and even in the economic effect of an outbreak (Long, 2014; Racloz, et al., 2012; Tarmizi, et al., 2013b). It is in the context presented above that this study will be carried out. The focus will be in the development of descriptive and predictive Data Mining (DM) models that might allow to estimate the probability of dengue outbreaks and its final size, as well as recommending possible ways of action, by relating climate changes and, possibly, other factors8, with the incidence rate of DF/DHF.
The meteorological data comes from the Fakulti Sains Kesihatan (Faculty of Health Sciences) in Universiti Kebangsaan Malaysia (UKM), while the demographic dengue dataset comes from a study conducted by the Unit Kawalan Vektor (Vector Control Unit) of the Pusat Kesihatan (Health Centre)
8 Although the literature suggests that climate changes may be the most important cause behind DF/DHF outbreaks, other factors might also need to be considered (Bee, Lye and Yean, 2009; Reiter, 2001).
from the Hulu Langat district, in the state of Negeri Sembilan, 1 of the 16 states and federal territories in Malaysia. The dengue-related data is private, and thus shall not be disclosed to public. Work previously done on this subject is very recent, as before the Big Data era it was not possible to extract valuable information (and therefore knowledge) from data contained in Databases (DBs) due to computational limitations. But with the Big Data, the fast development, creation and maturity of technologies to store, manipulate and analyse this data in new and efficient ways allowed companies, governments and non-profit organisations to do so in a very effective way (Dean, 2014).
1.2 Motivation and objectives
Mosquitoes can be found throughout the world except in places that are permanently frozen, and constitute the source of many diseases, especially in the tropics. These mosquito-borne diseases have emerged as a major human health concern worldwide, particularly in Malaysia where dengue occurrence has increased recently. It is widely accepted that climate variables, such as high temperatures, humidity and precipitation lead to an increase in mosquito population, which in turn magnifies the incidence and geographic range of dengue. Moreover, the anticipated global warming will surely aggravate this situation. Therefore, strategies to control mosquito population need to be developed and implemented, as well as early warning strategies for dengue. The motivation for carrying out this dissertation work comes from the dimension the disease has reached, especially in Malaysia, but also from the opportunity to work with real data coming from the Malaysian government. By analysing such data, valuable knowledge can be learnt, and given that this knowledge could have enormous applications in human health, any kind of discovery would make this work a success and a step forward in making easier to predict dengue outbreaks in the future, thus saving many lives (Bee, Lye and Yean, 2009; Reiter, 2001). As has been formerly mentioned, factors other than the weather related ones might contribute to the appearance of an outbreak. Since it is commonly accepted that there is a correlation between high temperature, humidity and rainfall with the onset of dengue outbreaks, the study of these factors is the main motivation behind this work.
DM can be divided in 3 distinct classes: descriptive, predictive and prescriptive. The most common class, the descriptive, is used solely to summarise Big Data into smaller chunks of information, from which you can easily obtain valuable knowledge. Predictive analytics is one step further in data reduction. By the means of a more complex set of tools and techniques, it allows analysts to make assumptions about the future. Prescriptive analytics goes a little bit further than the 2 aforementioned DM classes, in a way that it can recommend several courses of action, as well as show the possible outcome of each of them (Bertolucci, 2014). The focus of this study will be on descriptive (like clustering and Association Rules - ARs) and predictive DM (Decision Trees – DTs – are examples of such techniques). Due to decisions that were made while writing this dissertation, clustering and DTs were substantially more used than ARs, and in the next chapters the author will go on details about these techniques. Hence it has been decided to introduce ARs in the present chapter and section.
ARs represent knowledge embedded in data sets as probabilistic hypotheses, and interesting patterns are expected to be found through the use of AR mining, and from them possible dengue preventive measures will be derived. But this process is everything but trivial. When analysing data sets having n attributes there will be 2n
−1 possible item sets, and 3n− 2n+1+1 possible ARs. Even
for modest values of n the number of possible nontrivial ARs will be very large. For n = 14, which
is the number of attributes used in the beginning of this research, there exists more than 16 thousand possible item sets and almost 5 million non-trivial ARs. A brute-force approach to the problem will compute the support and confidence for every AR possible, hence having to scan the whole item set for every AR. But as the support of each rule depends solely on the support of the corresponding item set, decomposing the AR mining into two major subtasks, beginning by seeking frequent item sets followed by the generation of strong ARs from the frequent item sets, is an initial step towards a huge boost in the performance. This step is already done by most of the AR mining algorithms nowadays (Dou, et al., 2008; Simovici; Tan, Steinbach and Kumar, 2005). Apriori (Agrawal and Srikant, 1994) is the most famous algorithm for mining frequent item sets. It starts from candidate item sets with two items, and keeps increasing the size of the item sets. During each phase, it scans the DB for obtaining the support count of the candidate item sets, extracting all the sets satisfying the minimum support (minSup) requirement. Apriori was a pioneer algorithm, to the extent that it was the first to use a support-based pruning, which allowed it to
control the exponential growth of candidate item sets. This happens due to the downward-closure property of support (Tan, Steinbach and Kumar, 2005).
Downward-closure property of support
• If an item set I is frequent, so is every subset of I. • If an item set I is not frequent, no superset of I is.
Despite the improved performance that can be obtained through the support-based pruning, finding frequent item sets with a prescribed support can still offer formidable computational challenges, and is a much more studied problem than generating strong ARs from the frequent item sets. In fact, after the computation of all the frequent item sets, calculating the confidence of an AR does not require additional scans of the transactional data set, which makes the second and last step in AR mining straightforward when compared with the first (Tan, Steinbach and Kumar, 2005).
Rule quality and rule quantity are, therefore, the problems to be addressed in AR mining. Singular items that could be of interest to decision makers may not be found if the minSup is set too high, and setting minSup low, however, may cause combinatorial explosion9. Hence it is necessary to
handle this problem and the aforementioned complexity in the most appropriate way, and that is why the use of GAs will bring added value to the generation of ARs (Kumar and Iyakutti, 2011). GAs are search heuristics that try to reproduce the process of natural selection, therefore incorporating Darwinian evolutionary theory with sexual reproduction. They were invented by John Holland in 1970, and later developed by him and his colleagues and students, becoming popular in 1975 after (Holland, 1975) was published. The main motivation for its use in the discovery of high-level prediction rules is that they perform a global search, allowing to find the maximal frequent item sets in due time. Also, by using tools implementing GAs it will be possible to perform variations and modifications in the GA parameters before each of these runs, allowing to tune and direct the results to what is more desirable (Dou, et al., 2008; Kumar and Iyakutti, 2011).
The evolutionary process is an extremely simplified simulation of its biological version, starting from a randomly generated population of individuals called genome, and evolving this population in steps called generations, towards an objective function or fitness function, that indicates how good a solution is. Each individual in the population is called chromosome, and is a DNA string consisting of genes. In each generation, several chromosomes are selected for reproduction (parents), producing offsprings through random transformations over the parents, namely crossover between pairs of chromosomes and mutations of genes on the selected chromosomes. If the newly generated chromosomes are better (have a better fitness), they are then added to a new population, and the older ones are discarded. By doing this over successive generations, better solutions will thrive, while the least fit solutions will die out. This process is iterative, ending when some previously specified criteria is met (Indira and Kanmani, 2012). A comprehensive description of GAs can be found in (Goldberg, 1989).
1.3 Research methodology
Throughout the literature, the terms process model and methodology have been used to refer to the same thing, which inevitably led to some confusion. Therefore, prior to going into details concerning the employed methodology, the difference between the concepts of process model and methodology must be clarified (Marbán, Mariscal and Segovia, 2009).
A process model can be defined as the set of tasks to be executed to develop a particular element, as well as the elements that are produced in each task (outputs) and the elements that are necessary to perform a task (inputs). Methodology is the instance of a process model that lists tasks, inputs and outputs and stipulates how to do the tasks (Pressman, 2005).
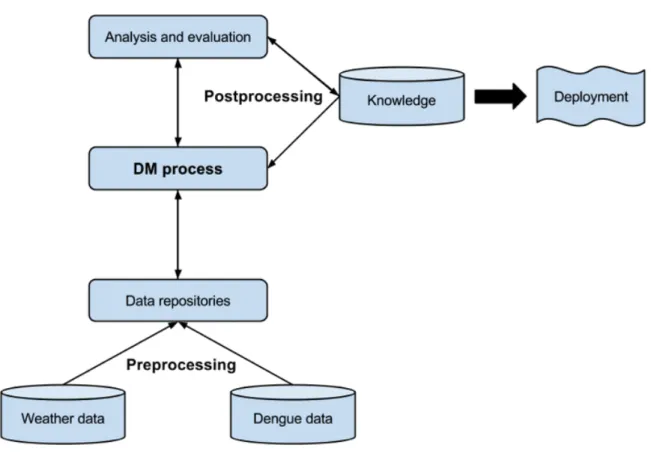
This study was organised in several stages of development. In the first one, some related information about the theme approached was collected and analysed. This phase was carried out as thoroughly as possible, for the purpose of defining the objectives and specific requirements of this project in its entirety. It is necessary to develop an understanding of the application domain before applying the Knowledge Discovery in Databases (KDD) process model, as well as identifying its goal from the customer's point of view. The application of the KDD process, depicted in Figure
5, has three major tasks: preprocessing, DM process and postprocessing, which in turn can be
further subdivided. The actual first step consists in cleaning and integrating the data sources. The occurrence of inconsistencies and duplicate entries is handled in this stage, and mistakes coming from manual inputs, and from other sources, must be properly addressed. In the specific case of this dissertation work, the meteorological data must be matched to the dengue-related data through the time period. Since not all data is relevant to the objectives to be achieved, the second phase consists in selecting task related data from the integrated resources, transforming it afterwards into a format that is ready to be mined. In this stage, the dataset is divided in training and testing datasets in order to derive classification rules, attributes might have to be rescaled for the clustering algorithms to work and the non-nominal variables might be converted to nominal ones, to make it easier to use the association algorithms in next phases of the process (Zhao and Bhowmick, 2003).
The modelling techniques that are more consistent with the main purpose of this dissertation are identified and evaluated, and the most appropriate parameters for these algorithms shall be searched upon through several variations and modifications in those parameters. Subsequently, DM techniques are applied to the derived rules and it is expected that meaningful information shall be learnt. These steps form the core stage of this work. Following there is a period of analysis and evaluation, both of the developed system as well as of the quality of the information derived. The results may not satisfy the requirements, or they might even contradict the application domain. This is why the process is iterative, and it is expected that each step of the KDD has to be reviewed and improved until relevant knowledge is found, or even that the requirements might have to be changed (Zhao and Bhowmick, 2003). The last moment in the development of the research work is the organisation and presentation of acquired knowledge in an intuitive way, so that the final user can easily handle it. This stage is called deployment, and although it is depicted in Figure 5, it is a post KDD task (Azevedo and Santos, 2008; Cios, et al., 2007; Zhao and Bhowmick, 2003).
Figure 5 – The KDD process for the dissertation work
The year 2000 marked the most important milestone in the field of KDD process models: the publishing of the CRoss-Industry Standard Process for Data Mining (CRISP-DM) methodology in (Chapman, et al., 2000). CRISP-DM can be viewed as an implementation of the KDD process model, and is the most used methodology for developing KDD projects. In fact, it is nowadays a de facto standard, thus naturally it was the methodology chosen to carry out this dissertation work. The steps previously defined in this section, including the business understanding that precedes the KDD process model and the models’ deployment that comes after the application of the KDD process model, briefly explain its implementation in the context of the present work (Azevedo and Santos, 2008; Marbán, Mariscal and Segovia, 2009).
CRISP-DM methodology consists of 6 stages (Azevedo and Santos, 2008; Chapman, 1999; Chapman, et al., 2000; Cios, et al., 2007; IBM Corporation, 2011; Rupnik and Jaklič, 2009) (Figure 6), namely:
1. Business understanding. The first step consists of trying to gain as much insight as possible into the project objectives and requirements from a business perspective, and outline a preliminary plan designed to accomplish those objectives.
2. Data understanding. Starting with a data collection and proceeding afterwards to a familiarisation with the collected data, this phase enables data quality problems to be identified, to discover first insights about the data or to detect interesting data subsets. 3. Data preparation. At this stage, all activities needed to construct the final dataset from the
initial raw data will be covered. The designed dataset aggregates the data that will be fed into DM tool(s) in the next moment of the CRIPS-DM methodology.
4. Modelling. At this point, various modelling techniques are selected, created and then applied, and their parameters are calibrated to optimal values. This step finishes with the assessment of models, but since some DM methods may require a specific format for input data, stepping back to data preparation phase is often necessary.
5. Evaluation. The models that have been built having high quality from a data analysis perspective are now evaluated from a business objective perspective, and the steps executed during the model construction are also reviewed. The purpose is to determine whether any important business objective has not been sufficiently scrutinised. A decision about the use of the DM results should be reached at the end of this stage.
6. Deployment. Creating the model might not be the end of the project. Usually, it ends only after organising and presenting the knowledge gained in a way that the customer could use it within decision-making.
Figure 6 – CRISP-DM methodology - based on (Cios, et al., 2007)
Although the CRISP-DM methodology has only been published in 2000, it was first conceived in 1996, and further developed by a consortium of companies, namely SPSS (Statistical Package for the Social Sciences) Inc., Teradata Corporation, Daimler AG, National Cash Register (NCR) Corporation and OHRA. The first version would be first presented in 1999 (Chapman, 1999). After the publication of the methodology in (Chapman, et al., 2000), there have been discussions throughout the years about updating it, but it was only after the SPSS Inc. acquisition by International Business Machines (IBM) Corporation in 2009 that a new version (IBM Corporation, 2011) would be published.
1.4 Document structure
After this chapter it may be found an overview of the work related with the studied topic in chapter 2 - Literature review. In this chapter, an analysis to the work done in the field of creating descriptive and predictive models for dengue outbreaks is shown. The approaches taken by other authors while devising these models are also presented, and an attempt is made to obtain an understanding on the most relevant models that have been developed.
The following chapter - Understanding and preparing the data - goes through the first three steps of the application of the CRISP-DM methodology to the topic of this research, namely Business understanding, Data understanding, and Data preparation, and the following chapter, Modelling the data presents a detailed description of the last three steps undertaken in this work: modelling, evaluation, and deployment. The last chapter of this dissertation - Conclusions and future work - exhibits the most important remarks captured during this research work, along with some notes concerning functionalities and details that can be improved in a near future. In this last chapter the author also talks about the biggest difficulties he had while implementing the CRIPS-DM methodology, and decisions that had to be taken throughout the developing process.
Chapter 2
2 Literature review
The literature review is very important in the scientific work context. It represents the development or knowledge level of some technique, methodology, science, etc., in a specific moment. It must contain the essence of the work that has been done in the approached domain, by referencing tools, technologies, works, etc., that are somehow related to that domain. This part of the work must be critique and weighted: it is not supposed to just list all the works related to the approached area. In fact, at this stage it is expected that the author reflects on the data collected, and relates that data with the subject developed in his work, referencing other works properly, whenever these are mentioned. By doing so, it is possible to achieve a better management of the research, as well as expedite the process of construction and innovation of it.
This chapter is divided in two sections. In the first, DM models that aim to describe and predict DF outbreaks are presented and the author talks briefly about them, and the second will dissert about what has been done in the field of GAs towards deriving (good) ARs. The former will thus address research works that attempt the ultimate goal of this dissertation, which is to devise a mathematical model (or several) able to predict future dengue outbreaks. The second chapter has been included in the literature review because although the focus of the dissertation has shifted from that in an early stage, a lot of effort has been put on it.
2.1 Descriptive and predictive Data Mining models
Several authors have already studied the literature concerning predicting DF outbreaks through DM models extensively (Focks, et al., 1995; Focks, et al., 1993; Racloz, et al., 2012), thus aiming to analyse different modelling methods and their outputs. Therefore, it can be concluded that there is quite an extensive literature regarding the creation of descriptive and predictive dengue models, as will be shown next. However, the work done on this field focus mostly on meteorological drivers, rather than demographic factors. There is also quite an extensive literature regarding vector dynamics.
Newton and Reiter developed the first dengue model (Newton and Reiter, 1992), a deterministic representation in which populations of vectors and hosts were divided into subpopulations representing disease status and the flow between subpopulations was described by differential equations. They have also shown that the use of Ultra Low Volume (ULV) insecticide sprays to control epidemics is not effective in controlling the aedes aegypti, and therefore controlling the epidemic. Several other deterministic models have been devised after that, considering different aspects of the malady. In (Esteva and Vargas, 1998), the authors created a model in which dengue is transmitted in constant human population and variable vector population, and in (Esteva and Vargas, 1999) the same authors modelled the transmission of dengue in a variable human population. They presented a third article (Esteva and Vargas, 2000), in which vertical10 and
mechanical11 transmission of dengue in the vector population were taken into account, and created
a non-linear system of differential equations that modelled the dynamics of transmission of dengue. Two years later, seasonally varying parameters and the presence of two dengue serotypes simultaneously, would be addressed in (Hartley, Donnelly and Garnett, 2002), and in the year after, age structure in the human population (Pongsumpun and Tang, 2003) and presence of two serotypes of dengue at separated intervals of time (Derouich, Boutayeb and Twizell, 2003) were covered in two separate works. In addition, Tran and Raffy demonstrated that remote-sensing data
10 Vertical transmission occurs when the disease is transmitted from one generation to another, in contrast to horizontal transmission, when the spread of the infectious agent happens between members of the same species having no parent-child relationship.
11 A transmission is mechanical when the disease agent does not replicate or develop in the vector, being simply transported from one animal to another (flies). Contrary to mechanical transmission, biological transmission takes place when the vector gets infected, usually through blood from an infected animal, and the agent replicates and/or develops inside the vector, and then regurgitates the pathogen onto or injects it into a susceptible animal. Fleas, ticks, and mosquitoes are common biological vectors of disease.
could be used for building a model of the spatial and temporal dynamics of dengue (Tran and Raffy, 2006).
Several other authors have chosen to take a different approach. In 1995 a pair of stochastic models describing the daily dynamics transmission of DF/DHF in the urban environment were published in (Focks, et al., 1995). This work was based on the simulation of a human population growing in response to country- and age-specific birth and death rates. Many years later, an inter-host three level cellular automata model was presented in (Santos, et al., 2009), describing the pertinent population groups in an urban environment: human, adult vector mosquito, and immature vector in the aquatic phase. Between 2006 and 2009 a series of minimalist stochastic models were developed in Buenos Aires. In (Otero, Solari and Schweigmann, 2006) the seasonal dynamics of aedes aegypti populations in a homogeneous environment are modelled, based on the life cycle of the mosquito. The second model describes the aedes aegypti dispersal driven by the availability of oviposition12 sites in an urban environment (Otero, Schweigmann and Solari, 2008).
The last model, presented in (Otero and Solari, 2010), considered the seasonal and spatial dynamics of the vectors and characterises the disease dynamics triggered by the arrival of viremic people in a city. These three works put a lot of emphasis on the stages of aedes aegypti mosquito life cycle, previously depicted in Figure 1, and shown again in Figure 7: eggs, larvae, pupae, and adults.
Figure 7 – Life cycle of aedes aegypti
In (Yusof and Mustaffa, 2011) a prediction model incorporating least squares support vector machines in predicting future dengue outbreaks was proposed. The data used in the study was collected in 5 districts in the state of Selangor, and comprises of data on dengue cases and rainfall. Several other DM techniques were reviewed in (Long, 2014), in which the focus was on frequent pattern mining and outlier mining to be applied on a generic outbreak detection model.
An outbreak detection model for dengue was presented in (Tarmizi, et al., 2013a; Tarmizi, et al., 2013b). In these articles, which are very similar, three classification methods were used: Artificial Neural Network (ANN), DT - more precisely J48 which is an implementation of the C4.5 algorithm in WEKA (Waikato Environment for Knowledge Analysis), and Rough Set (RS) theory. The evaluation process was carried out through the comparison of the models determined by using the 2 test options available in WEKA: 10-fold cross validation and percentage split. Each model created has been evaluated in terms of several criteria, namely the:
• Correctly Classified (CC), also known as the accuracy of the tested data sample. It indicates the percentage of correct tests of the entire data sample.
• Receiver Operating Characteristics (ROC) value, which has a value between 0 and 1 and it is used to determine whether a model is good to use for prediction. A predictive model is considered weak if the ROC is close to the value of 0.5, while a good predictive model will produce the ROC value close to the value of 1.0.
• The Root Mean Square Error (RMSE) measures the differences between values predicted by a model or an estimator and the values actually observed. Its value is also between 0 and 1 and the best RMSE value is the lowest value.
• F-measure. This is another measure of a test's accuracy. The traditional F-measure or balanced F-score is the harmonic mean of precision and recall. The recall is defined as the fraction of relevant instances that are retrieved, and precision is defined as the fraction of retrieved instances that are relevant. A high value of F-measure indicates that the classifiers have reasonably high precision and recall values.
All models devised in the study conducted in (Tarmizi, et al., 2013a; Tarmizi, et al., 2013b) performed well, especially when compared with the results obtained by previously developed
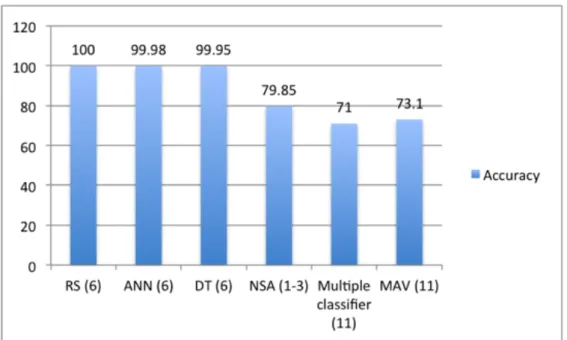
models (Bakar, et al., 2011; Long, et al., 2010; Mousavi, et al., 2013) that used similar datasets, with different number of attributes and representation schemes. Such comparison was also done in (Tarmizi, et al., 2013a; Tarmizi, et al., 2013b) and it is here shown in Figure 8, where the models were evaluated (only) in terms of accuracy (CC). The number in brackets refers to the number of parameters used in each approach. It has been concluded that the significant selection of attributes in the dataset contributed to the good results.
Figure 8 - Comparison of models using similar datasets – based on (Tarmizi, et al., 2013a;
Tarmizi, et al., 2013b)
A Negative Selection Algorithm (NSA) is presented in (Mousavi, et al., 2013). In this article, the authors claim that over the past few years, a lot of effort has been placed on Artificial Immune Systems (AIS), one of the Artificial Intelligence (AI) approaches, in an attempt to successfully predict future dengue outbreaks. "AIS are adaptive systems, inspired by theoretical immunology and observed immune functions, principles and models, which are applied to problem solving" (Castro and Timmis, 2002). The aforementioned paper (Mousavi, et al., 2013) focus on creating a new model for dengue outbreak detection, based in an algorithm from the field of AIS, namely the NSA. As shown in the Figure 8, the accuracy of the results was close to 80%.
NSA outperforms Multiple Attribute Value (MAV) method for dengue outbreak detection, presented in (Long, et al., 2010), in terms of successful detection rate and false alarm rate, which obtains a 73.1% value (at most) in terms of accuracy, as depicted in Figure 8. MAV focuses on the use of AR mining to identify a potential attribute or a combination of attributes, within the data, to be used as indicator of dengue outbreaks. The experiment is conducted using Apriori concept that finds a frequent item based on the MAV of a real data repository and generates ARs. This research started by identifying the possible number of items to be considered in determining outbreaks, based on detection rate, false positive rate and overall performance, and it has been concluded that using maximum item length a better performance is achieved in detecting outbreak and that the use of high volumes of records is not critical in determining the existence of a dengue outbreak.
The model depicted in Figure 8 as multiple classifier was published in (Bakar, et al., 2011). This work presents a predictive model for epidemic detection using multiple rule-based classifiers. The classifiers used are the DT, rough set classifier, naive bayes, and associative classifier. Several models have been developed to study the performance of various rule-based classifiers individually, as well as the combination of the classifiers. The combination of classifiers obtained a better accuracy in comparison with the single classifiers, wherein the best-recorded accuracy was 71.25%.
The quantitative statistical relationship between dengue incidences and rainfall in the Western province of Sri Lanka between 2000 and 2004 has been studied in (Pathirana, Kawabata and Goonatilake, 2009), and a temporal and spatial correlation between post rainfall seasons and dengue disease was discovered. A regression model was obtained using statistical analyses, and it has accurately predicted disease outbreaks using the data. The correlation coefficient for this model has shown that there is a 3 to 4 week lag time between the rainfall and outbreaks. This gives a good hint on where to look for correlations between meteorological factors and DF outbreaks.
In (Flamand, et al., 2014) the objective was to identify local meteorological drivers of DF/DHF in French Guiana, and an original DM method was applied to the available epidemiological and climatic data. The contribution of the DM method to the understanding of factors associated with the propagation of infectious diseases and their spatiotemporal spread was assessed throughout
the research. Contextual sequential pattern extraction techniques were applied to epidemiological and meteorological data to identify the most significant climatic factors for dengue, and the relevance of the extracted patterns was investigated towards an early warning of dengue outbreaks in French Guiana. The maximum temperature, cumulative rainfall, minimum relative humidity, and global brilliance were identified as determinants of dengue outbreaks, and the precise intervals of their values and variations were recorded. In (Flamand, et al., 2014), there is a significant lag between the occurrence of an outbreak and factors related with meteorological conditions, which is even bigger in this work. In fact, the strongest significant correlations were observed between dengue incidence and meteorological drivers after a 4–6-week lag.
2.2 Mining Association Rules through Genetic Algorithms
Several research works that address the use of GAs to mine ARs have been published, especially over the last few years. Nonetheless, the majority of researchers working on this field are focused on DBs with discrete attributes, although most real-world DBs embody essentially continuous attributes. Furthermore, the majority of the tools that work in the continuous domain merely discretise the attributes and treat them as if they were discrete (Vannucci and Colla, 2004). In (Martínez-Ballesteros, et al., 2009) the authors developed a GA able to find ARs over DBs with continuous attributes, avoiding the discretisation as an early step of the process, which would allow the overlapping of the regions covered by the rules. But even before this work, a GA able to mine quantitative and categorical (qualitative) ARs without a prior discretisation of the data was presented in 2007 on (Salleb-Aouissi, Vrain and Nortet, 2007). Its analysis has been fundamental for this research in its early stages, although the tool implemented by Salleb-Aouissi, Vrain and Nortet is much more complex than what is needed to fulfil the requirements of this research. The developed tool's (QuantMiner) algorithm starts with a set of rule templates and then looks dynamically for the “best” intervals for the numeric attributes present in these templates. Each rule template consists of the left-hand side attributes (conditions), and the right-hand side attributes (conclusions), as well as the respective range of values of each quantitative attribute or the category of each qualitative attribute.
QuantMiner allows the user to filter attributes as well as to choose which attributes form the antecedent and consequent of the rules, through the use of a User Interface (UI). It also lets the user choose several parameters, namely the population size, number of generations and percentage of cross-over and mutations, which makes it a very powerful tool. Its interactivity allows avoiding the discovery of hundreds of rules, through establishing minimal values for the support and confidence.
In case studies with frequent item sets containing many items, the candidate item sets will be huge and the algorithm will have to scan the DB millions of times. In (Dou, et al., 2008), the authors call this the low efficient problem of Apriori, and propose an efficient DM technique that allows to overcome it. The tool described in this research gives a quick response to users and provides a friendly UI, said to grant users with real demanded rules. The proposed system consists of two main stages. It starts with the GA, which is used to mine maximal frequent item sets and show them to users. In the second part, ARs are deduced in terms of the maximal frequent item sets and then the DB is scanned for obtaining real support and confidence of those rules. The main characteristic of the implemented GA is that, when judging if an item set is frequent or not, it does not need to scan the DB; it just mines maximal frequent item sets and only scans the sets in which users are interested in. This feature, when properly used, can drastically reduce the mining time, compared with traditional algorithms like Apriori.
The problem addressed in this work will only require mining of single level ARs, but in the Big Data analysis context, strong ARs tend to be in multilevel forms, therefore requiring more complex and efficient methods to be mined efficiently. In (Xu, et al., 2014) the authors presented an innovative algorithm that allows the users to mine good multilevel ARs, and prove its efficiency by testing its performance in several DBs, as well as the classic Apriori algorithm. The results obtained with the newly implemented algorithm were more accurate, and Apriori was even slower than the presented algorithm.
Alatasetal (Alataş and Akin, 2006) is a GA that simultaneously search for intervals of quantitative attributes as well as positive and negative quantitative ARs in a single run of the algorithm. The chromosomes represent rules, with each gene consisting of four parts. The first part serves as the antecedent or consequent of the rule while the second represents the positive or negative ARs and the third and fourth represent, respectively, the lower and upper bound of the item interval. The
proposed GA performs a dataset-independent approach that does not depend on the minSup and minimum confidence (minConf) thresholds. The authors of (Alataş, Akin and Karci, 2008) used Alatasetal to devise a multi-objective differential evolutionary algorithm (MODENAR) capable of mining accurate and comprehensible quantitative ARs without being necessary to specify the minSup and the minConf. This algorithm uses the same coding scheme for the chromosomes as Alatasetal but without the second part. MODENAR considers four objectives to improve the quality of the rules, namely support, confidence, comprehensibility and amplitude of the domain of the attributes. Thus, these objectives form the fitness function.
A GA meant to obtain numeric ARs was introduced in (Yan, Zhang and Zhang, 2009). This algorithm used confidence as a single objective to be optimised in the fitness function. To fulfil this goal, the authors avoided the specification of the actual minimum support, which is the main contribution of this work. Each chromosome of EARMGA, the presented algorithm, encodes a generalised k-rule, where k indicates the desired length. The most interesting rules are returned according to the interestingness measure defined by the fitness function, which relies on the support of the rule and its antecedent and consequent support. The authors demonstrated that the devised algorithm significantly reduces the computation costs and generate interesting ARs only. Both MODENAR (Alataş, Akin and Karci, 2008) and Alatasetal (Alataş and Akin, 2006), as well as EARMGA (Yan, Zhang and Zhang, 2009) were tested in (Martín, et al., 2014), and its results were compared with the GA presented in the same study: QAR-CIP-NSGA-II. The rules that can be obtained with this algorithm are very strong, and it provides a good trade-off between interpretability and accuracy, maximising three objectives: interestingness, comprehensibility and performance. In fact, the authors show that with QAR-CIP-NSGA-II the obtained rules have better values for interesting measures and a higher coverage of the dataset.
Chapter 3
3 Understanding and preparing the data
3.1 Business understanding
The first step of the CRISP-DM methodology is to assess what useful knowledge can be obtained through the DM. At this stage, a thorough analysis might help to prevent the loss of important resources.
3.1.1 Background information
Healthcare is the problem area for this case study, which is becoming an increasingly popular, or better saying, increasingly essential area for DM applications. Due to the complexity of healthcare and a slower rate of technology adoption (and even evolution), the healthcare industry is not taking full advantage of DM solutions, at least when compared with industries like the automotive industry, higher education, life sciences, telecommunications and manufacturing. In fact, DM in healthcare today remains, for the most part, an academic exercise with only a few pragmatic success stories. Although many researchers are using DM extensively in the field of healthcare, the industry has always been slow to incorporate the latest research into everyday practice (Crockett, Johnson and Eliason, 2014). In the specific case of this dissertation, the problem is already