EVALUATION OF TYPE-1 HYPERVISORS ON
DESKTOP-CLASS VIRTUALIZATION HOSTS
Duarte Pousa
1and José Rufino
21
Polytechnic Institute of Bragança, 5300-253 Bragança, Portugal
2
Polytechnic Institute of Bragança, 5300-253 Bragança, Portugal. Laboratory of Instrumentation and Experimental Particle Physics, University of Minho, 4710-057 Braga, Portugal
ABSTRACT
System Virtualization has become a fundamental IT tool, whether it is type-2/hosted virtualization, mostly exploited by end-users in their personal computers, or type-1/bare metal, well established in IT departments and thoroughly used in modern datacenters as the very foundation of cloud computing. Though bare metal virtualization is meant to be deployed on server-grade hardware (for performance, stability and reliability reasons), properly configured desktop-class systems or workstations are often used as virtualization servers, due to their attractive performance/cost ratio.
This paper presents the results of a study conducted on commodity virtualization servers, aiming to assess the performance of a representative set of the type-1 platforms mostly in use today: VMware ESXi, Citrix XenServer, Microsoft Hyper-V, oVirt and Proxmox. Hypervisor performance is indirectly measured through synthetic benchmarks performed on Windows 10 LTSB and Linux Ubuntu Server 16.04 guests: PassMark for Windows, UnixBench for Linux, and the cross-platform Flexible I/O Tester and iPerf3 benchmarks. The evaluation results may be used to guide the choice of the best type-1 platform (performance-wise), depending on the predominant guest OS, the performance patterns (CPU-bound, IO-(CPU-bound, or balanced) of that OS, its storage type (local/remote) and the required network-level performance.
KEYWORDS
Bare Metal Virtualization, Synthetic Benchmarking, Performance Assessment, Commodity Hardware
1.
INTRODUCTION
(Vmware-a, 2016) or Oracle VM VirtualBox (VirtualBox, 2016); b) in bare metal (or type-1) virtualization, the platform hypervisor has direct hardware access, ensuring a more efficient use of the underlying resources; a common approach to type-1 virtualization is to install a thin hypervisor in the host, along with a management console; this console may be minimal, as in VMware ESXi (Vmware-b, 2016), or a management virtual machine, as in XenServer (XenServer, 2016) or Hyper-V (Hyper-V, 2016); an alternative approach is to have a server-class operating system with kernel modules that convert the operating system into a type-1 platform, like in KVM-based (KVM, 2017) platforms, as oVirt (oVirt, 2017) and Proxmox (Proxmox, 2017).
Bare metal virtualization is commonly deployed on server-grade hardware, often vendor-certified for specific type-1 virtualization platforms. This ensures adequate performance, stability and reliability, along with advanced management features, that are essential for mission-critical applications. However, it is usually possible to run most modern type-1 platforms on commodity hardware, and the compromises entailed by such option are acceptable in many scenarios, often related to tight IT budgets (home labs, public schools, SMEs, etc.).
This paper presents the results of benchmarks conducted on Windows 10 LTSB and Linux Ubuntu Server 16.04 virtual machines, hosted in well-known bare metal platforms (VMware ESXi, Citrix XenServer, oVirt, Proxmox and Microsoft Hyper-V), running in desktop-class hardware with reasonable (tough not high-end) configurations. The benchmark applications used in this study included OS-specific benchmarks, namely PassMark for Windows and UnixBench for Linux, and also cross-platform I/O-centric benchmarks, specifically Flexible IO Tester (FIO) and iPerf3. FIO was run within virtual machines deployed both on local and remote storage, and several remote storage options were evaluated (NFS and iSCSI). iPerf3 was ran both between virtual-machines on the same host and in different hosts (linked by 1 Gbps Ethernet). In order to provide a comparison baseline, all benchmarks were conducted in native instances of the operating systems selected for this study, installed on the same host hardware.
The data collected during this study will help answering performance-centric questions like: what is (are) the most suitable type-1 platforms(s) to host modern Windows and Linux guests in commodity servers for different usage patterns (CPU-bound, IO-bound, mixed) ? what is the impact of different guest storage options ? how is network performance affected ? what is the impact introduced by each type-1 hypervisor, compared to a native scenario ?
The rest of the paper is organized as follows. Section 2 introduces the testbed: type-1 platforms; guest operating systems; benchmarks; hosts, guests and remote storage configuration; evaluation methodology. Section 3 presents the benchmarking results. Section 4 revises related work on virtualization benchmarking. Section 5 concludes and sets future work.
2.
TESTBED
2.1 Type-1 Virtualization Platforms
Proxmox 4.4. The specific versions used were the latest ones available when this study began (fall 2016). Bearing in mind the distinction between a virtualization platform and a hypervisor, each platform builds on the following hypervisors, respectively: ESXi, Hyper-V, Xen and QEMU/KVM (for both oVirt and Proxmox). These hypervisors rely on different virtualization techniques (Hwang, J. et al, 2013): i) Para-Virtualization (Hyper-V, Xen, KVM); ii) Hardware-Assisted Virtualization, based on ISA extensions like Intel’s VT-x and AMD-V (all hypervisors); iii) Full Virtualization (ESXi, Xen, KVM). In our study, the type-1 hypervisors choose automatically the virtualization technique to run each guest. Also, from this point onwards, the concepts of type-1 platform and type-1 hypervisor will be used interchangeably.
2.2 Guest Operating Systems
Benchmarks were ran on a small, yet representative set of guest operating systems (OSs), playing specific roles in this study: Microsoft Windows 10 LTSB and Ubuntu Server 16.04 LTS.
The first OS represents the modern line of Windows desktop-centric operating systems. The Windows 10 LTSB (Long Term Servicing Branch) variant is a long-term support version of Windows 10 Enterprise. It is designed for stability, meaning it will seldom (or ever) be updated with new features, but will have security updates and bug fixes for 10 years after its release.
The second OS is a “proxy” for the many Linux-based distributions used in infrastructure
servers. Canonical’s Ubuntu, specifically, has been consistently present at the top of usage
rankings. Also, Ubuntu’s relevance in the cloud space has been steadily growing, becoming a
major player, both at infrastructure layers (IaaS) and as an instance (virtual machine). As with the LTSB Windows variant, a Long Term Support (LTS) Ubuntu version was also selected.
2.3 Benchmark Applications
One of the original experimental conditions devised for this work was to use only multi-platform, free (if possible open-source), and broad (not focused on a single system component) synthetic benchmarks. This would allow to compare different guest operating systems executed on the same type-1 virtual hardware. However, considering the choice of guest Operating Systems, no such benchmarks were found and we resorted to PassMark Performance Test v9 (PassMark-a, 2016) for Windows, and UnixBench v5.1.3 (UnixBench, 2016) for Linux. These are not multi-platform (and PassMark is not open-source), but all other requisites are fulfilled.
PassMark generates CPU, 2D graphics, 3D graphics, Disk and Memory ratings, that are combined in a global PassMark score (PassMark-b, 2017). UnixBench is a system (OS-level) benchmark for Unix-like systems that mostly depends on the OS, libraries and compilers used. It includes tests on General CPU+Memory performance (Dhrystone2), CPU Arithmetic performance (Whetstone), File Copying, Process Creation & Substitution, Context Switching, System Call Overhead, Shell Scripting and 2D/3D Graphics (unfit to Ubuntu Server and so excluded in our study). An overall system index combines the scores of all tests.
iPerf3 (iPerf3, 2017). FIO was used to assess the impact of different guest storage options (local disk-based, remote NFS-based, and remote iSCSI-based). iPerf3 was used to measure IPv4 TCP network bandwidth between virtual-machines on the same host (with special care to not oversubscribe host resources) and in different hosts (linked by 1 Gbps Ethernet).
2.4 Hosts, Guests and Storage Server Specifications
Most benchmarks ran on a single host with the following configuration: CPU = Intel Skylake i7-6700 (4cores/8threads, 3.4/3.8 GHz); RAM = 32 GB 2133MHz DDR4; OS / Hypervisor Disk = 500 GB SSD; FIO Benchmark Disk = 500 GB SSD (capped to 32GB); Discrete GPU = NVIDIA Quadro 4000M. iPerf3 required two of these hosts for inter-host benchmarking.
Most virtual guests were configured with the same generic virtual hardware: vCPU = 1 socket, 4 cores/4threads; vRAM = 8 GB; OS vDisk = 32 GB thin provisioned (on top of the Hypervisor SSD); FIO Benchmark local vDisk = 32 GB thick provisioned (on top of the FIO Benchmark Disk); FIO Benchmark remote vDisk = 32 GB ZFS volume (on top of a remote SSD); Passthrough GPU = NVIDIA Quadro 4000M. Again, iPerf3 implied some changes, namely a vCPU with only 2 cores/2 threads in each guest, to avoid over-commitment (out of the scope of this study) of the host CPU when running two guests in the same host; for fairness, this downsized configuration was also extended to guests used during inter-host benchmarking.
To support FIO benchmarking on the virtual guests running on top of remote storage (via NFS and iSCSI), an auxiliary storage server was setup, with the following specifications: CPU = Intel Lynnfield i7-870 (4cores/8threads, 2.9/3.6 GHz); RAM = 16 GB 1333MHz DDR3; OS and Filesystem = FreeNAS v9.10 with ZFS; OS Disk = 16 GB USB3 PenDrive; Auxiliary Disk = 1TB 7200rpm SATA HD; NFS/iSCSI Disk = 256 GB SSD.
To make native and virtual conditions close as possible, native tests ran with hyperthreading disabled (thus effectively ensuring that only 4 single-threaded cores were available), with RAM limited to 8GB, and only 32GB of raw space from a separate SSD volume for FIO benchmarks. During guests execution, hyperthreading was enabled in the host (as is usual in virtual machine servers), although each guest used only 4 or 2 vCores, depending on the benchmark. Also, there was no vCPU binding to real CPU cores. The default types provided by each hypervisor for vCPUs, vDisks and vNICs were used, without hypervisor optimizations/tuning. All physical machines were connected in an isolated network, through a dedicated 1Gbps Ethernet switch.
2.5 Evaluation Methodology
produces very similar results (RSD values below 3.25%). Therefore, the outcome of FIO is an average of only 3 runs. In turn, iPerf3 takes only 2 minutes per run and so iPerf3 results are again averages of 6 runs per scenario (RSDs were mostly below 8%, with a few exceptional cases reaching up to 33%).
Other testing conditions, common to all benchmarks, were: i) each full benchmark run was preceded by a OS clean boot, followed by a five minute standby time to reduce potential noise introduced during boot; ii) before the first and last run of the benchmarks there was a clean boot of the host hypervisor (also followed by a five minute stabilization phase); iii) automatic update services were turned off in the guest operating systems, to prevent interference during testing; iv) all benchmarks were run with their own default configurations, except otherwise stated.
The simultaneous use of two virtual machines in the iPerf3 benchmark (in each guest,
there’s a client and server thread), required special care in order to ensure that traffic generation begins at the same time in both guests. This was achieved by scripting based on RPyC, a Python library for symmetrical remote procedure calls, clustering and distributed-computing (RPyC, 2017).
Finally, for each hypervisor, there are special drivers for guests, to improve convenience (e.g., copy and paste between host and guest, graceful guest shutdown/reboot from the host, time synchronization between host and guest) and performance (e.g., secondary-storage/2D graphics/network acceleration). These correspond to VMtools in ESXi, XenTools in XenServer, Virtio drives for KVM-based hypervisors (like oVirt and Proxmox), and Integration Services for Hyper-V. Moreover, for Windows guests, VMware provides an optimization tool (VMware-c, 2016) that allows to disable unnecessary services and features to improve performance, and may be applied to Windows guests regardless of the underlying hypervisor. We have conducted benchmarks with/without the accelerations drivers (both in Windows and Linux guests), and with/without the optimizations offered by the optimization tool (Windows guests only). Results with the accelerations drivers installed (the most common real-world scenario) are presented for all benchmarks, in a full comparison of all hypervisors. For PassMark and iPerf3 it is also shown the impact of the presence/absence of the drivers and of the optimization tool (PassMark only), except for Hyper-V, once Integration Services only improve convenience, not performance.
3.
EVALUATION RESULTS
Figures 1 to 8 provide charts with the consolidated results of the various benchmarks conducted. Except otherwise stated, columns represent percentages of absolute scores measured in a native instance, and absolute scores are shown in parentheses, either on the top of the charts or at their bottom. Also, in general, test results are presented rounded to the nearest integer; this facilitates the reading of the charts and hides small differences when these are not considered relevant.
As expected, all hypervisors introduce performance penalties, to different extents depending on the benchmark. On some scenarios, however, guests managed to be faster than native instances (this was especially true and most visible in UnixBench). Although rarely observed, this behavior is not entirely uncommon. In the right circumstances, type-1 hypervisors may provide faster than native performance, because they may be able to manage
hardware resources more efficiently than the guest’s kernel (Che, 2008; Henderson, 2009;
3.1 PassMark Results
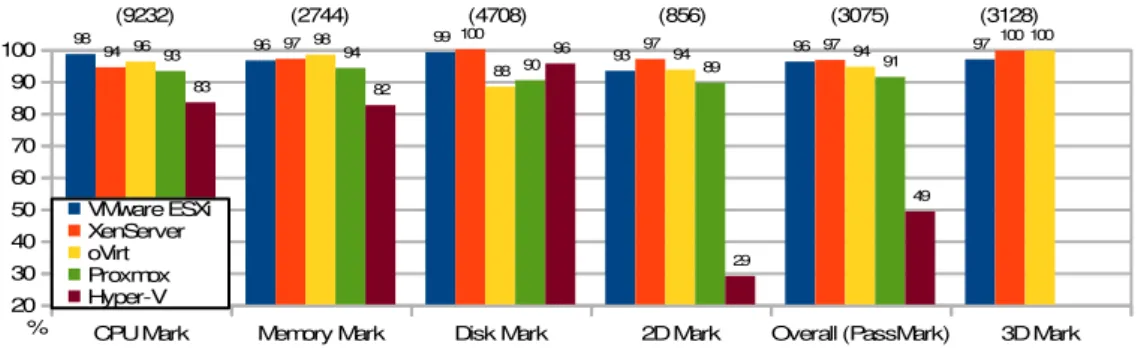
Figure 1 shows the results of PassMark in Windows 10 LTSB with hypervisor drivers installed.
It should be noted that Overall (PassMark) results exclude the contribution from 3D Mark because GPU passthrough was not always entirely successful: in Proxmox, the guest gets stuck at 100% CPU utilization during boot, and in Hyper-V the guest halts during GPU compute tests. Thus, 3D Mark results are presented separately, and only for the hypervisors where GPU passthrough to the Windows 10 guest worked flawlessly and 3D Mark completed.
In CPU Mark, VMware ESXi and oVirt are the top performers, with 98% and 96% of the absolute native score (9232). These two hypervisors (especially VMWare ESXi) are the obvious choices for running CPU-bound applications in a Windows 10 guest. XenServer and Proxmox closely follow, with 94% and 93%, respectively. Hyper-V achieves just 83% of native score.
Memory Mark results are relatively homogeneous: except for Hyper-V, all scores are within a margin of 4% of each other, between 94% and 98% of the native score (2744). Hyper-V, lags behind, to 82%. However, Hyper-V exhibits a good performance in Disk Mark, attaining 96% of the native score (4708), yet still surpassed by ESXi and XenServer, with 99% and 100%, respectively (thus with virtually no performance loss). In turn, oVirt and Proxmox, fall to 88% and 90%, respectively; this may be due to the default Virtio configuration used: it
assumes a “native” instead of a “threads” IO mode, meaning no additional IO threads are created by QEMU to handle extra IO load. As such, for Disk-bound applications with IO load similar to Disk Mark, running in a Windows 10 guest, on top off local hypervisor storage, ESXi and XenServer ensure the very best (if not optimal) performance, with Hyper-V right behind.
Regarding graphical performance, XenServer leads in 2D Mark, with 97% of the native score (856), slightly above ESXi (with 93%), oVirt (with 94%) and Proxmox (with 89%). Hyper-V shows very poor performance, with a relative score of only 29%. 3D Mark, that ran separately, achieved bare metal performance in XenServer and oVirt, and 97% of it in ESXi.
In the Overall score, ESXi, XenServer and oVirt are on the same league, with relative scores of 96%, 97% and 94% of the native score (3075), whereas Proxmox is right below,
Figure 1. PassMark results (% of native): Windows 10 LTSB guest
CPU Mark Memory Mark Disk Mark 2D Mark Overall (PassMark) 3D Mark 20
30 40 50 60 70 80 90
100 98 96 99
93 96 97
94 97
100
97 97 100
96 98
88
94 94
100
93 94
90 89 91
83 82
96
29
49
VMware ESXi XenServer oVirt Proxmox Hyper-V
(9232) (2744) (4708) (856) (3075) (3128)
with 91%. Hyper-V achieves only 49%, mainly due to its poor 2D score; as such, graphical performance aside, Hyper-V is in fact relatively close to the first tier. Also, were 3D Mark included on the Overall score, it would confirm ESXi, XenServer and oVirt as the top hypervisors.
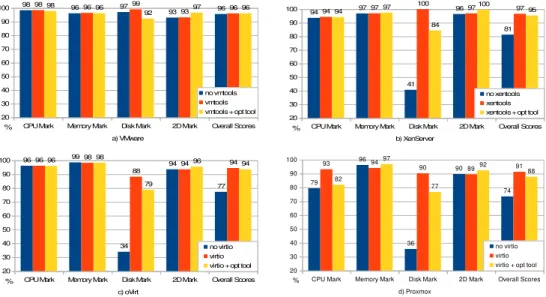
Figure 2. PassMark results (% of native): Windows 10 LTSB guest (impact of hypervisor drivers and VMware optimization tool)
3.1.1 Impact of Hypervisor Drivers and VMware Optimization Tool
The impact on Windows 10 LTSB guests of the presence/absence of the hypervisor drivers, and of the effect of the VMware optimization tool, may be observed in Figures 2.a) to 2.d). Native scores are not shown, once they are the same as the ones already presented in Figure 1.
CPU Mark and Memory Mark results reveal that hypervisor drivers mostly have no influence on the scores of these tests, except in Proxmox, where Virtio drivers increase CPU Mark in 14% (from 79% to 93%), and slightly decrease Memory Mark (from 96% to 94%). Proxmox is also the only hypervisor where VMware optimization tool affects these two tests, pushing down CPU Mark by 11% and increasing Memory Mark in 3% (considering Virtio results as the baseline). In this regard, the behavior of the other three hypervisors is in line
with the initial expectations, whereas the root cause(s) for Proxmox’s deviations is (are) yet to
be identified in future work.
Disk Mark and 2D Mark results, however, follow similar patterns across all hypervisors. Disk Mark always benefits from the presence of hypervisor drivers: true, in VMWare ESXi the improvement is modest (2%), bringing Disk Mark score close to native (99%); however, Disk Mark scores increase dramatically (around 60%) in the other hypervisors, with XenServer being able to reach bare metal performance (100% Disk Mark score); also, as expected, oVirt and Proxmox, both KVM-based hypervisors, show very similar variations on Disk Mark scores. The effect of the VMware optimization tool is also fundamentally the same in all hypervisors, bringing down Disk Mark scores from their top values: these scores fall 7%
CPU Mark Memory Mark Disk Mark 2D Mark Overall Scores 20 30 40 50 60 70 80 90
100 98 96 97
93 96
98 96 99
93 96
98 96
92 97 96
no vmtools vmtools vmtools + opt tool
a) VMware
% CPU Mark Memory Mark Disk Mark 2D Mark Overall Scores 20 30 40 50 60 70 80 90
100 94 97
41 96 81 94 97 100 97 97 94 97 84 100 95 no xentools xentools xentools + opt tool
b) XenServer %
CPU Mark Memory Mark Disk Mark 2D Mark Overall Scores 20 30 40 50 60 70 80 90
100 96 99
34 94 77 96 98 88 94 94 96 98 79 96 94 no virtio virtio virtio + opt tool
c) oVirt
% CPU Mark Memory Mark Disk Mark 2D Mark Overall Scores 20 30 40 50 60 70 80 90 100 79 96 36 90 74 93 94
90 89 91
82 97 77 92 88 no virtio virtio virtio + opt tool
in VMware (to the point that become worse than without hypervisor drivers), and fall even more in the other hypervisors (from 10% up to 16%, though sticking well above the scores without drivers). The explanation for this decreasing lies on the fact that the optimization tool turns off (by default) the Superfetch mechanism that modern Windows versions use to accelerate disk accesses over time; turning off this feature may be beneficial when running many virtual machines at the same time (not considered in our study), as a way to alleviate IO load on storage shared by guests.
2D Mark is mostly insensitive to the presence of hypervisor drivers, in all hypervisors. However, the tuning performed by VMware optimization tool has a positive (yet rather modest) impact: it increases 2D Mark scores between 2% and 4%, depending on the hypervisors. It thus seems obvious that the 2D performance gains introduced by VMware optimization tool are far from counterbalancing the decrease observed in Disk Mark scores due to that tool. However, it was found that one can still achieve the same levels of 2D performance as those ensured by the tool, by specifically disabling Desktop animation effects; by avoiding using the tool, it is thus possible to combine optimal 2D Mark performance with optimal Disk Mark performance.
All in all, Overall scores allow to conclude that hypervisor drivers clearly benefit Windows 10 LTSB performance. Moreover, turning off Desktop effects would yield even better results.
3.2 UnixBench Results
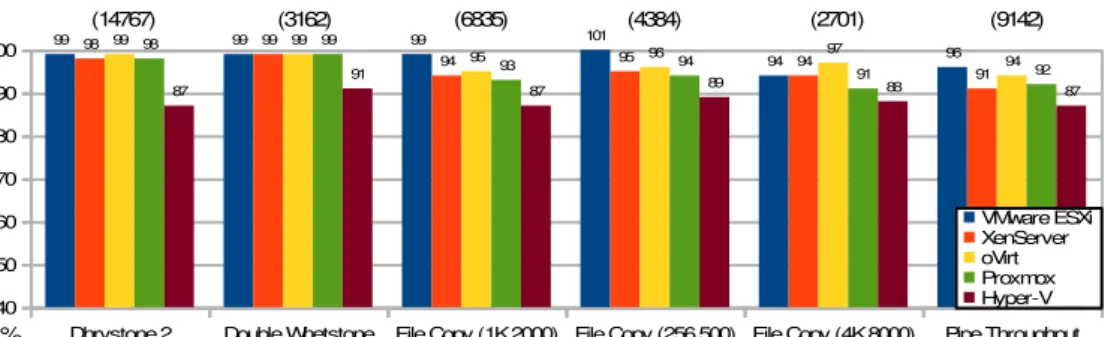
Figure 2 presents UnixBench scores in Ubuntu Server 16.04 LTS. As stated before, UnixBench is an OS-level benchmark, not meant to directly evaluate hardware components. It generates single and multi-threaded results, and only the later are provided (using hypervisor drivers); thus, each test ran in parallel, in 4 separate instances, one per real/virtual CPU-core.
Figure 3a. UnixBench results (% of native): Ubuntu Server 16.04 LTS guest (subset 1)
Dhrystone 2 Double Whetstone File Copy (1K,2000) File Copy (256,500) File Copy (4K,8000) Pipe Throughput 40
50 60 70 80 90
100 99 98 99 99 99 101 94 96
94 95 94
91
99 99
95 96 97
94
98 99
93 94
91 92
87
91
87 89 88 87
VMware ESXi XenServer oVirt Proxmox Hyper-V
(3162)
(14767) (6835) (4384) (2701) (9142)
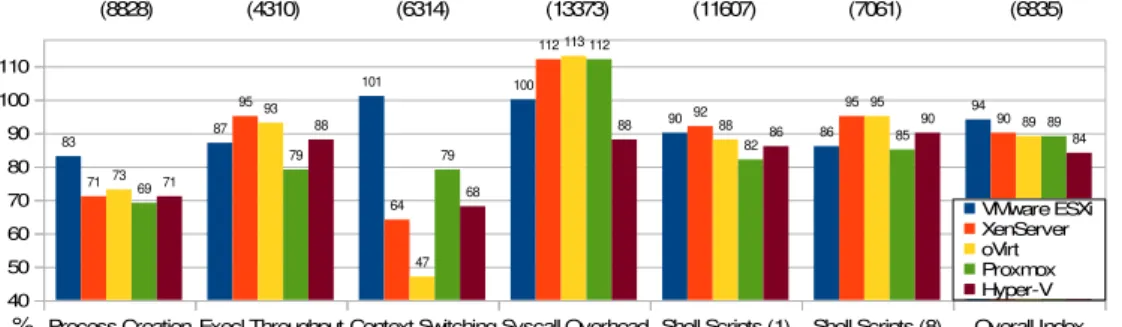
Figure 3b. UnixBench results (% of native): Ubuntu Server 16.04 LTS guest (subset 2)
In the CPU-bound tests (Dhrystone and Whetstone), ESXi, XenServer, oVirt and Proxmox achieve near native performance: between 98% and 99% of native scores (14767 and 3162). The dominance of these hypervisors is in line with what was observed in the CPU Mark test. Hyper-V last rank in CPU Mark also applies to Dhrystone and Whetstone (only 87% and 91%).
File Copy tests measures “the rate at which data can be transferred from one file to another” (UnixBench, 2016), using various buffer sizes (256, 1024, 4096 bytes) and file sizes
(2000, 500, 8000 blocks). They provide clues on file system performance and, indirectly, on secondary storage performance. Taking the average of the relative indexes in these tests, the following hypervisor ranking emerges: VMware ESXi – 97%; oVirt – 95.6%; XenServer – 93.3%; Proxmox – 92.3%; Hyper-V –88%. For what it’s worth, this ranking is only consistent with Disk Mark’s in VMware ESXi and Proxmox; the other hypervisors exchange rankings.
Pipe Throughput measures the rate at which the same process can write data to a pipe and read it back. This “has no real counterpart in real-world programming” (UnixBench, 2016), and results are given for completeness. VMware ESXi is again first, and Hyper-V is again last. Process Creation, a test that measures the rate at which a process can fork and reap a child that exits right away, exhibits relatively low scores: VMware ESXi achieves 83% and the other hypervisors fall between 69% and 83%. This test is related to memory bandwidth, due to memory allocations for new processes (UnixBench, 2016). Yet, there’s no obvious relation with Memory Mark results, perhaps due to the lightness of the Process Creation benchmark: children die immediately, without changing any variables, and with the parent waiting for their
ending; thus, the parent’s data segment never gets duplicated, and so, basically, a child needs
only a stack and kernel memory for its process control block (the code segment is always shared).
Execl Throughput measures the rate at which a process image (code and data) in RAM may be replaced. This involves reading the new code and data from an executable at the file system (FS), into a memory region. However, in this benchmark, the same (small) executable replaces itself, and so FS caching comes into play. We dare to say this benchmark ends up evaluating memory bandwidth, and some hypervisors, namely oVirt, Proxmox and Hyper-V, even keep their positions from the Process Creation test: oVirt first, then Hyper-V, then Proxmox (VMware ESXi and XenServer, however, exchange places). If we take the average of the Process Creation and Execl Throughput benchmarks, the following ranking emerges: VMware ESXi – 85%; XenServer – 83%; oVirt – 83%; Hyper-V – 79,5%; Proxmox – 74%. These values are more balanced, thus more in line with the Memory Mark scores, although lower by more than 10%.
Process Creation Execl Throughput Context Switching Syscall Overhead Shell Scripts (1) Shell Scripts (8) Overall Index 40
50 60 70 80 90 100 110
83
87
101 100
90
86
94
71
95
64
112
92 95 90
73
93
47
113
88
95
89
69
79 79
112
82 85
89
71
88
68
88 86 90
84
VMware ESXi XenServer oVirt Proxmox Hyper-V
(8828) (4310) (6314) (13373) (11607) (7061) (6835)
The Context Switching test measures the rate at which two processes exchange an increasing integer through a pipe. Because both processes strictly alternate execution, this test assesses how fast is context switching (an OS capability important to many real-world applications). It turns out that the results of this test are the most divergent in all UnixBench tests, with a RSD of 22,7%. VMware ESXi is able to sustain faster than native performance, up to 101% of the native index (6314), and Proxmox follows at distance, with 79% score. However, XenServer, Proxmox and Hyper-V only achieve 64%, 47% and 68%, respectively. The oVirt score is intriguing, and deserves further investigation, mostly because, like Proxmox, is KVM-based.
In the Syscall Overhead test, the getpid primitive (a basic system call that returns the ID of the calling process) is repeatedly invoked, so as to measure the cost of entering into and exiting from the kernel. This time, all hypervisors, but Hyper-V, exhibit exceptionally good performance, from 100% of the native index (13373) in VMware ESXi, up to 112% / 113% in XenServer and KVM-based hypervisors. Thus, a system call acceleration mechanism seems to come into play, in the three Linux-based hypervisors. Hyper-V falls behind in this test, at 88%.
The Shell Scripts (n) tests measure the rate at which a process can start and reap a set of
c*n concurrent copies of a script that applies a series of transformation to a data file, where c
is the number of CPU cores seen by the OS. Once c=4 in our testbed, Shell Scripts (1) and Shell Scripts (8) reach up to 4 and 32 concurrent instances of the child script. Comparing the results from both scenarios, XenServer, oVirt and even Hyper-V react more favorably to a load increase, hinting at a better scalability under higher load (to confirm in future work).
Concerning the Overall Index, VMware ESXi leads with 94% of the native index (6835), closely followed by XenServer (90%), and both oVirt and Proxmox (89%), all very near to each other. Hyper-V attains only 84%. Thus, running Linux guests is a task for which Hyper-V seems not as suitable as the other type-1 hypervisors.
3.2.1 Impact of Hypervisor Drivers
UnixBench was also ran without the hypervisors drivers and most scores were similar to those with drivers (within a margin of 5%). This is somehow expected when running Linux guests, once acceleration drivers are already embedded in the kernel to interact with the various hypervisors, and so the role of the hypervisor drivers installed at Linux guests is mostly related to convenience features. There were, though, some specific tests very sensitive to the absence of hypervisor drivers, like Process Creation and (Pipe-based) Context Switching, where scores decrease up to 50% (in VMWare ESXi) or grow around 10% (in XenServer), without drivers. The identification of the specific cause for this behavior will be targeted in future work.
3.3 FIO Results
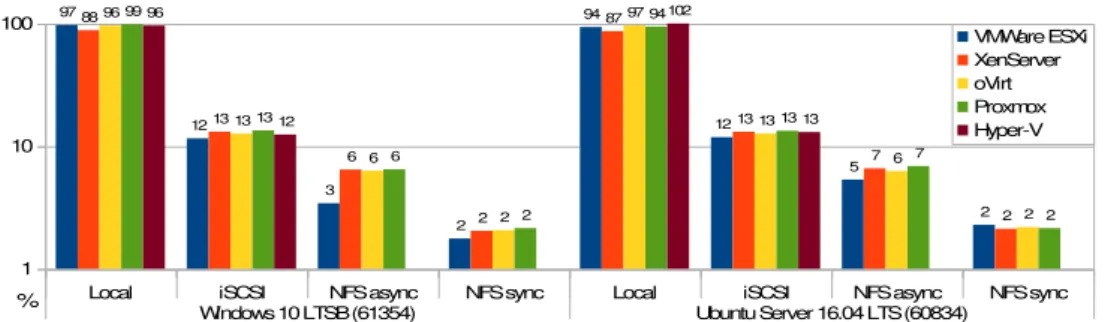
Figure 4. FIO results (% of native): Windows 10 LTSB vs Ubuntu Server 16.04 LTS
Native scores (61534 and 60834) are very similar; as such, relative scores for both operating systems are directly comparable, allowing to confront them for any kind of storage used.
An immediate conclusion is that FIO performance in both OSs is very similar (excluding VMware ESXi over NFS). This supports the following cross-platform conclusions: local SATA SSD storage is ≈10 times faster than the fastest remote storage, provided by the iSCSI protocol; using an NFS share with asynchronous writes (enforced at the ZFS level, on the storage server), ensures approximately half of the performance of an iSCSI volume; finally, NFS with synchronous writes (the default NFS behavior) is roughly one third as fast as asynchronous NFS. We note that results are not provided for Hyper-V and NFS because Hyper-V does not currently support (and likely won’t) virtual disks instantiated on NFS shares (Kolomyeytsev, 2015).
Trying to discover which hypervisor(s) offer the best FIO performance, for each kind of storage, we observe that: i) on local storage, all hypervisors provide very good performance (96,2% to 98,6% in Windows, and 93,6% to 102% in Ubuntu), except XenServer (with only
88,1% in Windows, and 86,7%, in Ubuntu); notably, this contradicts XenServer’s Disk Mark
score of 100,3%, above all others; however, XenServer’s FIO scores are more in line with UnixBench’s File Copy scores, where XenServer was undercut almost just by Hyper-V; ii) with iSCSI, results are very balanced across all hypervisors, and strikingly similar between both OSs; iii) with NFS, results are also balanced, excluding the score produced by the Windows guest on VMware ESXi over NFS asynchronous, that is about half of the other hypervisors.
FIO was run only with hypervisor drivers installed in guests. For local storage, the impact of the presence/absence of drivers was already measured in PassMark Disk Mark and, to some extent, in UnixBench File Copy tests. For remote storage, network-level performance becomes crucial, and this performance was evaluated by iPerf3 with/without hypervisor drivers.
3.4 iPerf3 Results
Figures 5 to 8 show the results of the iPerf3 benchmark executed on the testbed of this study.
Local iSCSI NFS async NFS sync Local iSCSI NFS async NFS sync
Windows 10 LTSB (61354) Ubuntu Server 16.04 LTS (60834) 1
10 100 97
12
3
2
94
12
5
2 88
13
6
2
87
13
7
2 96
13
6
2
97
13
6
2 99
13
6
2
94
13
7
2 96
12
102
13
VMWare ESXi XenServer oVirt Proxmox Hyper-V
Figure 5. iPerf3 intra-host bandwidth: Windows 10 LTSB vs Ubuntu Server 16.04 LTS
Figure 6. iPerf3 intra-host CPU utilization: Windows 10 LTSB vs Ubuntu Server 16.04 LTS
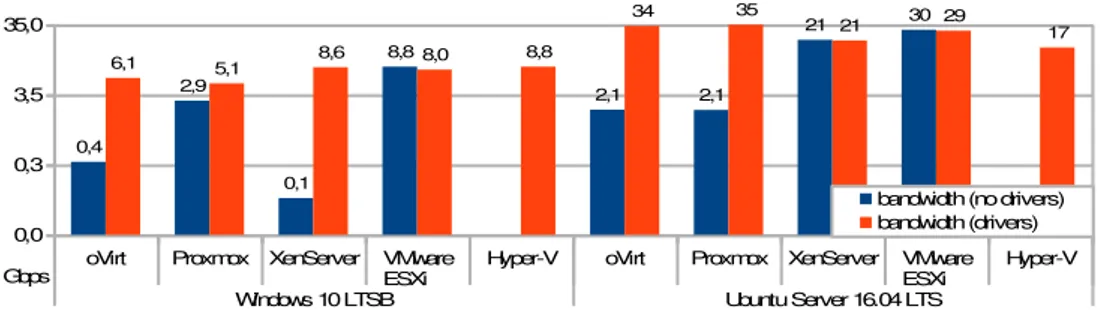
Figure 7. iPerf3 inter-host bandwidth: Windows 10 LTSB vs Ubuntu Server 16.04 LTS
Figure 8. iPerf3 inter-host CPU utilization: Windows 10 LTSB vs Ubuntu Server 16.04 LTS
oVirt Proxmox XenServer VMware ESXi
Hyper-V oVirt Proxmox XenServer VMware ESXi
Hyper-V
Windows 10 LTSB Ubuntu Server 16.04 LTS
0,0 0,3 3,5 35,0 0,4 2,9 0,1 8,8 2,1 2,1 21 30
6,1 5,1 8,6 8,0 8,8
34 35
21 29 17
bandwidth (no drivers) bandwidth (drivers)
Gbps
oVirt Proxmox XenServer VMware ESXi
Hyper-V oVirt Proxmox XenServer VMware ESXi
Hyper-V
Windows 10 LTSB Ubuntu Server 16.04 LTS
0 10 20 30 40 50 60 7 38 2 42 31 31 47 54 22 25
38 42 38
57
63
48
55
40
cpu utilization (no drivers) cpu utilization (drivers)
%
oVirt Proxmox XenServer VMware ESXi
Hyper-V oVirt Proxmox XenServer VMware ESXi
Hyper-V
Windows 10 LTSB Ubuntu Server 16.04 LTS
0,0 0,2 0,4 0,6 0,8 1,0 0,45 0,94 0,13
0,94 0,93 0,93 0,93 0,93
0,91 0,92 0,94 0,94 0,93 0,90 0,94 0,93 0,93 0,93
bandwidth (no drivers) bandwidth (drivers)
Gbps
oVirt Proxmox XenServer VMware ESXi
Hyper-V oVirt Proxmox XenServer VMware ESXi
Hyper-V
Windows 10 LTSB Ubuntu Server 16.04 LTS
0 5 10 15 20 25 7,4 15 2 13 14 9 3,1 5,5 7,7 8 13 14 23
3 3 3,0
5,3 11
cpu utilization (no drivers) cpu utilization (drivers)
Figures 5 and 7 show the average TCP bandwidth measured by iPerf3 between two Windows 10 LTSB guests, or between two Ubuntu Server 16.04 LTS guests, with guests sharing the same host (Figure 5) or in separate hosts (Figure 7). Figures 6 and 8 show the average CPU utilization measured for the duration of the benchmark, under the same conditions. Results are presented with/without hypervisor drivers in guests (the optimization tool impact was found negligible).
In each guest there’s a client and a server thread that exchanges traffic with a server and client thread at the peer guest, respectively. Therefore, the bandwidth values shown are averages of the bandwidth measured in each direction (which was measured to be very similar). Also, the presented CPU utilization is an average for the CPU utilization of all the four threads involved, and includes both user-level and kernel-level components (the two components were added).
Figure 5 reveals dramatic differences between the intra-host bandwidth of Windows and Ubuntu guests. With drivers, Windows attains 5.1 Gbps (under Proxmox) to 8.8 Gbps (under Hyper-V), whereas Ubuntu reaches from 17 Gbps (under Hyper-V) up to 35 Gbps (under Proxmox). The benefit of hypervisor drivers to bandwidth is also mostly evident, except under ESXi, and with Ubuntu under XenServer (for these hypervisors, guest drivers are not meant to accelerate network traffic, and so results are basically equivalent). CPU utilization (Figure 6) is generally lower in Windows than in Ubuntu guests. However, utilization values are much closer between these OSs than bandwidth values, meaning that Ubuntu guests are more efficient (the bandwidth / CPU utilization ratio is approximately twice for Ubuntu). Also, using drivers leads to higher CPU utilization in order to achieve more bandwidth (though ESXi and XenServer are exceptions, as explained before and, oddly, Windows in Proxmox behaves the opposite way).
4.
RELATED WORK
Che et al. (Che, 2008) investigated Xen 3.1 and KVM-60 hypervisors (in a Fedora 8 host), running Linpack, LMbench and IOzone (to measure floating-point CPU power, OS latencies and memory bandwidth, and file system I/O performance, respectively), on Linux Fedora 8 and Windows XP guests (Linpack only). The physical host was a desktop-class machine, with a dual-core CPU and 2 GB of RAM (1.5 GB for guests). Xen ensured close-to-native Linpack and LMbench performance, and sometimes better than native IOzone performance.
Fayyad-Kazan et al. (Fayyad-Kazan, 2013) studied Linux instances modified with RT-Preempt realtime preemption patches, on VMware ESXi 5.1, Xen 4.2.1, Hyper-V 2012 and bare metal. The host was workstation/server-class (Xeon CPU) without hyperthreading capabilities. Guests had 1 vCPU and 1GB of RAM, a rather limited configuration, but some tests were made with more than one VM running, contrarily to our study where only iPerf3 used two VMs. The benchmarks were tailored to evaluate the real-time performance and behavior of real-time OSs (a corner case). Xen performance came up very close to native, followed by Hyper-V and ESXi.
Hwang et al. (Hwang, 2013) evaluated the performance of Hyper-V 2008, KVM, VMware ESXi 5.0 and Xen 4.1.2 under hardware-assisted virtualization settings, using microbenchmarks for CPU (Bytemark), memory (Ramspeed), disk (Bonnie++ and FileBench), and network (Netperf), and also application level benchmarks (Linux kernel compilation and freebench). They also ran several VMs and studied their mutual interference. The host used was server-class, with a four core Xeon CPU, 8 GB of RAM, SAS hard disks and 1 Gbps Ethernet NICs. Guests were based on Ubuntu 10.04 LTS, with 1 or 4 vCPUs, 2 GB of RAM for isolated VMs, and 1GB of RAM for simultaneous VMs. Results showed that, overall, VMware ESXi performed the best, followed by a respectable performance of the other three hypervisors.
Graniszewski et al. (Graniszewski, 2016) analyzed the performance of Hyper-V 2008+2012, VMware ESXi 5.1, Oracle VM Server, XenServer 6.1, and Oracle VM Virtualbox, using component-specific benchmarks (nbench for CPU, netperf for network, FileBench for storage, and ramspeed for memory), that ran on an Ubuntu 12.04 guest. A real-word test (Linux kernel compilation) was also performed. Tests were done with one and two vCPUs, and 2GB RAM. The host was desktop-class, with a low-end configuration (dual-core CPU, 4GB RAM, 5400rpm HD). Results put VMware ESXi on the lead, followed by Xen.
5.
CONCLUSIONS
especially when differences are narrow. Other factors, like the technical background of the IT staff, the organization culture, and the IT budget, play perhaps a more decisive role. But if we were to recommend a type-1 virtualization platform, based only on the performance results observed (and their consistency), VMWare ESXi, oVirt and Citrix XenServer would be our top choices.
While the provided analysis is thorough, there are still many untested scenarios that we intend to cover in future work, such as: i) introduce 10Gigabit Ethernet into the testbed (following the market trend that points to its commoditization) and study its effect on network (iPerf3) and remote storage (FIO) benchmarks; ii) go beyond the default configurations for each hypervisor, trying to assess the best combination(s) of critical setting(s) (CPU types, Main Memory paging, IO options); iii) conduct a representative set of real world benchmarks (including Linux kernel compilation, video transcoding, etc.); iv) assess the performance in multi-server, multi-VM and over-commitment scenarios, taking advantage of industry standard benchmarks, namely SPEC VIRT_SC 2013 (SPECvirt, 2013); vi) study and compare the impact of features like failover / high-availability support, load balancing, live migration, etc.
REFERENCES
Che, J. et al, 2008. Performance Measuring and Comparing of Virtual Machine Monitors. Proceedings of 2008 IEEE Int. Conference on Embedded and Ubiquitous Computing. Shanghai, China, pp 381-386. Fayyad-Kazan, H. et al, 2013. Benchmarking the Performance of Microsoft Hyper-V server, VMware
ESXi and Xen Hypervisors. In Journal of Emerging Trends in Computing and Information Sciences, Vol. 4, No. 12, pp 922-933.
FIO, 2016. Flexible I/O Tester. Available at: https://github.com/axboe/fio (Linux source code), http://bluestop.org/fio/ (Windows binaries)
Graniszewski, W. and Arciszewski, A., 2016. Performance analysis of selected hypervisors. In International Journal of Electronics and Telecommunications, Vol. 62, No. 3, pp 231-236.
Henderson, T. et al, 2009. Xen-based hypervisors push performance limits. Available at: http://www. networkworld.com/article/2271464/data-center/xen-based-hypervisors-push-performance-limits.html Hwang, J. et al, 2013. A component-based performance comparison of four hypervisors. Procs. of 2013 IFIP/ IEEE Int. Symp. on Integrated Network Management (IM 2013). Ghent, Belgium, pp 269-276. Hyper-V, 2016. Try Active Microsoft Hyper-V Server 2016 | TechNet Evaluation Software. Available
at: https://www.microsoft.com/en-us/evalcenter/evaluate-hyper-v-server-2016
iPerf3, 2017. iPerf – The TCP, UDP and SCTP network bandwidth measurement tool. Available at: https://iperf.fr/
Kolomyeytsev, A., 2015. Hyper-V: NFS. Available at: https://www.starwindsoftware.com/blog/hyper-v-vms-on-nfs-share-why-hasnt-anyone-thought-of-that-earlier-they-did-in-fact-2
KVM, 2017. Kernel Virtual Machine. Available at: https://www.linux-kvm.org/page/Main_Page oVirt, 2017. oVirt. Available at: https://www.ovirt.org/
PassMark-a, 2016. PassMark PerformanceTest. Available at: http://www.passmark.com/products/pt.htm PassMark-b, 2017. PassMark Formulas. Available at: http://www.passmark.com/forum/performancetest
/4599-formula-cpu-mark-memory-mark-and-disk-mark
RPyC, 2017. RPyC – Transparent, Symmetric Distributed Computing. Available at: https://rpyc.readthedocs.io/en/latest/
SPECvirt, 2013. SPEC virt_sc 2013. Available at: https://www.spec.org/virt_sc2013/
UnixBench, 2016. BYTE Unixbenchmak suite. Available at: https://github.com/kdlucas/byte-unixbench Vaughan-Nichols, J.S., 2013. Yes, virtualization is faster (sometimes) than native hardware. Available
at: http://www.zdnet.com/article/yes-virtualization-is-faster-sometimes-than-native-hardware/ VirtualBox, 2016. Oracle VM VirtualBox. Available at: https://www.virtualbox.org
VMware-a, 2016. Workstation for Windows – VMware Products. Available at: https://www.vmware.com/products/workstation.html
VMware-b, 2016. Free VMware vSphere Hypervisor. Free Virtualization (ESXi). Available at: https://www.vmware.com/products/vsphere-hypervisor.html
VMware-c, 2016. VMware OS Optimization Tool. Available at: https://labs.vmware.com/flings/vmware-os-optimization-tool