INDICE TEMATICO DE SESIONES PARALELAS
Area A - INFORMACIÓN FINANCIERA Y NORMALIZACIÓN CONTABLE
Información financiera y mercados de capitales
A RELEVÂNCIA DO JUSTO VALOR: ENTIDADES COM TÍTULOS COTADOS NAS BOLSAS DE LISBOA E DE MADRID
OPERATING LEASES: AN ANALYSIS OF THE ECONOMIC REASONS AND THE IMPACT OF CAPITALIZATION ON IBEX 35 COMPANIES
REAL EARNINGS MANAGEMENT AND INFORMATION ASYMMETRY IN THE EQUITY MARKET
FINANCIAL CONSTRAINTS AND EMPLOYMENT GROWTH: EVIDENCE PRE AND POST FINANCIAL CRISIS IN SPAINISH SMEs
EL INFORME DE GESTIÓN: VALIDEZ Y PERSPECTIVAS (REFERENCIA A LOS ÚLTIMOS DESARROLLOS: CNMV, UNIÓN EUROPEA E INFORME INTEGRADO)
Análisis financiero
SALUD FINANCIERA DEL CLÚSTER DEL VINO: LA RIOJA Y CATALUÑA
LA CONTABILIDAD COMO CONSTRUCTORA DE UNA RACIONALIDAD DE CONTROL SOBRE LOS RECURSOS NATURALES
MATERIALIDADE E RISCO, OS EFEITOS DA CRISE DE 2008
IMPACTO DE LA CULTURA EN LA GESTIÓN DE LOS RESULTADOS: UN ANÁLISIS CON SEIS DIMENSIONES CULTURALES Y 19 PAÍSES
Auditoría
ANÁLISIS DE LA MOVILIDAD Y LOS PRECIOS EN EL MERCADO DE AUDITORÍA ESPAÑOL
A CONCORRÊNCIA NO MERCADO DE AUDITORIA PORTUGUÊS: UMA ANÁLISE EMPÍRICA DOS ANOS DE 2010 A 2012
ANÁLISE EMPÍRICA DOS RELATÓRIOS DE AUDITORIA EMITIDOS PELOS FISCAIS ÚNICOS DOS HOSPITAIS PÚBLICOS PORTUGUESES NO PERÍODO DE 2003-2008
Normativa contable internacional
NATIONAL CULTURE AND INTERNATIONAL ACCOUNTING STANDARDS IN BANKING INDUSTRY: IS THERE AN INFLUENCE ON CREDIT RISK?
DIFFERENTIAL INFORMATION CONSEQUENCES OF REAL VERSUS ACCRUALS EARNINGS MANAGEMENT
ANÁLISIS DE LA IMPLEMENTACIÓN DE LAS NIIF-IFRS A NIVEL INTERNACIONAL
AS CORREÇÕES FISCAIS À INFORMAÇÃO FINANCEIRA EM SEDE DE IRC EM STP
THE VALUE RELEVANCE OF THE OPERACIONAL LEASES
Area B - VALORACIÓN Y FINANZAS
Valoración de empresas
INVESTMENT VALUATION CRITERIA IN THE VENTURE CAPITAL SECTOR: A CROSS-EUROPEAN ANALYSIS
EL VALOR DE UN EURO: LA TRANSACCIÓN BANCO DE VALENCIA
HOW MUCH DO THE TAX BENEFITS OF DEBT ADD TO FIRM VALUE?: EVIDENCE FROM SPANISH LISTED FIRMS
SMEs ACCESS TO FINANCE AND THE VALUE OF SUPPLIER FINANCING
VALORACIÓN DE UNA PYME DEL SECTOR PLÁSTICO CON PROPÓSITO DE VENTA
Mercados de valores
INDIVIDUAL BEHAVIOR IN EXPERIMENTAL ASSET MARKETS WITH VOLATILITY SHIFTS
AN EMPIRICAL TEST TO SINGLE AND MULTIFACTOR CAPM MODELS IN THE EURONEXT LISBON (THE PORTUGUESE STOCK EXCHANGE
CRISIS FINANCIERA: EFECTO EN LA COTIZACIÓN BURSÁTIL DE LAS EMPRESAS DE LA BOLSA MEXICANA DE VALORES
Financiación de empresas
VALORACIÓN DE OPCIONES REALES: LA OPCIÓN DE REDUCCIÓNVALORACIÓN DE OPCIONES REALES: LA OPCIÓN DE REDUCCIÓN
THE REGULATORY ROLE OF THE EUROPEAN CENTRAL BANK AND THE EUROPEAN SOVEREIGN DEBT CRISIS: EFFECT IN THE FINANCING OF PORTUGUESE COMPANIES
EL GAP DE LA FINANCIACIÓN A LA PYME INDUSTRIAL DE MÉXICO. UN ESTUDIO COMPARATIVO
SELF-DECLARED FINANCIAL CONSTRAINTS: EMPIRICAL ANALYSIS FOR A SAMPLE OF SPANISH SMES
Análisis de inversiones
DETERMINANTES DE LAS DOTACIONES PARA LOS DETERIOROS DE LAS INVERSIONES CREDITICIAS: CICLO CONTABLE, CICLO ECONÓMICO, MOROSIDAD
A COST-BENEFIT ANALYSIS OF THE LONG-TERM PRISON SENTENCES ENFORCEMENT MODEL
GEOGRAPHICAL PROXIMITY EFFECTS ON THE ADJUSTMENT PROCESS IN THE COMPANIES’ FINANCIAL STRUCTURE. DOES THE FIRM HETEROGENEITY MATTER?
LAS INVERSIONES EN TIC Y SU INCIDENCIA SOBRE EL ÉXITO EMPRESARIAL: UN ANÁLISIS DESDE LA ÓPTICA DE RECURSOS Y CAPACIDADES
PREDICCIÓN DE INSOLVENCIA Y FRACASO FINANCIERO: MEDIO SIGLO DESPUÉS DE BEAVER (1966). AVANCES Y NUEVOS RESULTADOS
C - DIRECCIÓN Y ORGANIZACIÓN
Emprendimiento
DIMENSIONES DEL EMPRENDIMIENTO ENTRE LOS JÓVENES: INTENCIÓN Y REALIDAD
UNA APROXIMACION AL PERFIL DEL EMPRENDIMIENTO FEMENINO: UN ESTUDIO EMPIRICO
LA CULTURA INTRAEMPRENDEDORA Y SU EFECTO EN LA INNOVACIÓN DE LAS SPIN-OFF ACADÉMICAS
ORIENTACIÓN EXPORTADORA DE LAS PYME Y SU RELACIÓN CON FACTORES DE ÉXITO PARA SU DESARROLLO ESTRATÉGICO. RESULTADOS EN COAHUILA, MÉXICO
Innovación
LA CULTURA ORGANIZACIONAL: FACTOR PROMOTOR DE LA INNOVACIÓN PARA EL CRECIMIENTO E INTERNACIONALIZACIÓN DE LAS PYMES DE LA SALUD UBICADAS EN GUADALAJARA, JALISCO, MÉXICO
BARRERAS Y DRIVERS PARA LA ECO-INNOVACIÓN EN LAS PYMES ESPAÑOLAS: ESTRUCTURA FINANCIERA Y ORGANIZACIÓN
LA INNOVACIÓN EN EL SECTOR DE COMPONENTES DEL AUTOMÓVIL Y SU EFECTO EN EL RESULTADO EMPRESARIAL
STARTUP ACCELERATORS: AN OVERVIEW OF THE CURRENT STATE OF THE ACCELERATION PHENOMENON
LA INFLUENCIA DEL ENTORNO EMPRESARIAL EN LA DINÁMICA DE LA INNOVACIÓN Y EN EL RENDIMIENTO DE LA PYME
Aprendizaje y gestión del conocimiento
ELEMENTOS FUNDAMENTALES DEL PROCESO DE APRENDIZAJE ORGANIZATIVO, LA APLICACIÓN DEL CONOCIMIENTO Y LA ORIENTACIÓN AL APRENDIZAJE EN LAS ORGANIZACIONES QUE PRESTAN SERVICIOS DE ASESORAMIENTO FINANCIERO
GESTIÓN DEL CONOCIMIENTO Y SU INFLUENCIA CON LA INNOVACIÓN EN LA PYME
ANÁLISIS DE LAS RELACIONES EXISTENTES ENTRE LOS DISTINTOS NIVELES ONTOLÓGICOS DEL APRENDIZAJE ORGANIZATIVO: UNA APLICACIÓN EN EL SECTOR UNIVERSITARIO
EL USO DE LAS TECNOLOGÍAS DE LA INFORMACIÓN COMO ELEMENTO DE GESTIÓN DEL CONOCIMIENTO EN LAS INSTITUCIONES DE EDUCACIÓN SUPERIOR
Empresa familiar y pymes
LA GESTIÓN DE LA SEGURIDAD Y SALUD EN EL TRABAJO: ELEMENTO CLAVE EN LA COMPETITIVIDAD DE LA PYME
LAS ESTRUCTURAS Y ESTRATEGIAS DE LAS PYMES EXPORTADORAS DE LA REGIÓN DE VILLA MARÍA.(ARGENTINA)
EL EFECTO DE LA IMPLICACIÓN FAMILIAR SOBRE LA EFICIENCIA DE LOS INPUTS DE INNOVACIÓN TECNOLÓGICA: UNA ANÁLISIS DE LAS PEQUEÑAS EMPRESAS INDUSTRIALES ESPAÑOLAS
MODELOS DE NEGOCIO Y COMPETITIVIDAD DE LA EMPRESA FAMILIAR
CONFLICT FAMILY AND BUSINESS SYSTEM
Sectores y sistemas
LA ENTRADA EN UN NUEVO MERCADO INTERNACIONAL A TRAVÉS DE LA COOPERACIÓN EMPRESARIAL: EL CASO DE LA EMPRESA HIDROLUTION-MACROFITAS, S.L.(MSL)
LA COMPETITIVIDAD DE LA INDUSTRIA TEXTIL BRASILEÑA: UNA PROPUESTA PARA EL ANÁLISIS DE LOS INDICADORES SELECCIONADOS
LA IMPORTANCIA DE LA LIQUIDEZ, RENTABILIDAD, INVERSIÓN Y TOMA DE DECISIONES EN LA GESTIÓN FINANCIERA EMPRESARIAL PARA LA OBTENCIÓN DE RECURSOS EN LA INDUSTRIA DE LA PESCA DE PELÁGICOS MENORES EN ENSENADA, B.C.
LA REPERCUCIÓN DEL ROBO HORMIGA EN LAS CADENAS COMERCIALES Y DE SERVICIO. “CASO DE ESTUDIO. EN UNA COMUNIDAD DE MÉXICO”.
Area D - CONTABILIDAD Y CONTROL DE GESTIÓN
Contabilidad y control de gestión
LA PLANIFICACIÓN Y CONTROL EN EL SECTOR DE TRANSPORTE AÉREO: ESTUDIO EXPLORATORIO
EVALUACIÓN CRÍTICA DE LA PERTINENCIA DEL VALOR RAZONABLE Y EL GOBIERNO CORPORATIVO ANGLOSAJÓN PARA EL CONTROL EN LAS ORGANIZACIONES EN COLOMBIA
STRATEGIC MANAGEMENT ACCOUNTING: DEFINITIONS AND DIMENSIONS
AMBIDEXTROUS ORIENTATION AND THE USE OF MANAGEMENT ACCOUNTING SYSTEMS
RIESGO PERCIBIDO Y MECANISMOS DE CONTROL EX ANTE EN LOS ACUERDOS DE COLABORACIÓN DE PEQUEÑAS EMPRESAS PARA EL DISEÑO Y DESARROLLO DE PRODUCTOS TECNOLÓGICOS
SISTEMA DE COSTEO EN EMPRESA DEL SECTOR CÁRNICO
Area F - SECTOR PÚBLICO
Entidades locales y sector público
DIVERSIDADE DE GÊNERO E A PERFORMANCE ECONÔMICA-FINANCEIRA: PERSPECTIVA NO SETOR PÚBLICO BRASILEIRO
IS TIME REALLY IMPORTANT IN CONTRACTING OUT OF LOCAL PUBLIC SECTOR? THE IMPACT OF FINANCIAL CONDITION AND GREAT RECESSION
CONVERGENCIA DE LOS SISTEMAS DE INFORMACIÓN PÚBLICA EN EUROPA: LA INCIDENCIA DEL SEC 2010
INFLUENCIA DEL ENTORNO EN LAS REFORMAS DE LOS SISTEMAS FINANCIEROS GUBERNAMENTALES EN CENTRO AMÉRICA: EL CASO DE PANAMÁ
IMPACTO DE LA NUEVA INSTRUCCIÓN DE CONTABILIDAD LOCAL EN LAS CUENTAS ANUALES DE LAS ENTIDADES LOCALES
EL PAPEL DE LA INFORMACIÓN FINANCIERA EN EL PROCESO DE ACCOUNTABILITY: EL CASO DE LOS AYUNTAMIENTOS DE SÃO TOMÉ Y PRINCÍPE
IMPLANTACIÓN DE LAS RECOMENDACIONES DE LA AUDITORÍA OPERATIVA EN AMÉRICA LATINA: PERCEPCIÓN DEL IMPACTO EN LAS ENTIDADES AUDITADAS
Area G y I- NUEVAS TECNOLOGIAS Y CONTABILIDAD - COOPERATIVAS
Contabilidad cooperativas y nuevas tecnologías
LA GESTIÓN EN SEGURIDAD DE LA INFORMACIÓN Y EL IMPACTO EN EL DESEMPEÑO DE LOS CONTROLES: UN ESTUDIO EMPÍRICO EN LAS PYMES COLOMBIANAS
IMPACTO DE LAS TECNOLOGÍAS DE INFORMACIÓN Y COMUNICACIÓN EN LA DIVERSIFICACIÓN EMPRESARIAL. REVISIÓN DE LA LITERATURA
INNOVACIÓN E INTERNACIONALIZACIÓN. FACTORES CLAVE DE COMPETITIVIDAD EN COOPERATIVAS AGROALIMENTARIAS
COMPARISON OF THE FINANCIAL BEHAVIOUR OF AGRI-FOOD COOPERATIVES WITH NON-COOPERATIVES FROM A STATIC AND DYNAMIC PERSPECTIVE: AN EMPIRICAL APPLICATION TO SPANISH COMPANIES
THE GOVERNANCE OF AGRICULTURAL COOPERATIVES: EVIDENCE FROM SPAIN
Area H - RESPONSABILIDAD SOCIAL CORPORATIVA
RSC y gestión
THE INFLUENCE OF CORPORATE SOCIAL RESPONSIBILITY PRACTICES ON ORGANIZATIONAL PERFORMANCE: EVIDENCE FROM ECO-RESPONSIBLE SPANISH FIRMS
INSTRUMENTO DE MEDIDA PARA LA RELACIÓN ENTRE LA RESPONSABILIDAD SOCIAL EMPRESARIAL, LAS PRÁCTICAS FORMATIVAS Y EL DESEMPEÑO EMPRESARIAL
RESPONSABILIDAD SOCIAL CORPORATIVA Y CAPITAL INTELECTUAL EN LAS ORGANIZACIONES
CORPORATE SOCIAL RESPONSIBILITY AND ITS EFFECT ON ORGANIZATIONAL INNOVATION AND FIRM PERFORMANCE: AN EMPIRICAL RESEARCH IN SMES
Responsabilidad social corporativa sectorial
¿MEJORES NIVELES DE RESPONSABILIDAD SOCIAL CORPORATIVA EN EMPRESAS COTIZADAS?
STAKEHOLDERS AND FINANCIAL DISTRESS IN SMALL AND MEDIUM ENTERPRISES. AN EMPIRICAL EXAMINATION
ACCOUNTABILITY Y SECTOR VERDE: FACTORES EXPLICATIVOS COMPLEMENTARIOS A NIVEL REGIONAL
Información integrada y no financiera
ANÁLISIS EMPÍRICO DE LA INFORMACIÓN NO FINANCIERA DESDE UNA PERSPECTIVA INTERNACIONAL: COTIZADAS VERSUS NO COTIZADAS
INFORMACIÓN INTEGRADA Y COSTE DE CAPITAL
ANÁLISIS DE LOS FACTORES DETERMINANTES DE LA RELACIÓN ENTRE EL PERFORMANCE SOSTENIBLE Y LA TRANSPARENCIA EN EL REPORTING SOBRE SOSTENIBILIDAD. UNA AMPLIACIÓN DEL MODELO DE ULLMAN
ANÁLISIS DE LOS INDICADORES DE LA RESPONSABILIDAD SOCIAL EN EMPRESAS DE BAJA CALIFORNIA
Verificación de control de las RSC
THE CAUSAL LINKS BETWEEN VOLUNTARY CSR DISCLOSURE AND INFORMATION ASYMMETRY. THE MODERATING ROLE OF THE STAKEHOLDER PROTECTION
THE MEDIATING EFFECT OF ETHICAL CODES ON THE LINK BETWEEN FAMILY FIRMS AND THEIR SOCIAL PERFORMANCE
CSR ASSURANCE IN SENSITIVE SECTORS – A WORLDWIDE ANALYSIS OF FINANCIAL SERVICES INDUSTRY
ADOPTION OF SUSTAINABILITY ASSURANCE: TO BE A NON-PROFIT ORGANISATION MATTER?
Area J - ENTIDADES SIN FINES DE LUCRO
Entidades sin fines de lucro
LA INFORMACIÓN CONTABLE Y SU VINCULACIÓN CON LAS OBLIGACIONES TRIBUTARIAS EN LAS ENTIDADES SIN ÁNIMO DE LUCRO
DETERMINANTES DE LA EFICIENCIA EN LAS FUNDACIONES ESPAÑOLAS
EL SECTOR FUNDACIONAL EN ESPAÑA: LA INFORMACIÓN ESPECÍFICA A SUMINISTRAR EN SUS ESTADOS CONTABLES
Area K - TURISMO
Sector hotelero
ANÁLISIS DEL APRENDIZAJE ORGANIZACIONAL EN EL SECTOR HOTELERO. UNA APLICACIÓN AL SECTOR HOTELERO VALENCIANO
APRENDIZAJE E INNOVACIÓN COMO FACTORES DETERMINANTES EN LA GESTIÓN DEL CONOCIMIENTO AMBIENTAL EN LAS EMPRESAS HOTELERAS
EL SISTEMA UNIFORME DE CUENTAS PARA LA INDUSTRIA HOTELERA. PRINCIPALES ASPECTOS Y UTILIDADES PARA LA PLANIFICACIÓN Y EL CONTROL
Turismo: sectores y regiones
MODELAÇÃO DA PROCURA TURÍSTICA EM MOÇAMBIQUE
ÍNDICE DE DESENVOLVIMENTO TURÍSTICO APLICADO À REGIÃO NORTE DE PORTUGAL: UM CONTRIBUTO ESTRATÉGICO
EVOLUCIÓN DE LOS SEGMENTOS DE LAS COMPAÑÍAS AÉREAS Y EL APROVECHAMIENTO DE SU CAPITAL HUMANO EN LA CALIDAD DE SERVICIO COMO VENTAJA COMPETITIVA
FACTORES QUE INHIBEN EL DESARROLLO DE LA INDUSTRIA VINÍCOLA EN EL VALLE DE GUADALUPE, B.C. MÉXICO
UNA PROPUESTA DE BUSINESS MODEL CANVAS PARA EL DESARROLLO DEL TURISMO DE FLAMENCO
OPEN FORUM
Información contable y valoración y finanzas
A LEASING WITH ABANDONMENT OPTION
COMENTARIOS ACLARATORIOS SOBRE EL NÚMERO 5º, DEL APARTADO 2 DEL ARTÍCULO 75 DE LA LECO (Real Decreto-Ley 11/2014, de 5 de septiembre)
DIAGNÓSTICO DE LA PLANIFICACION FINANCIERA EN PYMES DEL SECTOR MANUFACTURERO DE DUITAMA
DIAGNÓSTICO DEL CONCURSO DE ACREEDORES ESPAÑOL DESDE LA PERSPECTIVA DEL ADMINISTRADOR CONCURSAL
ANÁLISIS DE LAS MOTIVACIONES DE LOS INVERSORES DE ORIGEN RUSO PARA ENTRAR EN EL MERCADO ESPAÑOL
UMA ANÁLISE DO NÍVEL DE EVIDENCIAÇÃO RELATIVO AO ATIVO INTANGÍVEL NO BRASIL
IMPUESTOS DIFERIDOS: NUEVAS REALIDADES ECONOMICAS Y FINANCIERAS
A CONTABILIDADE E O CONTROLO DE QUALIDADE
CAMBIOS EN LAS INVERSIONES ESTRATÉGICAS DE LOS GRUPOS EMPRESARIALES BAJO NIIF EN COLOMBIA
Direcciòn y organización
ESTILOS DE LIDERAZGO EN LA DIRECCIÓN DE MICROEMPRESAS
LA CULTURA ORGANIZACIONAL Y SU IMPACTO EN LA IMPLEMENTACIÓN DE LAS NIIF
FACTORES EMPRESARIALES DE LOS ESTUDIANTES Y DOCENTES UNIVERSITARIOS
LA GERENCIA, EL NEUROMARKETING Y EL MERCHANDISING DE RETAIL DE BAJO PRESUPUESTO UN NUEVO MODELO PARA APLICAR EN PEQUEÑAS Y MEDIANAS SUPERFICIES
INNOVANNDO EL EMPRENDIMIENTO
LA CALIDAD EN EL SERVICIO AL CLIENTE COMO FACTOR DE COMPETITIVIDAD EN LAS PYMES
ESTUDIO DE LA SITUACIÓN DE LAS MICROEMPRESAS EN LA REGIÓN DE VILLA MARÍA.(ARGENTINA)
Dirección y control
DO TAX CREDITS HELP R&D A BIBLIOMETRIC ANALYSIS OF THE LITERATURE
LA RESPONSABILIDAD SOCIAL UNIVERSITARIA: AUTODIAGNÓSTICO DE LA EFECTIVIDAD DE LA RELACION UNIVERSIDAD SOCIEDAD EN LA UNIVERSIDAD ESTATAL DE COAHUILA, MÉXICO
COSTOS AMBIENTALES EN EL POS ACUERDO EN COLOMBIA, IDENTIFICACIÓN DE UN MODELO PARA LA EVALUACIÓN
CONTROLO DE GESTÃO NAS EMPRESAS EM SITUAÇÃO DE TURNAROUND, COM FOCO NA CONTRIBUIÇÃO DA CONTABILIDADE DE GESTÃO: UMA REVISÃO DA LITERATURA
SOSTENIBILIDAD Y MEDIO AMBIENTE: APROXIMACIONES INTERDISCIPLINARIAS DEL MANEJO ECONÓMICO, ADMINISTRATIVO Y CONTABLE
LA METODOLOGÍA DE COSTEO INTEGRAL UNA PROPUESTA DE REFLEXIÓN Y APLICACIÓN PARA EL LABORATORIO CLINICO DEL SERVICIO MEDICO DE LA UNIVERSIDAD DEL VALLE CALI COLOMBIA
Sector público y nuevas tecnologías
LA RIGIDEZ DEL GASTO CORRIENTE Y OTROS INDICADORES PRESUPUESTARIOS LOCALES DURANTE LA CRISIS ECONÓMICA. ANÁLISIS Y EVOLUCIÓN SEGÚN TRAMOS DE POBLACIÓN
LA CONTABILIDAD PÚBLICA EN SÃO TOMÉ Y PRÍNCIPE: SITUACIÓN ACTUAL Y PERSPECTIVAS FUTURAS
ADMINISTRACIÓN PRESUPUESTARIA EN CENTROS INTEGRADOS PÚBLICOS DE FORMACIÓN PROFESIONAL: PROPUESTA PARA UN CENTRO DE LA COMUNIDAD VALENCIANA
EL ROL DEL SECTOR PÚBLICO EN EL COMPORTAMIENTO INNOVADOR DE LAS PYMES. EL CASO DEL POLO EÓLICO BUENOS AIRES
RELACIÓN ENTRE SOCIEDADES DE CONTROL Y CONTABILIDAD DESDE LAS NUEVAS TECNOLOGÍAS
EL E-COMMERCE COMO FACTOR DE INNOVACIÓN E INTERNACIONALIZACIÓN: SITUACIÓN DE LAS MIPYMES EXPORTADORAS COSTARRICENSES
RSC, Turismo y entidades sin fines de lucro
LA PREVISIÓN SOCIAL COMO UNA ESTRATEGIA EN EL DESARROLLO DEL CAPITAL HUMANO Y SU IMPACTO FISCAL EN LAS ORGANIZACIONES
FACTORES REITERADOS EN SANCIONES DISCIPLINARIAS APLICADAS A LOS CONTADORES PÚBLICOS DE COLOMBIA
REVISIÓN TEÓRICA SOBRE TRANSPARENCIA Y RENDICIÓN DE CUENTAS EN EL SECTOR DE LAS ONG
ESTUDIOS DE LA CALIDAD DE LOS SERVICIOS HOTELEROS Y SU INCIDENCIA EN EL DESARROLLO TURÍSTICO DEL CANTÓN MILAGRO - ECUADOR
IR ARRIBA
THE REGULATORY ROLE OF THE EUROPEAN CENTRAL BANK AND THE EUROPEAN SOVEREIGN DEBT CRISIS: CONSEQUENCES IN PORTUGUESE
COMPANIES FINANCING
Sandra Teixeira
Polytechnic Institute of Bragança, Portugal
Ana Paula Monte (responsável)
Polytechnic Institute of Bragança, Portugal
Unidade de Investigação Aplicada em Gestão (UNIAG), Portugal; NECE1 (UBI, Portugal)
Área temática: B)Valoración y Finanzas
Palabras-clave: Banco Central Europeo (BCE); crisis de la deuda soberana; financiación bancaria; Empresas no financieras.
Keywords: European Central Bank (ECB); sovereign debt crisis; bank financing; Non-financial companies.
THE REGULATORY ROLE OF THE EUROPEAN CENTRAL BANK AND THE EUROPEAN SOVEREIGN DEBT CRISIS: EFFECT IN THE FINANCING OF
PORTUGUESE COMPANIES.
Abstract
Taking into account the impact that the sovereign debt crisis reached within the European
Union, the objective of this study was to examine what regulatory role for European
Central Bank (ECB) plays and how it can contribute to the control of the sovereign debt
Member States. In this sense, a comparative analysis of the role of the ECB and the
Federal Reserve (FED) in response to the international financial crisis was made. In the
second part of this work we used an econometric model of multiple linear regressions to
assess the influence that the sovereign debt crisis has had in lending to Portuguese
companies.
Keywords: European Central Bank (ECB); sovereign debt crisis; bank financing;
INTRODUCTION
The financial crisis that began in 2007, in the United States, quickly spread to Europe and
became the largest economic and financial crisis since the 1930s. The collapse of
financial markets revealed the vulnerabilities of the financial system and worsened the
fiscal position of some euro zone countries. From the end of 2009 and early 2010,
countries such as Greece, Ireland and Portugal, began to have their own debt financing
problems and were forced to pay interest rates higher for each investment fund - the
sovereign debt crisis.
Central banks, faced with weaknesses in the banking sector, handled a dilemma:
choose between the moral hazard of guaranteed redemption and the destabilization of the
financial system in general caused by the collapse of major financial institutions of
systemic point of view (“too-big-to-fail”) (Paulo, 2012). The systemic crisis that affected the
euro area has highlighted serious inconsistencies in the governance model, internal
organization and the instruments available to the management of the single currency
(Costa, 2014). Lock the risk of contagion to other Member States and to preserve the
stability of the Eurozone became thus the most urgent objectives of the European Central
Bank (ECB) (Lourtier, 2011). The reform of the financial system, which has been
implemented in recent years, came thus strengthen the commitment to the establishment
of the European Banking Union that will allow a more rigorous supervision of financial
markets (Farhi & Tirole, 2014; Praet, 2014). Given the size that the sovereign debt crisis
hit and its repercussions in the whole euro area, the objective of this research will be
conducted into the regulatory role that the ECB took over during this turbulent period, from
December 2007 to December 2013, and how Portuguese companies suffered constraints
on bank financing.
The paper is structured in three sections, including this introduction and
conclusion. In first section will be held a comparative analysis between the ECB's actions
and the actions of the Federal Reserve System (FED), subsequent the recent
international crisis. Then a brief analysis of the economic literature on the financing
constraints will be done as Portuguese companies seem to experience it in recent years.
The third section presents the results of the empirical research conducted, starting with
the definition of objectives and research hypotheses, followed by the description of the
variables and the base data. Then it is presented the univariate analysis and correlation of
these variables and it ends with presentation of the estimated econometric model -
multiple linear regression models. Finally we present the most important conclusions of
3 1. THE EUROPEAN CENTRAL BANK (ECB) AND THE FEDERAL RESERVE SYSTEM (FED) REACTION TO THE RECENT FINANCIAL CRISIS
With the bankruptcy of Lehman Brothers in 2008, whose main effect was the loss of
confidence in the financial system and the reluctance of banks to lend money to each
other, the primary objective of central banks became unlock the interbank markets,
facilitating substantially the access to the financial system. To achieve this goal, central
banks (ECB and FED) responded quickly down interest rates and adopting a wide range
of conventional and unconventional measures. During the first phase of the crisis
(2007-2009), the ECB's policy was similar to the policy adopted by the FED. However, between
2010 and 2012, the perception of risk in financial markets on both continents was
different.
In May 2010, when the markets went into panic due to possible insolvency of
Greece, the Governing Council decided to intervene and started buying Greek bonds in
secondary markets in order to reduce market pressure. In these exceptional
circumstances the ECB launched the Securities Market Program (SMP) to restore the
proper functioning of the transmission mechanism of monetary policy and in order to
maintain price stability in the medium term (BCE, 2010). However, as Gros, Alcidi, and
Giovannini (2012) and Bagus (2012) report, the program was not effective in combating
the rise in yields of peripheral countries, because it was found that after each SMP
intervention there was a slight decrease in yields, followed by an increase of this break.
This apparent failure may have been due to the small amounts involved in each operation.
Conversely, in the US, as of 2010, the main concern became the recovery of the economy
and labor market, although the former seems not to be as robust as expected.
Overall, it can be concluded that the FED's response was faster and there was a
large diversity of programs and the type of entities that were supported by this central
bank (Gros et al., 2012). The FED changed reference interest rates much faster than the
ECB. In 2008, the FED lowered the federal funds rate by 7 times, stabilizing it in a very
close range of zero. The ECB, for its part, merely reduced the benchmark interest rate to
close to zero in May 2013.
The common purpose of these operations was the unprecedented expansion of
central bank balance sheets. The increase was particularly important in the FED in the
order of 230% and that the ECB's balance sheet expanded by 170% for the same period.
Noticed that the ECB balance sheet expansion was gradual, while the FED´s one was
much more abrupt. Although the FED has expanded its balance sheet proportionally more
eurozone's GDP, and the balance of the FED represented only 20% of US GDP (Gros et
al., 2012).
However there are two qualitative differences between the ECB and the FED that
are more important than the total size of the balance sheet. The FED, under quantitative
easing, bought assets almost exclusively risk-free, as the US debt securities, while the
ECB bought essentially risky assets, for which the market had little liquidity in the credit
enhanced support. In addition, the FED lent very little to banks, while the ECB lent large
sums to troubled banks without access to market financing (Gros et al., 2012). Finally,
Gros et al. (2012) and Queen (2013) point out that the FED has been more transparent
and effective than the ECB with regard to monetary policy changes announcements.
2. CONSTRAINTS TO FINANCE BUSINESS FOLLOWING THE FINANCIAL CRISIS
After the 2008 crisis, which showed the weaknesses of national and European financial
regulation, and the outbreak of the sovereign debt crisis in 2010, the climate of confidence
was shaken, hampering the smooth functioning of financial markets and jeopardizing the
financing of European economies. With the increasing ineffectiveness of interbank and
debt markets, the ECB was compelled to reduce Euribor interest rate to historic lows, to
intervene in the secondary markets for European sovereign debt and strengthen liquidity
facilities (APB, 2014). However, Antunes and Marinho (2012) suggest that access to
credit by non-financial companies became more difficult from the beginning of 2009,
following the financial crisis, also making sure that from this date the average amount of
credit granted began to fall.
The year 2010 was marked by increased turbulence in international financial
markets, following a request for financial assistance from Greece. As such, the lending
criteria to the non-financial private sector have become considerably more demanding
from the third quarter of 2010, regardless of company size (Banco de Portugal, 2010).
Bank of Portugal data show that private companies were the most affected with the
contraction observed in lending, especially small ones. The widening of spreads due to
the increased cost of financing the banking sector, and the application of risk assessment
criteria and more demanding lending conditions, difficult access to bank credit for national
small and medium enterprises (SME). At the same time there was an increase in bank
funding to public companies in detriment of the private sector (Banco de Portugal, 2013a).
Only in the second quarter of 2013, the bank gave the first signs of a "slight decrease in
tightening" of financing conditions for SME (Banco de Portugal, 2013b). This decrease
5 spreads applied to average loans, increased maturity and the amount of loans granted
(Banco de Portugal, 2014).
In short, after the 2008 crisis, SME's access to the credit market was one that
showed greater restrictions (Costa, 2014; Farinha & Prego, 2013; Ferrão, 2012).
However, these companies are crucial to national economic development. Furthermore,
Portuguese companies are using more debt in its capital structure, taking into account the
average financial autonomy ratio, which gives them huge vulnerability in periods of
stagnation or economic downturn (Ferrão, 2012).
3. RECENT FINANCIAL CRISIS INFLUENCE ON THE FINANCING OF PORTUGUESE FIRMS
3.1. Objective and research hypotheses
The objective of this research relates to the sovereign debt crisis in the Member States of
the European Union, triggered by any of the ECB control failure, and its consequent
impact on lending to the Portuguese business sector. In this sense, and taking into
account the theoretical and empirical foundations indicted in recent economic literature, it
was defined two research hypotheses. The first hypothesis is associated to the increase in
debt and the public deficit during the period of the financial and sovereign debt crisis as its
influence on the total value of loans from the financial sector to non-financial corporations
in Portugal. Arteta and Hale (2006) conclude that the failure of the public debt has a
strong impact on business. Realize that, even when there is renegotiation of sovereign
debt, funding for the private sector decreases before and after the new contract public
debt. Given this evidence was proposed the following research hypothesis to test:
H1 – The increase in debt and the public deficit causes a reduction in the value of loans.
The second hypothesis relates to the impact of increased government debt and the public
deficit on lending to SME. According to Iyer, Lopes, Peydró and Schoar (2013), during the
crisis period, between 2007 and 2009, the supply of bank credit to smaller companies
decreased. Also Ferrão (2012) concluded that in the period after the memorandum with
the TROIKA has seen a deleveraging process of banks and consequently the other
private operators, with particular focus on SME. Given this evidence relating to SME, we
proposed the following research hypothesis:
H2 – The increase in government debt and the public deficit imply a reduction in lending to
3.2. Description of the database and variables
In this research, we considered time series with quarterly data for the period between
December 2007 and December 2013, thus resulting in a total of 25 quarterly observations.
Data on "Treasury Bonds Yields - Secondary Market" were provided by the Agência de
Gestão da Tesouraria e da Dívida Pública - IGCP. In turn, the data on the Gross Domestic
Product (GDP) and Gross Fixed Capital Formation (GFCF) were obtained from the
Instituto Nacional de Estatística (INE). All other data were obtained through the Online
Statistics from Banco de Portugal. For a better understanding, presented in Table 1 is a
7 Table 1. Description of variables to be included in the econometric model to estimate.
Variable Explanation Unit Data
Source Dependen
t Variable Emp_Conc
Financial Institutions Loans to Non-financial Companies - Total
Million Euros
Banco de Portugal
D_Micro Debt volume of Micro Enterprises Million Euros
Banco de Portugal
D_PE Debt volume of Small Enterprises Million
Euros
Banco de Portugal
D_ME Debt volume of Medium Enterprises Million
Euros
Banco de Portugal
D_GRD Debt volume of Large Enterprises Million
Euros
Banco de Portugal
RE_Est General Government Debt Ratio % Banco de
Portugal
RE_Micro Debt ratio of Micro Enterprises % Banco de
Portugal
RE_PE Debt ratio of Small Enterprises % Banco de
Portugal
RE_ME Debt ratio of Medium Enterprises % Banco de
Portugal RE_GE
Debt ratio of Large Enterprises % Banco de
Portugal D_Pub
General Government Gross Debt Million
Euros
Banco de Portugal Def_Pub Public Deficit (Revenue (+)/Financing
needs of public administrations (-)) %
Banco de Portugal
FBCF Gross Fixed Capital Formation
(annual variation rate) % INE
i_SNF_ <1ME
Interest rate (new operations): Loans to non-financial corporations of European Union – to 1 Million euros
% Banco de
Portugal
i_SNF_ >1ME
Interest rate (new operations): Loans to non-financial corporations of European Union – above 1 Million euros
% Banco de
Portugal
Tx_OT Return rates of Treasury Bonds -
Secondary Market % IGCP
Independe nt
Variables
PIB
Gross Domestic Product at Constant Prices (rate of change in annual value)
% INE
[Source: Own elaboration]
The explained variable, total Financial Institutions Loans to Non-financial
Companies, described in Table 1, covers the loans over total resident financial institutions
institutions providing credit, as in the case of financial institutions to credit, financial
corporations for credit purchases, leasing and factoring companies, investment
companies, mutual guarantee and others (Banco de Portugal, 2014). Was considered the
debt of micro, small, medium and large enterprises es, since the size of the company may
be a significant variable, as there is an inverse relationship between the size of the
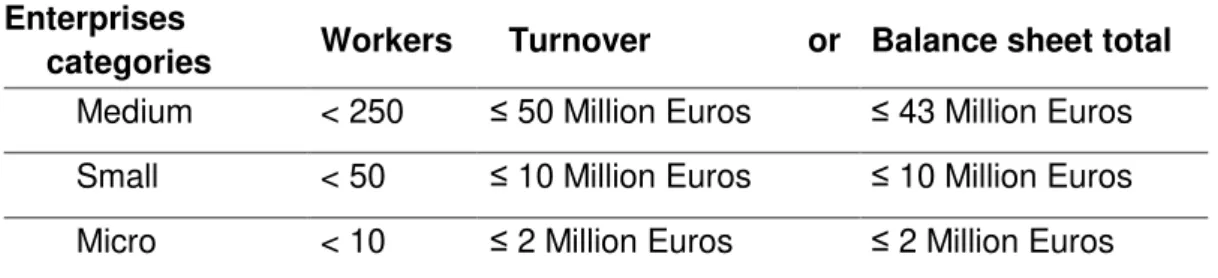
company and the interest rate on loans (Santos, 2013). The definition of small and
medium enterprises (SME) is settled by the Commission Recommendation 2003/361
(Jornal Oficial da União Europeia, 2003). The main factors that determine whether a
company is an SME are the staff headcounter, turnover or balance sheet total. The table 2
below illustrates these thresholds (only for individual companies).
Table 2. Classification of SME. Enterprises
categories Workers Turnover or Balance sheet total Medium < 250 ≤ 50 Million Euros ≤ 43 Million Euros
Small < 50 ≤ 10 Million Euros ≤ 10 Million Euros
Micro < 10 ≤ 2 Million Euros ≤ 2 Million Euros
[Source: European Commission (2014)]
Relatively to the variable General Government Gross Debt, it should be noted that
public authorities include the three sub-sectors: central, regional and local government
and social security funds. Public companies are also included in the government. The
Public Deficit, in turn, corresponds to the difference between the expenditure of general
government and its revenues, compared to the total GDP. A deficit with a positive sign
corresponds to a negative balance, that is, there are more expenses than revenues. GDP
in turn represents the final result of the production activity of resident producer units
(Banco de Portugal, 2014).
It was also made a descriptive analysis of the variables in order to understand their
behavior during the period in question. We began by presenting the performance of the
loans granted in December 2007 to December 2013 (see Figure 1). Through the analysis
of the graph there was a subsequent increase in the value of lending by institutions
December 2007 to June 2009, followed by a slight decrease and stagnating until June
2010. Thereafter, there was a successive and abrupt decrease in the value of the loans.
Note that the lowest values occurred at the end of year 2013. This decrease in the value
of loans from the financial sector to non-financial corporations, from 2010, coincides with
9 application for financial assistance from Greece in April, and Ireland's request in
November.
Figure 1. Value of loans, quarterly, in December 2007 to December 2013.
[Source: based on data from Banco de Portugal]
In turn, the graph of Figure 2 shows the evolution of the value of debt in December
2007 to December 2013 for micro, small, medium and large enterprises in Portugal.
Figure 2. Value of corporate debt, quarterly, December 2007 to December 2013.
[Source: based on data from Banco de Portugal]
Regarding the Figure 2, it is clear that small and medium enterprises are those who
have the lowest debt values over the time period under review, the debt curves of these
two types of companies are nearby and in both cases checks downward trend at the end
of the period. For the micro enterprises it appears that these have debt ranging
As for large enterprises is observed that at the beginning of the survey period was below
70,000 million and remained so until June 2010. Thereafter the debt of large companies
increased sequentially, reaching at the end of 2013 its maximum for this period,
amounting to 89,686 million euros. This evidence is consistent with what Costa (2014)
issued. He expressed concern, because the decrease in loans to focus on the segment of
small and medium enterprises, in contrast to large companies and public companies that
have increased their level of debt in this period, as they have been replacing credit
previously obtained in abroad by loans from resident institutions.
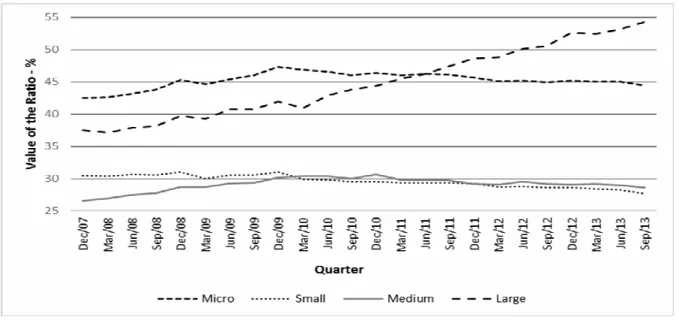
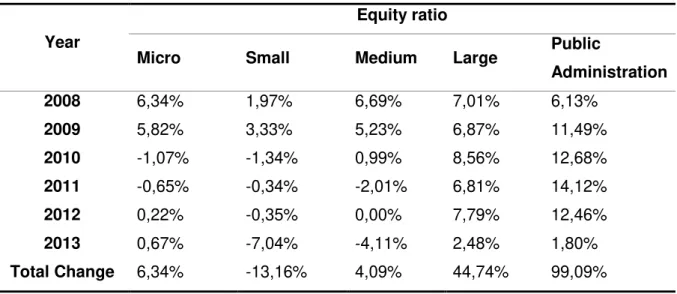
Figure 3 shows the evolution of the equity ratio of small, medium and large enterprises
in Portugal, for the period under analysis. It appears that the debt ratio of micro
enterprises stood at approximately 45%. Small and medium enterprises debt ratio ranged
around 30% and in late 2013 found considerably below 30%. In turn, the equity ratio of
large companies at the beginning of the survey period was below 40%, but abruptly
increased over time reaching the end of 2013 close to 55%.
Figure 3. Equity ratio of Portuguese companies between December 2007 and December
2013.
[Source: based on data from Banco de Portugal]
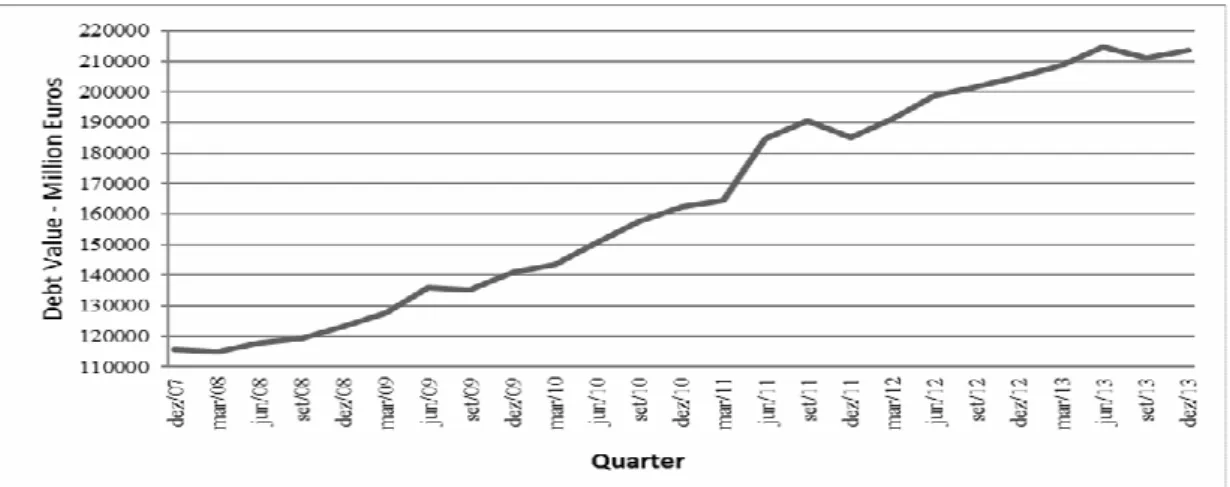
The graph of Figure 4 shows the evolution of the debt of the general government, in
a quarterly frequency, from December 2007 to December 2013. As can be seen in Figure
4, the value of debt of public administration increased over the period analyzed and
presented a growing trend. In December 2007, the value of public enterprises’ debt was
115,786 million euro and increased to 213,631 million euro in December 2013. In others
11 Figure 4. Representation of the quarterly value of government debt between December
2007 and December 2013.
[Source: based on data from Banco de Portugal]
Finally, in Figure 5, shows the evolution of the debt ratio of general government for
the same period, noting that the debt ratio of general government throughout the period
under study has steadily increased and doubled. In December 2007 was below 80% and
at the end of 2013 was above 150%.
Figure 5. Value of general government’s debt ratio, between December 2007 and
December 2013.
[Source: based on data from Banco de Portugal]
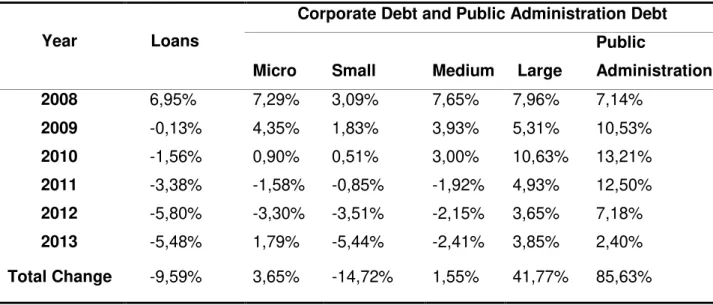
In table 3 we can observe the annual change for the amount of loan and the value of
corporate debt and public administration. According to this table, it appears that the value
of total loans only increased in 2008, registering a decrease in the remaining years.
of micro enterprises it appears that only in the years 2011 and 2012 there was a decrease
for registration in the remaining years increased. Between baseline and the end there was
an increase of 3.65%.
As for small enterprises is observed that in the years 2008 to 2010 there was an
increase in debt and in subsequent years there was a decrease. Between the beginning
and the end there was a decrease of 14.72% of the debt. For the medium-sized
enterprises is observed that these have small annual fluctuations, except for 2008 when
there was an increase of 7.65%. Between the beginning and the end there was an
increase of 1.55% of the debt. Regarding the debt of large companies and public
administration, it appears that every year there was an increase of the amount owed.
Between the beginning and the end of the study there was an increase of 41.77% and
85.63% of the debt of large companies and public administration, respectively.
Table 3. Annual and total change of loans and debt of companies and public
administration.
Corporate Debt and Public Administration Debt Year Loans
Micro Small Medium Large
Public
Administration
2008 6,95% 7,29% 3,09% 7,65% 7,96% 7,14%
2009 -0,13% 4,35% 1,83% 3,93% 5,31% 10,53%
2010 -1,56% 0,90% 0,51% 3,00% 10,63% 13,21%
2011 -3,38% -1,58% -0,85% -1,92% 4,93% 12,50%
2012 -5,80% -3,30% -3,51% -2,15% 3,65% 7,18%
2013 -5,48% 1,79% -5,44% -2,41% 3,85% 2,40%
Total Change -9,59% 3,65% -14,72% 1,55% 41,77% 85,63%
Table 4 shows the annual change on the debt ratio of companies and public
administration. Analyzing the table, highlights the fact that large companies and public
administration showed the largest increase (positive change) in the debt ratio. While the
micro and medium enterprises increased equity ratio of 6.34% and 4.09%, respectively,
between December 2007 and December 2013, large companies increased their equity
ratio in 44.74% and administrations public at 99.09%. In the case of general government
13 Table 4. Annual average rate of debt ratio for companies and public administration.
Equity ratio Year
Micro Small Medium Large Public
Administration
2008 6,34% 1,97% 6,69% 7,01% 6,13%
2009 5,82% 3,33% 5,23% 6,87% 11,49%
2010 -1,07% -1,34% 0,99% 8,56% 12,68%
2011 -0,65% -0,34% -2,01% 6,81% 14,12%
2012 0,22% -0,35% 0,00% 7,79% 12,46%
2013 0,67% -7,04% -4,11% 2,48% 1,80%
Total Change 6,34% -13,16% 4,09% 44,74% 99,09%
Table 5 shows the characterization of the variables under study through statistical
measures: average, minimum, maximum, standard deviation and coefficient of variation.
As shown in Table 5, the average value of loans in the period considered was 114,434
million, and the variation around this relatively small amount, about 5.8%. Analyzing the
debt according to their companies’ size, it appears that the micro enterprises and large
companies are those with the highest average. The variation around the mean value was
higher (11.4%) for large companies. The average debt of public administration was about
164.616 million euros (S.D. 35624.70 millions of Euros) over the period under analysis
and the variation around this mean value was 21.6%. The average debt ratio for micro
enterprises was 45.24% (standard deviation 1.22%), 29.48% (1.13%) for small
enterprises, 29.07% (1.06%) for medium enterprises, 45.15% (5.69%) for large
enterprises and 112.24% (27.61%) for public administration. The greater dispersion
values occurred in public administration and in large companies. As for the public deficit
has been that this has a mean value of -6.56%, the deviations from the mean value is
57.7%, i.e., the government deficit has a wide dispersion over the period under analysis.
Regarding the formation of fixed capital this presents a mean value of -6.59% and high
dispersion for the coefficient of variation is 102.4%. Between December 2007 and
December 2013 the average value of loan rates up to 1 million euros was 6.56% and
above € 1 million was 4.91%. The higher dispersion of rates were observed for more
substantial loans. As for the profitability of treasury bonds this had a mean value of 6.66%
(2.67%) and the variation coefficient was 40.1%. The GDP showed an averagechange of
Table 5. Characterization of the variables of the econometric model.
Obs.: Emp_Conc – Financial Institutions loans to non-financial corporations - Total; D_Micro – Debt volume of Micro Enterprises ; D_PE – Debt volume of Small Bussiness; D_ME – Debt volume of Medium Enterprises ; D_GRD – Debt volume of Large
Enterprises ; RE_Est –General Government Debt Ratio; RE_Micro - Debt ratio of Micro
Enterprises ; RE_PE – Debt ratio of Small Enterprises ; RE_ME – Debt ratio of Medium
Enterprises ; RE_GE – Debt ratio of Large Enterprises ; D_Pub – General Government
Gross Debt; Def_Pub – Public Deficit; FBCF – Gross Fixed Capital Formation; I_SNF<1ME – Interest rate: loans to non-financial corporations of European Union – to 1
million euros; I_SNF_>1ME – Interest rate: loans to non-financial corporations of
European Union – above 1 million euros; Tx_OT – Treasury Bonds Yields – Secondary
Market; PIB – Gross Domestic Product.
3.3. Univariate analysis and correlation matrix between the variables
In Table 6 we present the Pearson correlation coefficients between the variables under
Variable Unit Average Minimum Maximum Standard
deviation
Coefficien t variation
Emp_Conc Million Euros 114434,0
0
100663,0
0 121824,00 6615,61 0,058
D_Micro Million Euros 76720,40 71916,70 80157,40 2597,48 0,034
D_PE Million Euros 50063,60 44165,00 53389,10 2400,40 0,048
D_PM Million Euros 49333,90 45119,60 53010,00 2082,52 0,042
D_GRD Million Euros 76296,10 63263,30 89686,00 8666,69 0,114
D_Pub Million Euros 164616,0
0
115086,0
0 214823,00 35624,70 0,216
RE_Est % 112,24 76,70 155,20 27,61 0,246
RE_Micro % 45,24 42,50 47,30 1,22 0,027
RE_PE % 29,48 26,40 31,00 1,13 0,038
RE_ME % 29,07 26,60 30,70 1,06 0,036
RE_GE % 45,15 37,10 54,30 5,69 0,126
Def_Pub % -6,56 -13,10 2,20 3,79 0,577
FBCF % -6,59 -17,30 7,40 6,75 1,024
I_SNF<1ME % 6,56 5,08 7,84 0,87 0,133
I_SNF_>1ME % 4,91 3,33 6,32 0,91 0,185
Tx_OT % 6,66 3,82 12,93 2,67 0,401
15 sample correlation coefficient of Pearson, represented by r, is a measure of the direction and degree to which two quantitative variables are associated linearly. The correlation
coefficient r varies between -1 and 1. The value 0 (zero) means that there is no linear relationship, a value of 1 indicates a perfect linear relationship and the value -1 indicates a
perfect but also an inverse linear relationship, or when one of the variables increases the
other decreases. The closer the coefficient is to 1 or -1, the stronger the linear correlation
between the two variables (Murteira, Ribeiro, Silva and Pimenta, 2001).
After analysis of Table 6, it appears that the value of loans is strongly correlated
and in the forward direction with micro-enterprises debt, small enterprises and the equity
ratio of small enterprises. In turn, the micro enterprises debt is strongly and directly
correlated with the medium enterprises debt, and micro and medium enterprises equity
ratio. Second, small enterprises debt is strongly and negatively correlated with large
enterprises debt and general government gross debt. Medium-sized enterprises debt was
strongly correlated and in the forward direction with the leverage ratio of micro
enterprises. The large enterprises debt was strongly correlated to equity ratio of small
enterprises (reverse) and public debt (forward direction). The government debt ratio was
strongly correlated with the small business equity ratio (reverse) and the equity ratio of
large companies (forward direction). Furthermore, the equity ratio of micro enterprises
was strongly correlated and in the forward direction with the leverage ratio of
medium-sized enterprises. The equity ratio of small enterprises is strongly correlated and the other
way with the public debt. The equity ratio of large companies is strongly correlated and in
the forward direction with the value of debt of public administration. As expected, the debt
of each type of enterprises and public administration is strongly correlated and in the
forward direction with the respective leverage ratio. Also as expected loan interest rates of
up to EUR 1 million and more than 1 million are strongly correlated and in the forward
direction. Finally, there is that GDP is strongly correlated with the gross fixed capital
Emp_C onc
D_Mi cro
D_P E
D_P M
D_G RD
RE_ Est
RE_Mi cro
RE_ PE
RE_ ME
RE_ GE
D_P ub
Def_P ub
FBC F
I_SNF<1 ME
I_SNF_> 1ME
Tx_
OT PIB
Emp_Conc 1,00 0,76 0,82 0,71 -0,60 -0,68 0,48 0,74 0,50 -0,66 -0,61 -0,45
-0,05 -0,32 -0,42
-0,11 0,02
D_Micro 1,00 0,38 0,96 -0,01 -0,14 0,86 0,22 0,83 -0,11 -0,05 -0,42
-0,26 -0,45 -0,46 0,29 -0,09
D_PE 1,00 0,30 -0,86 -0,91 -0,01 0,96 0,00 -0,90 -0,87 -0,19 0,22 0,09 -0,04
-0,24 0,06
D_PM 1,00 0,09 -0,03 0,86 0,16 0,92 -0,01 0,06 -0,46
-0,38 -0,46 -0,47 0,34 -0,19
D_GRD 1,00 0,98 0,29 -0,90 0,31 0,99 0,99 0,16
-0,54 -0,01 0,12 0,62 -0,40
RE_Est 1,00 0,21 -0,91 0,23 0,99 0,99 0,17
-0,51 -0,01 0,12 0,54 -0,36
RE_Micro 1,00 -0,07 0,94 0,24 0,27 -0,50
-0,39 -0,68 -0,64 0,21 -0,04
RE_PE 1,00 -0,06 -0,91 -0,90 -0,23 0,23 0,02 -0,11
-0,42 0,12
RE_ME 1,00 0,25 0,30 -0,54
-0,49 -0,64 -0,61 0,27 -0,16
RE_GE 1,00 0,99 0,17
17 Table 6. Correlation matrix between variables.
Obs.: Emp_Conc – Financial Institutions loans to non-financial corporations - Total; D_Micro – Debt volume of Micro Enterprise; D_PE – Debt volume of Small Bussiness; D_ME – Debt volume of Medium Enterprise; D_GRD – Debt volume of Large Enterprise; RE_Est –General
Government Debt Ratio; RE_Micro - Debt ratio of Micro Enterprise; RE_PE – Debt ratio of Small Business; RE_ME – Debt ratio of Medium
Business; RE_GE – Debt ratio of Large Business; D_Pub – General Government Gross Debt; Def_Pub – Public Deficit; FBCF – Gross Fixed
Capital Formation; I_SNF<1ME – Interest rate: loans to non-financial corporations of European Union – to 1 million euros; I_SNF_>1ME – Interest
rate: loans to non-financial corporations of European Union – above 1 million euros; Tx_OT – Treasury Bonds Yields – Secondary Market; PIB –
Gross Domestic Product.
0,54
Def_Pub 1,00 0,14 0,59 0,64 0,31 -0,16
FBCF 1,00 -0,08 -0,09
-0,60 0,83
I_SNF<1ME 1,00 0,98 0,35 -0,50
I_SNF_>1M
E 1,00 0,40 -0,48
Tx_OT 1,00 -0,73
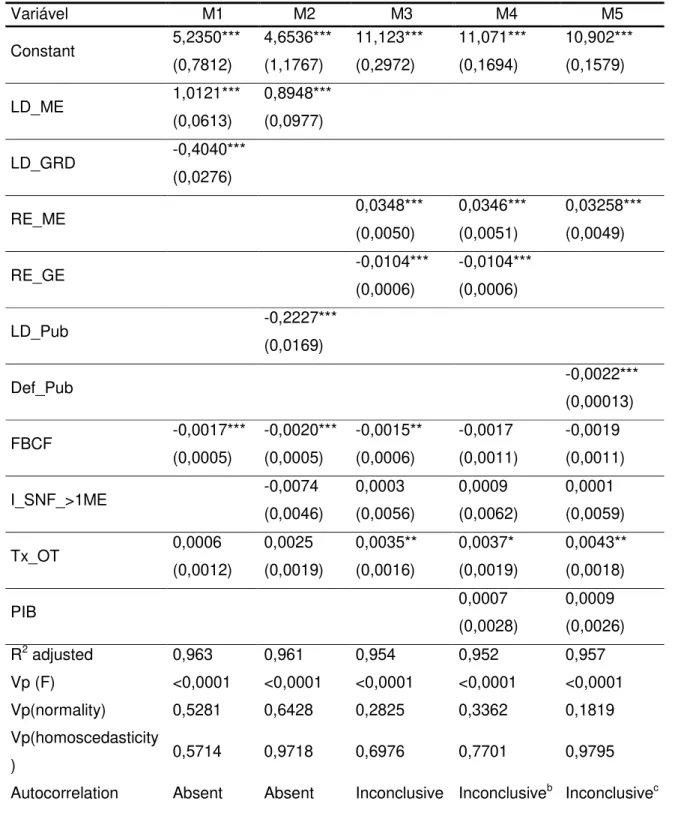
18 3.4. Multiple linear regression model
It was intended to estimate the influence of the independent variables in the volume of loans
to non-financial companies in the period between December 2007 and December 2013. It
were selected 13 variables that can positively or negatively influence the granting of loans to
non-financial institutions. The expression for the generalized estimate model is given below:
, _ 1 _ _ _ ln_ _ _ _ _ ln_ ln_ ln_ _ ln_ 13 12 11 10 9 8 7 6 5 4 3 2 1 0 u PIB OT TX ME SNF I FBCF Pub Def Pub D GE RE ME RE PE RE Micro RE GRD PM PE conc Emp + + + > + + + + + + + + + + + + = β β β β β β β β β β β β β β (1)
Table 7 presents the estimated models, the respective determination coefficients and
the significance test for all regressions. It also presents the results of the tests: normality,
homoscedasticity, absence of autocorrelation of errors and multicollinearity of independente
variables. For each variable is displayed the respective coefficient and its standard deviation
that is between brackets. The symbols *, ** ,*** means that the independent variable is
statistically significant at 10%, 5% and 1% significance level, respectively, and henceforth it is
a valid estimated model. As the magnitude of the variables involved in the models is very
different, there is on the one hand amounts in millions of euros and on the other ratios as a
percentage, was therefore necessary log transformation the following variables (variables that were in EUR million): D_ME (Debt Volume of Medium Enterprise), D_GRD (Debt Volume of
Large Enterprise) e D_Pub (General Government Gross Debt).
Based on Table 7 it was found that all the estimated regression models have statistical
significance at 5% significance level. For all models, the determination coefficient is above
95% which means that on average, the change in the value of loans is explained by around
95% by the independent variables included in the models. It is also possible to conclude that
in all models estimated the conditions are met: normality, homoscedasticity, absence of
autocorrelation of errors and lack of multicollinearity.
Note that the variables not included in Table 7, showed no relevance to the estimated
models, their inclusion had sometimes result in the violation of any of the model validation
conditions, including multicollinearity. Therefore, given the results it is concluded that the debt
to equity ratio of medium-sized enterprises, significantly influence and direct sense the value
of the loans. In turn, the debt of large companies and public administration and the public
deficit significantly influence and the other way the value of the loans. With regard to gross
capital formation, this has a significant influence and the other way in the value of loans.
19 the value of loans. We conclude also that lending interest rates of more than EUR 1 million
and GDP have no significant influence on the variation in the value of the loans.
Table 7. Estimation of models by the OLS method.
Variável M1 M2 M3 M4 M5
Constant 5,2350*** (0,7812) 4,6536*** (1,1767) 11,123*** (0,2972) 11,071*** (0,1694) 10,902*** (0,1579) LD_ME 1,0121*** (0,0613) 0,8948*** (0,0977)
LD_GRD -0,4040***
(0,0276)
RE_ME 0,0348***
(0,0050)
0,0346***
(0,0051)
0,03258***
(0,0049)
RE_GE -0,0104***
(0,0006)
-0,0104***
(0,0006)
LD_Pub -0,2227***
(0,0169)
Def_Pub -0,0022***
(0,00013)
FBCF -0,0017***
(0,0005) -0,0020*** (0,0005) -0,0015** (0,0006) -0,0017 (0,0011) -0,0019 (0,0011)
I_SNF_>1ME -0,0074
(0,0046) 0,0003 (0,0056) 0,0009 (0,0062) 0,0001 (0,0059)
Tx_OT 0,0006
(0,0012) 0,0025 (0,0019) 0,0035** (0,0016) 0,0037* (0,0019) 0,0043** (0,0018)
PIB 0,0007
(0,0028)
0,0009
(0,0026)
R2 adjusted 0,963 0,961 0,954 0,952 0,957
Vp (F) <0,0001 <0,0001 <0,0001 <0,0001 <0,0001
Vp(normality) 0,5281 0,6428 0,2825 0,3362 0,1819
Vp(homoscedasticity
) 0,5714 0,9718 0,6976 0,7701 0,9795
20
a - Durbin-Watson test inconclusive, we resorted to the LMF test and obtained Vp 0,480
b - Durbin-Watson test inconclusive, we resorted to the LMF test and obtained Vp 0,535
c - Durbin-Watson test inconclusive, we resorted to the LMF test and obtained Vp 0,906
Obs.: Emp_Conc – Financial Institutions loans to non-financial corporations - Total;D_Micro – Debt volume of Micro Enterprise; D_PE – Debt volume of Small Bussiness; D_ME – Debt volume of Medium Enterprise; D_GRD – Debt volume of Large Enterprise; RE_Est –General
Government Debt Ratio; RE_Micro - Debt ratio of Micro Enterprise; RE_PE – Debt ratio of
Small Enterprise; RE_ME – Debt ratio of Medium Enterprise; RE_GE – Debt ratio of Large
Enterprise; D_Pub – General Government Gross Debt; Def_Pub – Public Deficit; FBCF –
Gross Fixed Capital Formation; I_SNF<1ME – Interest rate: loans to non-financial
corporations of European Union – to 1 million euros; I_SNF_>1ME – Interest rate: loans to
non-financial corporations of European Union – above 1 million euros; Tx_OT – Treasury
Bonds Yields – Secondary Market; PIB – Gross Domestic Product; Vp – p-value.
CONCLUSION AND SUGGESTIONS FOR FUTURE RESEARCH
This paper aimed to analyse the impact of the regulatory role of the ECB and the sovereign
debt crisis of the Member States in providing finance for Portuguese companies, after the
financial crisis of 2008. It was found that both the ECB and the FED doubled the value of its
assets between 2006 and 2008, given the worsening of the financial crisis (Andrade, 2009).
However, the answer given by FED to the crisis has been more rapid, effective, transparent
and inclusive, for the ECB's reply (Gros et al, 2012 and Rainha, 2013). However, when
comparing the final goal common to both central banks - inflation, the ECB may had more
success in controlling inflation and inflation expectations (Araújo, 2013).
According to the econometric analysis carried out it appears that the debt of large
companies, government debt and the public deficit influence significantly and in the opposite
direction the volume of loans to non-financial companies, thus validating the hypothesis H1.
In fact, as the debt of government and, consequently, the public deficit increase, will
deteriorated the country's rating and all economic agents will have more difficulties in access
to credit and higher interest rates (Ferrão, 2012). As the variables D_Micro (Debt volume of
Micro Enterprise) and D_PE (Debt ratio of Small Enterprise) were taken from the five
a
21 estimated models, since these variables originated violation of the assumption of the absence
of multicollinearity among the independent variables, we could not test the hypothesis H2 and
therefore conclude whether the increase in government debt and the public deficit would lead
to a reduction of lending to Portuguese SME. However, using the Pearson regression
coefficients can be said that the small enterprises debt is strongly correlated in reverse with
the debt of government and large business. This means that when you register an increase in
the debt of large business, government and the public deficit, lending to small and medium
decreases. In fact, at company level, and as found APB (2012), Farinha e Prego (2013),
Ferrão (2012), Iyer et al. (2010) and Paulo (2012), credit granted to SME was the one who
showed greater reduction after the financial crisis. Finally, we conclude by applying the Chow
test for a 5% significance level, the downturn in 2010 (break point) is statistically significant in
the models M1, M3 and M4. This result allows, in some way, say that the European sovereign
debt crisis had an influence on the behavior of loans, since the year 2010 was marked by the
Financial Economic Assistance request from Greece and Ireland.
Despite the validity of the conclusions of this research, it is noteworthy that a limitation
relates to the fact that there are only data provided by the Banco de Portugal for the granting
of credit to non-financial corporations since December 2007 and not since the creation of the
ECB. The use of a larger series would compare the evolution of loans before and after the
financial crisis. As for future research suggestion, it is proposed that this analysis be
extended to other countries that also have used the assistance programs of the IMF and the
ECB. Another issue that needs special attention and can be studied as referred Antunes and
Marino (2012), it is whether the regulatory intervention of the ECB may ease the funding
problems for the business sector.
REFERENCES
Andrade, J. (2009). A Política Monetária do BCE. Uma estratégia original para a estabilidade nominal. Faculdade de Economia da Universidade de Coimbra; Estudos do GEMF, 10.
Araújo, T. (2013). A reação da política monetária à recente crise financeira: o caso BCE e FED. Disponível em file:///C:/Users/Sandra/Downloads/Dissertacao_-_Tiago_Araujo%20 (5).pdf
Antunes, A.,& Marinho R. (2012). Acesso ao Crédito por Empresas Não Financeiras.
Disponível em
22 Arteta, C. & Hale, G. (2006). Sovereign Debt Crises and Credit to the Private Setor. Board of Governors of the Federal Reserve System, International Finance Discussion Papers, 878. Disponível em http://www.federalreserve.gov/ pubs/ifdp/2006/878/ ifdp878.pdf.
Associação Portuguesa de Bancos [APB] (2012). Intervenção do Governador Carlos da Silva Costa na Conferência da APB “Systemic Risk–too-Important-to-Ignore” – Sessão inaugural. Disponível em http://www.apb.pt/content/files/Carlos_Costa_-_Governador_ do_Banco_de_Portugal_2.pdf.
Associação Portuguesa de Bancos [APB] (2014). Modelo de Supervisão Português. Disponível em http://www.apb.pt/sistema_financeiro/modelo_de_supervisao_portugues.
Bagus, P. (2012). A Tragédia do Euro. Atual Editora.
Banco de Portugal (2010). Inquérito aos Bancos sobre o Mercado de Crédito. Disponível em http://www.bportugal.pt/pt-PT/EstudosEconomicos/ Publicacoes/ IBMC/ Publicacoes/ Results_out10_p.pdf.
Banco de Portugal (2013a). Relatório Estabilidade Financeira - novembro 2013. Disponível em http://www.bportugal.pt/pt-PT/EstudosEconomicos/ Publicacoes/ Paginas/ RelatoriodeEstabilidadeFinanceira.aspx.
Banco de Portugal (2013b). Inquérito aos Bancos sobre o Mercado de Crédito. Disponível em http://www.bportugal.pt/pt-PT/EstudosEconomicos/Publicacoes/IBMC/ Publicacoes/Results_jul13_p.pdf.
Banco de Portugal (2014). Inquérito aos Bancos sobre o Mercado de Crédito. Disponível em http://www.bportugal.pt/pt-PT/EstudosEconomicos/Publicacoes/IBMC/Publicacoes/ Results_Jul04_p.pdf.
BCE (2010). The ECB’s Response to the Financial Crisis. Monthly Bulletin October 2010 Disponível em https://www.ecb.europa.eu/pub/pdf/other/art1_mb201010en_pp59-74en.pdf.
Costa, C. (2014). A criação da União Bancária Europeia e o sistema bancário português.
Disponível em http://www.bportugal.pt/pt-PT/OBancoeoEurosistema/
Lists/FolderDeListaComLinks/Attachments/246/Intervpub20140428.pdf.
Farhi, E. & Tirole, J. (2014). Deadly Embrace: Sovereign and Financial Balance Sheets Doom Loops. Disponível em http://idei.fr/doc/by/tirole/deadly_embrace_041514.pdf.
Farinha, L. & Prego, P. (2013). Investimento e situação financeira das empresas: evidência recente. Disponível em http://www.bportugal.pt/pt-PT/BdP%20Publicaes%20de% 20Investigao/AR201302_p.pdf.
Ferrão, J. (2012). O Endividamento das Empresas e das Famílias Portuguesas. Disponível em http://repositorio.ipl.pt/handle/10400.21/2306.
23 Iyer, R., Lopes, S., Peydró, J. &Schoar A. (2013). Interbank Liquidity Crunch and the firm credit crunch: evidence from the 2007-2009 crisis. Disponível em
http://papers.ssrn.com/sol3/papers.cfm?abstract_id=2263025.
Jornal Oficial da União Europeia (2003). Recomendação da Comissão de 6 de Maio de 2003
relativa à definição de micro, pequenas e médias empresas (2003/361/CE). Disponível
em http://www.iapmei.pt/resources/download/r_2003_361_ce.pdf.
Lourtier, P. (2011). Portugal no contexto da crise do euro. Relações Internacionais, dezembro 2011.
Murteira, B., Ribeiro, C., Silva, A & Pimenta, C. (2001). Introdução à Estatística. Lisboa: McGraw-Hill.
Paulo, S. (2012). A Europa e a Crise Financeira Mundial – Balanço da resposta política da
EU. Fundação Robert Schuman. Disponível em
http://ec.europa.eu/portugal/pdf/informa/publicacoes/resposta_crise_ue_pt.pdf.
Praet, P. (2014). Reformas e crescimento da área do euro. Intervenção no painel “Fixing finance”, Cimeira de Lisboa da revista The Economist. Disponível em
http://www.bportugal.pt/pt-PT/OBancoeoEurosistema/IntervencoesPublicas/Lists/FolderDeListaComLinks/Attachm ents/246/Intervpub20140428.pdf.
Rainha, D. (2013). Política Monetária sob “Zero Lower Bound”: O Caso da Política de Comunicação do BCE. Master dissertation of Faculdade de Economia da Universidade do Porto.