ORIGINAL ARTICLE
CITE AS: White, B.L.A. 2018. Spatiotemporal variation in fire occurrence in the state of Amazonas, Brazil, between 2003 and 2016. Acta Amazonica 48: 358-367
Spatiotemporal variation in fire occurrence in the
state of Amazonas, Brazil, between 2003 and 2016
Benjamin Leonardo Alves WHITE
Universidade Federal de Sergipe, Departamento de Biociências, Av.Vereador Olímpio Grande s/n, Itabaiana, Sergipe, Brazil Corresponding author: [email protected]
ABSTRACT
Wildland fires can be responsible for negative impacts on the environment, causing damage to the fauna and flora and increasing the release of greenhouse gases. In the state of Amazonas, wildland fires represent a risk for biodiversity conservation, since more than 95% of the state is covered by Amazon rainforest, one of the largest and most biodiverse tropical forests of the world. This study aimed to analyze the spatiotemporal variation of fire occurrence from 2003 to 2016 in the state of Amazonas, based on data from the AQUA satellite processed by the Brazilian National Institute for Space Research, using the “Collection 5” detection algorithm. The correlation between fire incidence versus anthropogenic and climatic variables was also tested. A significant uptrend was observed in the number of hot spots recorded over the years. About 83% of the wildland fires occurred during the months of August, September and October. The variables that correlated significantly with the number of hot spots for each municipality were deforested area, pasture area, agricultural area, municipality area and mean annual rainfall. The municipality with the highest number of hot spots detected was Lábrea, while Careiro da Várzea presented the highest incidence per km2. The southern and eastern regions of the state were the areas most affected by fire during the analyzed
period. The results from this study emphasize the need for implementation of public policies aimed to reduce deforestation and wildland fires in the state, thus ensuring the conservation of the Amazon rainforest and its biodiversity.
KEYWORDS: hot spots; fire prevention; wildfire; remote sensing
Variação espaço-temporal da ocorrência de queimadas e incêndios
florestais no estado do Amazonas, Brasil, entre 2003 e 2016
RESUMO
As queimadas controladas e incêndios florestais podem ser responsáveis por impactos negativos ao meio ambiente, ocasionando danos à fauna e flora e contribuindo para a liberação de gases na atmosfera responsáveis pelo efeito estufa. O fogo no Amazonas representa um grande risco para a preservação da biodiversidade, já que mais de 95% da área do estado é recoberta por floresta amazônica, uma das maiores florestas tropicais do mundo. Este trabalho teve por objetivo analisar a variação espaço-temporal dos focos de calor registrados de 2003 a 2016 no estado do Amazonas, com base em dados obtidos através do satélite AQUA e processados pelo INPE, utilizando o algoritmo de detecção “Collection 5”. Os dados de focos de calor foram correlacionados com variáveis antropogênicas e climáticas. Foi observada uma tendência significativa de alta nos registros de focos de calor ao longo dos anos. Cerca de 83% das detecções ocorreram nos meses de Agosto, Setembro e Outubro. As variáveis área desmatada, área de pastagem, área agrícola, área do município e precipitação média anual apresentaram correlação significativa com o número de focos de calor para cada município. O município com maior registro de focos de calor foi Lábrea, enquanto Careiro da Várzea apresentou a maior incidência por área. Os resultados obtidos ressaltam a necessidade de implementação de políticas públicas que visem a redução do desmatamento e dos incêndios florestais no estado, garantindo a preservação da floresta amazônica e sua biodiversidade.
INTRODUCTION
Wildland fires are any non-structure fire that occurs in vegetation or natural fuels and include prescribed (controlled) burns and wildfires (uncontrolled) (NWCG 2017). They can be a major threat to the preservation of biodiversity, causing impact on the fauna and flora, and contributing, indirectly, with environmental degradation (Soares and Batista 2007). Moreover, the smoke often causes respiratory complications and represents, in some locations, a public health issue (Arbex
et al. 2004; Shlisky et al. 2009).
In the state of Amazonas, the use of fire is cultural and difficult to replace (Cabral et al. 2013), being generally used in an irregular manner, without authorization from the responsible environmental agency, the Amazonas Environmental Protection Institute (IPAAM). The use of fire, with or without the use of controlled burning techniques, is prohibited in August, September and October in all the state (IPAAM 2010). Between November and June, prescribed burns can be carried out exclusively when authorized by the agency.
The detection of controlled and uncontrolled wildland fire via satellite began in the 1980s (Wang et al. 2012). Images generated by the thermal and infrared sensors installed in the satellites are sent to a control center and processed through a detection algorithm (Batista 2004; Wang et al. 2012). The use of an efficient algorithm is essential to distinguish fire in vegetation from other heat sources generating a low number of false positives (INPE 2017). It is important to mention that satellite imagery cannot differentiate unmanaged and uncontrolled wildfires from controlled burns (Goldammer and Mutch 2001).
In Brazil, the Weather and Climate Studies Research Center (CPTEC) of the National Institute for Space Research (INPE) generates and provides information on the occurrence of active fires (hot spots) based on satellite data. Among all images received by INPE from various satellites in operation (NOAA-15, NOAA-18, NOAA-19, METOP-B, NASA, TERRA, AQUA, NPP-Suomi, GOES-13 and MSG-3), those generated by the AQUA satellite and processed with the “Collection 5” algorithm have been used as reference since 2002 to compose comparable interannual time series that enable long-term trend analyses in regions of interest (White and White 2016, INPE 2017; White 2017).
Wildfires in the state of Amazonas represent a huge risk for biodiversity conservation, since more than 95% of the state is covered by the Amazon rainforest, one of the largest tropical forest areas of the world (Primack and Rodrigues 2001; GEA 2017). The exact scope of the problem can only be assessed by satellite data, since local fire statistics in many cases are incomplete or misleading. Therefore, this study aimed to analyze the spatiotemporal variation of fire occurrence in the state of Amazonas using data from the AQUA satellite processed by the “Collection 5” algorithm, for the period from 2003 to
2016. The information obtained can be used by conservation agencies for the improvement of fire prevention and suppression activities, and for the development of public policies focused on wildfire prevention and nature conservation.
MATERIAL AND METHODS
Study area
Amazonas is the largest Brazilian state, occupying a total area of 1,559,149.074 km2, larger than the size of France, Spain,
Sweden and Greece combined (IBGE 2017a). It is located in northern Brazil and is the state with the most preserved and the least deforested portion of Amazon rainforest (SEMA 2017). The climate is equatorial and classified, in most of the state, as “Equatorial rainforest, fully humid” (Af) according to the updated classification of Köppen and Geiger (Kottek
et al. 2006).
Datasets
The records of hot spots in the state of Amazonas for the period 01/01/2003 to 12/31/2016 were obtained from the INPE Satellite Monitoring Burning Program website, based on data from the AQUA satellite processed through the “Collection 5” algorithm (INPE 2017). The values were quantified for the entire state and grouped by month of occurrence and the municipality in which they were detected.
The following variables that may have a significant influence on the number of hot spots were quantified for each municipality: mean annual temperature; mean annual rainfall; population density; deforested area; agricultural area and pasture area. These variables were chosen due to availability of historical data and because they have been shown to influence with wildland fire occurrence probability (e.g. Oliveira et al. 2004; Gonçalves et al. 2011; Liu et al. 2012; White et al. 2016a; White et al. 2016b; Suryabhagavan et al. 2016; Ajin
et al. 2016; White and White 2016).
Data on agricultural area was obtained from IBGE (2017b). Data on deforested area was obtained from INPE’s “PRODES” project, which performs satellite monitoring of clearcut deforestation in the Amazon and calculates, yearly deforested area in the region (CGOBT 2017). Data on demographic density for each municipality are based on IBGE (2017c). All the variables were quantified annually from 2003 to 2016 for each municipality and had their mean value determined.
measured between 1982 and 2012. It was assumed that the mean values of temperature and rainfall for each municipality during the period 2003 - 2016 were not statistically different from the average values for 1982 - 2012.
Wildland fire incidence per municipality
The state municipalities were grouped according to the classification proposed by White and White (2016) into five frequency classes based on the number of hot spots per area detected by the AQUA satellite during a period of one year (Table 1).
In order to evaluate wildland fire occurrence over representative long-term time periods of climate variation and land-use change, and to avoid interference of small annual fluctuations, the classification of the frequency of wildfire incidence in each municipality was analyzed in two time periods: 2003-2009 and 2010-2016.
Statistical analysis
Analysis of Variance (ANOVA) and the post-hoc Tukey HDS test were used to test the existence of a significant differences among the number of hot spots recorded in different months of the year. A linear regression was calculated to evaluate the growth trend in number of hot spots throughout the time series. A correlation matrix was constructed with the Pearson (r) correlation coefficients for the several variables analyzed in the study.
RESULTS
A total of 96,884 hot spots were detected by the AQUA satellite in the state of Amazonas between 2003 and 2016, resulting in an average of approximately 6,920 per year. The lowest record was in 2008 (2,717), and the highest in 2015 (15,170). The annual records indicate a significant uptrend in the number of hot spots throughout the time series (r2 =
0.50; p < 0.01) (Figure 1).
The month with the highest number of hot spots recorded was September, followed by August, October, November, July, December, January, February, March, June, May and April. About 83% of the hot spots were detected during the months of August, September and October. Less than 1% of the fires detected occurred during the months of April, May and June. The number of hot spots varied significantly among the months of the year (ANOVA, F = 23.36, p <0.01). The Tukey HDS test grouped the months into three groups with significantly different levels of hot spot occurrence (Figure 2).
Hot spots were recorded in all municipalities in the state of Amazonas (Table 2). Lábrea was the municipality with the highest incidence (13,593) and Japurá with the lowest (106). The municipalities with the highest number of hot spots detected during 2003-2016 presented the largest deforested areas during the same period. Four other independent variables were significantly correlated with the number of hot spots: pasture area, agricultural area, municipality area and mean annual rainfall. Mean annual temperature and demographic density were not significantly correlated with number of hot spots (Table 3).
Apart from Lábrea, eight other municipalities presented a very high incidence of hot spots (Table 4). Proportionally to its area, Careiro da Várzea registered the highest frequency of incidence of hot spots in the state of Amazonas.
In the first seven years of the time series (2003-2009) the predominant wildfire incidence category in the state of
Table 1. Frequency of incidence of hot spots detected by the AQUA satellite over one year. The classification follows White and White (2016).
Frequency class Number of hot spots detected per year Very Low None or one hot spot for an area of 601 km2 or more.
Low One hot spot for an area between 301-600 km2.
Average One hot spot for an area between 151-300 km2.
High One hot spot for an area between 76-150 km2.
Very High One hot spot for an area of 75 km2 or less.
Figure 2. Monthly number of hot spots registered by the AQUA satellite between 2003 and 2016 in the state of Amazonas, Brazil. The line within the box indicates the mean, the box indicates the 25%-75% quartiles, and the bars the 10% and 90% quartiles. Letters above the bars indicate significant differences among means.
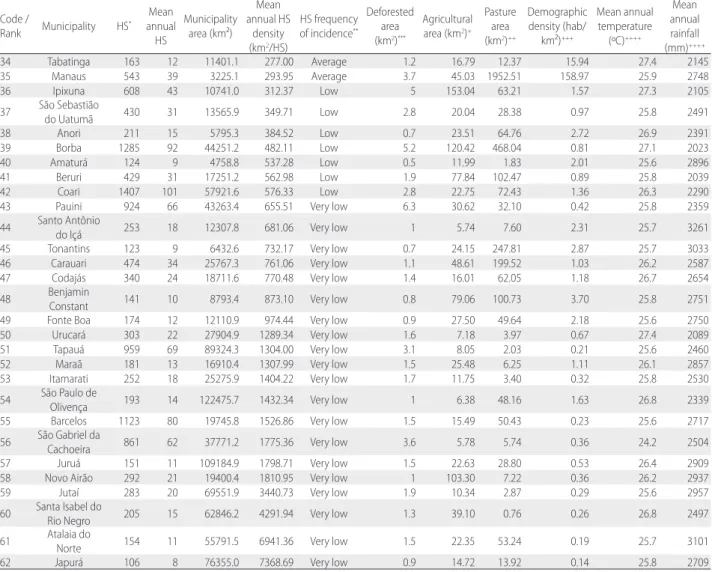
Table 2. List of municipalities of Amazonas state (Brazil) and their number of detected hot spots (HS); mean annual hot spots; area; area divided by mean annual hot spot (HS density); hot spot frequency of incidence; deforested area; agricultural area; population size; demographic density; mean annual temperature and mean annual rainfall. Municipalities are grouped in descending order of mean annual hot spot density. The first column indicates the identification code of each municipality in Figure 3.
Code /
Rank Municipality HS* Mean annual
HS
Municipality area (km²)
Mean annual HS
density (km2/HS)
HS frequency of incidence**
Deforested area (km2)***
Agricultural area (km2)+
Pasture area (km2)++
Demographic density (hab/
km²)+++
Mean annual temperature
(ºC)++++
Mean annual rainfall (mm)++++
1 Careiro da
Várzea 1100 79 2631.1 33.49 Very high 9.1 17.97 3.39 8.74 27.4 2166
2 Boca do Acre 7920 566 22348.9 39.51 Very high 60 6.10 2.84 1.38 25.8 2039
3 Autazes 2599 186 7599.3 40.94 Very high 18 10.91 3.40 4.26 27.1 2230
4 Boa Vista do
Ramos 712 51 2586.8 50.86 Very high 0.9 7.71 9.37 5.69 27.3 2249
5 Barreirinha 1469 105 5750.5 54.80 Very high 5.2 90.93 891.83 4.88 27.6 2334
6 Parintins 1471 105 5952.3 56.65 Very high 4 7.83 0.49 18.06 27.8 2257
7 Careiro 1477 106 6091.5 57.74 Very high 4.9 35.35 314.33 5.16 27.2 2171
8 Manaquiri 846 60 3975.8 65.79 Very high 1.2 4.38 2.97 5.36 27.3 2218
9 Lábrea 13593 971 68229.0 70.27 Very high 158 13.96 127.55 0.53 26.4 2318
10 Itacoatiara 1727 123 2906.7 72.08 Very high 13 25.13 0.80 9.90 27 2220
11 Apuí 9979 713 2215.0 76.10 High 92 13.48 10.51 0.35 27.3 2200
12 Alvarães 1049 75 8892.0 78.90 High 3.5 10.75 8.94 2.45 26.9 2261
13 Manicoré 8422 602 54239.9 80.26 High 59 36.16 1180.34 0.95 26.1 2019
14 Urucurituba 493 35 7329.2 82.54 High 0.4 29.46 23.05 5.58 27.3 2309
15 Manacapuru 1221 87 48282.5 84.04 High 5.6 17.18 4.12 11.91 26.6 2550
16 Canutama 4836 345 5911.8 86.33 High 36 6.29 370.98 0.42 26.9 2645
17 Silves 593 42 3748.8 88.50 High 2.2 13.64 45.41 2.35 21.7 2191
18 Iranduba 335 24 29819.6 92.57 High 3.4 23.86 153.51 18.50 26.5 2440
19 Nova Olinda do
Norte 807 58 8904.2 97.30 High 3.5 15.57 126.12 5.66 25.4 2170
20 Guajará 1196 85 5608.5 104.23 High 7.4 39.19 12.66 1.60 27.1 2241
21 Novo Aripuanã 5220 373 41191.3 110.47 High 47 20.45 5.34 0.52 26.9 2444
22 Humaitá 3853 275 33071.7 120.17 High 12 16.73 73.01 1.24 26.5 2322
23 Anamá 239 17 2453.9 143.74 High 0.7 28.21 77.94 3.88 27 2251
24 Envira 1168 83 13369.3 160.25 Average 8.5 36.91 2.33 1.27 25.8 2497
25 Rio Preto da Eva 507 36 14105.6 160.52 Average 3.1 20.02 209.45 4.59 27.6 2348
26 Uarini 876 63 25422.2 163.75 Average 3.1 45.45 189.43 1.20 27.1 2975
27 Nhamundá 1201 86 9456.6 164.43 Average 4 11.91 68.81 1.30 27.1 2204
28 Caapiranga 800 57 5813.2 165.49 Average 1.5 21.58 54.37 1.17 27.3 2302
29 FigueiredoPresidente 2131 152 39988.4 167.02 Average 10 92.11 285.50 1.08 27.2 2101
30 Maués 3338 238 10246.2 167.72 Average 16 9.26 9.23 1.30 26.6 3032
31 Tefé 1911 137 23704.4 173.66 Average 5.9 4.99 18.16 2.75 27 2464
32 Eirunepé 873 62 4231.1 253.89 Average 2.6 2.69 0.64 1.97 27 2163
Code /
Rank Municipality HS* Mean annual
HS
Municipality area (km²)
Mean annual HS
density (km2/HS)
HS frequency of incidence**
Deforested area (km2)***
Agricultural area (km2)+
Pasture area (km2)++
Demographic density (hab/
km²)+++
Mean annual temperature
(ºC)++++
Mean annual rainfall (mm)++++
34 Tabatinga 163 12 11401.1 277.00 Average 1.2 16.79 12.37 15.94 27.4 2145
35 Manaus 543 39 3225.1 293.95 Average 3.7 45.03 1952.51 158.97 25.9 2748
36 Ipixuna 608 43 10741.0 312.37 Low 5 153.04 63.21 1.57 27.3 2105
37 São Sebastião do Uatumã 430 31 13565.9 349.71 Low 2.8 20.04 28.38 0.97 25.8 2491
38 Anori 211 15 5795.3 384.52 Low 0.7 23.51 64.76 2.72 26.9 2391
39 Borba 1285 92 44251.2 482.11 Low 5.2 120.42 468.04 0.81 27.1 2023
40 Amaturá 124 9 4758.8 537.28 Low 0.5 11.99 1.83 2.01 25.6 2896
41 Beruri 429 31 17251.2 562.98 Low 1.9 77.84 102.47 0.89 25.8 2039
42 Coari 1407 101 57921.6 576.33 Low 2.8 22.75 72.43 1.36 26.3 2290
43 Pauini 924 66 43263.4 655.51 Very low 6.3 30.62 32.10 0.42 25.8 2359
44 Santo Antônio do Içá 253 18 12307.8 681.06 Very low 1 5.74 7.60 2.31 25.7 3261
45 Tonantins 123 9 6432.6 732.17 Very low 0.7 24.15 247.81 2.87 25.7 3033
46 Carauari 474 34 25767.3 761.06 Very low 1.1 48.61 199.52 1.03 26.2 2587
47 Codajás 340 24 18711.6 770.48 Very low 1.4 16.01 62.05 1.18 26.7 2654
48 Benjamin Constant 141 10 8793.4 873.10 Very low 0.8 79.06 100.73 3.70 25.8 2751
49 Fonte Boa 174 12 12110.9 974.44 Very low 0.9 27.50 49.64 2.18 25.6 2750
50 Urucará 303 22 27904.9 1289.34 Very low 1.6 7.18 3.97 0.67 27.4 2089
51 Tapauá 959 69 89324.3 1304.00 Very low 3.1 8.05 2.03 0.21 25.6 2460
52 Maraã 181 13 16910.4 1307.99 Very low 1.5 25.48 6.25 1.11 26.1 2857
53 Itamarati 252 18 25275.9 1404.22 Very low 1.7 11.75 3.40 0.32 25.8 2530
54 São Paulo de Olivença 193 14 122475.7 1432.34 Very low 1 6.38 48.16 1.63 26.8 2339
55 Barcelos 1123 80 19745.8 1526.86 Very low 1.5 15.49 50.43 0.23 25.6 2717
56 São Gabriel da Cachoeira 861 62 37771.2 1775.36 Very low 3.6 5.78 5.74 0.36 24.2 2504
57 Juruá 151 11 109184.9 1798.71 Very low 1.5 22.63 28.80 0.53 26.4 2909
58 Novo Airão 292 21 19400.4 1810.95 Very low 1 103.30 7.22 0.36 26.2 2937
59 Jutaí 283 20 69551.9 3440.73 Very low 1.9 10.34 2.87 0.29 25.6 2957
60 Santa Isabel do Rio Negro 205 15 62846.2 4291.94 Very low 1.3 39.10 0.76 0.26 26.8 2497
61 Atalaia do Norte 154 11 55791.5 6941.36 Very low 1.5 22.35 53.24 0.19 25.7 3101
62 Japurá 106 8 76355.0 7368.69 Very low 0.9 14.72 13.92 0.14 25.8 2709
* Accumulated between 2003 and 2016 (Source: INPE 2017) ** According to White and White (2016)
*** Annual mean from 2003 to 2016 (Source: PRODES 2017) + Annual mean from 2003 to 2016 (Source: IBGE 2017b)
++ Annual mean from data of the years 2004, 2008, 2010, 2012 and 2014 (Source: CRA 2017) +++ Annual mean from 2003 to 2016 (Source: IBGE 2017c)
++++ Average value based on data from 1982 to 2012 (Source: Climate-Data 2017)
Table 3. Matrix of Pearson correlation coefficients (r) between all variables (dependent and independent) used in this study based on the mean value for each municipality of Amazonas state (Brazil). Significant correlations are marked in bold.
Hot Spots Municipality area Pasture area Population density Deforested area Agricultural area Rainfall Temperature
Hot Spots 1.00 0.27* 0.92** -0.08 0.96** 0.46** -0.26* 0.06
Municipality area 1.00 0.18 -0.16 0.26* 0.03 0.15 -0.13
Pasture area 1.00 -0.04 0.95** 0.29* -0.26* 0.00
Population density 1.00 -0.06 0.02 -0.16 0.19
Deforested area 1.00 0.34* -0.20 0.01
Agricultural area 1.00 -0.16 0.23
Rainfall 1.00 -0.29*
Temperature 1.00
Note: The source of the data for each variable are described in Table 2.
* Significant at p < 0.05
** Significant at p < 0.01
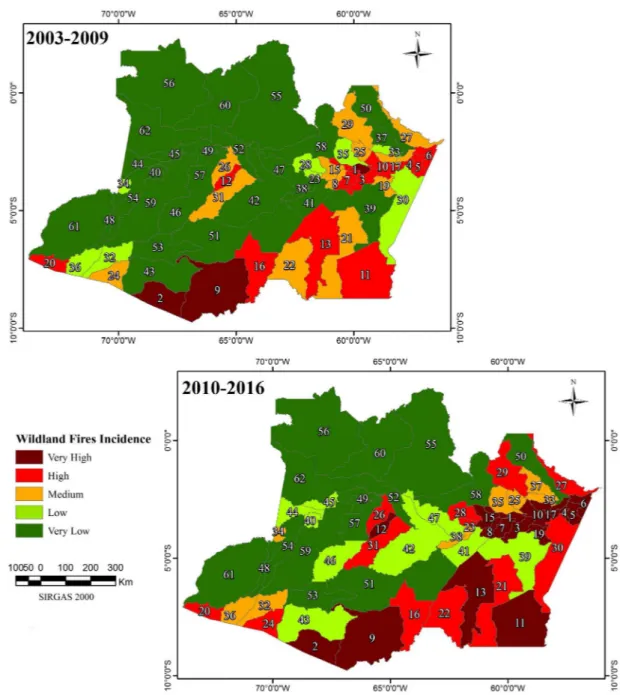
Amazonas was Very Low (in 26 municipalities, representing 63.71% of the state area). In the latter seven years of the time series (2010-2016) only 15 municipalities (47.97% of the state area) had a Very Low incidence frequency. The Very High category, on the other hand, rose from 3 to 18 municipalities from the first to the second period, reflecting the increase of wildland fire activity in the state during the last years (Table 4). The southern and eastern regions of the state showed the highest fire incidence in both periods (Figure 3).
Figure 3. Wildland fire incidence in the municipalities of the state of Amazonas (Brazil) based on the classification proposed by White and White (2016). The first image is based on the mean annual number of hot spots in the period 2003-2009. The second is based on the mean annual number of hot spots in the period 2010-2016. Municipalities are indicated by numbers with correspondence in Table 2. This figure is in color in the electronic version.
Table 4. Number of municipalities and percentage of the total state area for each of five wildland fire incidence classes for the two study periods. Fire incidence classification according to White and White (2016).
Wildland Fire Incidence Number of municipalities (% of total area) 2003-2009 2010-2016
Very High 3 (5.93%) 18 (16.83%)
High 12 (11.86%) 12 (16.03%)
Average 13 (12.13%) 8 (4.49%)
Low 8 (6.38%) 9 (14.68%)
DISCUSSION
Although the use of satellites for detecting wildland fires has the advantage of wide range and access to remote areas, resolution limitations of satellites equipped with Moderate Resolution Imaging Spectroradiometer (MODIS) sensor, as in AQUA, prevent the detection of small wildland fires with front line width below 30 m (INPE 2017). Additionally, satellite-based fire detection may also be restricted when fires started and ended during the interval between the satellite passage, by the presence of dense clouds above the burning area, surface fire under closed canopy vegetation, and fire on mountainsides opposite to the satellite observation path (Setzer et al. 1992; Pereira et al. 2012; INPE 2017). Therefore, the number of wildland fires recorded in this study is likely underestimated. The highest number of hot spots in the months of August and September follows the pattern observed in most of South America (Bella et al. 2006; White 2017). All South American countries below the equator, with the exception of Chile, present higher fire activity from August to November (White 2017). Vasconcelos et al. (2013) also estimated that 99% to 95% of the wildland fires in the Amazonas state occur from July to March with peaks in August, September and October.
The predominant climate in Amazonas is equatorial, differing in some aspects from the predominant tropical climates in Brazil (Mendonça and Danni-Oliveira 2007), with temperatures in winter usually higher than in summer, and a very small intra-annual variation. In most of the state, the hottest months are August, September and October (Mendonça and Danni-Oliveira 2007; Climate-Data 2017). In all municipalities annual rainfall is rarely below 2,000 mm, however, during winter, mainly in August and September, monthly precipitation may fall below 50 mm in some municipalities (Mendonça and Danni-Oliveira 2007; Climate-Data 2017). Due to low rainfall and high temperatures during this period, the fuel load becomes drier and, therefore, susceptible to burning.
The interannual changes in wildland fire occurrence observed in this study are mostly due to human behavior and are probably linked with climate variations caused by global warming and by the El Niño and La Nina phenomenons (Victoria et al. 1998; Jiménez-Muñoz 2016; White 2017). During the last century global warming was responsible for an increase of 0.56 ºC in the mean temperature in the Brazilian Amazon (Victoria et al. 1998). New climate models predict a reduction in rainfall in the Amazon Basin due to changes in sea surface temperature due to global warming (Harris et al. 2008; Dai 2013). The increase in temperature and reduction in rainfall cause a decrease in vegetation moisture content, the most important component that affects the ignition probability and fire behavior (White et al. 2016b).
The El Niño–Southern Oscillation (ENSO) alters rainfall patterns and intensifies drought in some South American
regions. Recent studies proved the relation between ENSO and interannual fire activity (Page et al. 2008; Chen et al. 2011; Jiménez-Muñoz et al. 2016). The 2015-2016 ENSO was responsible for record-braking high temperatures and extreme drought in the Amazon region (Jiménez-Muñoz et al. 2016). These extreme temperatures and droughts were likely the main factors responsible for the highest incidence of hot spots in 2015 and 2016. On the other hand, La Niña consists of a basinwide cooling of the tropical Pacific Ocean, and thus the cold phase of ENSO, causing an increase in rainfall in some South American regions (Trenberth 1997). The strong La Niña events during 2007 and 2011 (Null 2016) are likely responsible for the reduction of hot spot detection during these years.
Although meteorological and climatic parameters play a key role in the wildland fire occurrence in the state of Amazonas, human behavior is responsible for 99% of ignition sources, since only 1% of wildfires in Brazil originate from a natural source, that is lightning (Soares and Batista 2007). Therefore, it is essential to analyze human activities in order to understand better fire occurrence.
Land use is one of the most important variables in determining wildland fire risk. While tropical forests have a low fire risk, agricultural fields and pastures are generally defined as high risk (e.g. Gonçalves et al. 2011; Suryabhagavan
et al. 2016; Ajin et al. 2016; White et al. 2016a). In this study, the municipalities with larger deforested areas, pasture areas and agricultural areas had a higher number of hot spots, which was probably related to deforestation for agricultural and livestock expansion (DeFries et al. 2008) and the constant use of fire for land clearing. The large fires related to deforestation are easily detected through remote sensing. Small controlled burns, used for clearing pastures and agricultural areas from weeds and shrubs, can be detected by satellites usually when the frontline is wider than 30 m (INPE 2017).
Although deforestation rates in the Brazilian Amazon have declined from 2004 to 2014 (CRA 2017), the number of hot spots detected during this period increased. This happens because fire continues to be used after deforestation as a tool for cleaning pastures and agricultural fields (Chen et al. 2011). Therefore, it is important to consider accumulated deforestation rates and data on land use change when analyzing wildland fire occurrence.
devastating force in Amazonia in recent years. The expectations for the next years are not good, as the native forest continues to be cleared and global warming effects increase in the region (Dai 2013; Vasconcelos et al. 2013).
The significant correlation of the number of hot spots with the mean annual amount of rainfall was expected, since vegetation moisture content increases with rainfall, making it more difficult to burn (Schroeder and Buck 1970; Soares and Batista 2007; White and Ribeiro 2011; White and White 2016). Although air temperature is also pointed out by several authors as an important factor that positively influence fire occurrence through the drying of the fuel load (e.g. Schroeder and Buck 1970; Soares and Batista 2007; White et al. 2016b), the variation of average annual air temperature among the municipalities was very low and was not significantly correlated with fire occurrence.
Despite the absence of a significant correlation between the number of hot spots and demographic density, the latter variable is constantly cited in the literature as a main factor that positively affects wildland fire incidence (e.g. Oliveira et al. 2004; Liu et al. 2012; White et al. 2016a; Suryabhagavan
et al. 2016; Ajin et al. 2016). Since anthropic activities are responsible for 99% of wildfires that occur in Brazil (Soares and Batista 2007), and fires in Amazonas state are mainly initiated by humans (Vasconcelos et al. 2013), it could be expected that more densely populated municipalities would be more prone to burnings. However, larger populations are usually concentrated in urbanized areas, with lower density of pastures, agricultural fields and forest areas (White and White 2016).
The map indicating the wildland fire incidence in the municipalities of the state of Amazonas can be an important visual tool to assess the future risk of wildland fire occurrence. In both periods assessed, the municipalities most affected by fire were located in the south and east of the state, confirming that data from past fires can be used to predict areas with higher risk of future fires (White and White 2016). Besides using fire occurrence history, other thematic maps of the road system, land use, rainfall distribution, among other aspects, can be integrated using Geographic Information Systems (GIS), allowing a better interpretation of the factors responsible for wildland fire occurrence (Chuvieco and Salas 1996; Díaz-Delgado et al. 2004; White and White 2016; White et al. 2016a).
CONCLUSIONS
The incidence of hot spots in the state of Amazonas increased significantly from 2003 to 2016. The expectation that numbers will continue to grow imposes the urgent need for the implementation of public policies aimed to reduce wildland fires in the region, thus ensuring the conservation of the Amazon rainforest and its biodiversity. These public
policies should be applied mainly in the southern and eastern municipalities of the state, since deforestation and fire occurrence were more intense in these regions over the study period. The prevention and combat of wildfires should be carried out with greater effort from early August to late October, since more than 80% of the hot spots were detected during this period of the year. If the Amazon rainforest continues to be replaced by croplands and, mainly, cattle ranching, and no measures are taken to reduce the use of fire as a management tool, the number of wildland fires in the region will continue to grow, increasing the release of carbon dioxide into the atmosphere and putting at risk global climate stability.
ACKNOWLEDGMENTS
To the Fundação de Apoio à Pesquisa e à Inovação Tecnológica do Estado de Sergipe (FAPITEC/SE) and the Conselho Nacional de Desenvolvimento Científico e Tecnológico (CNPq) for a scholarship and funding, and to Prof. Theodore James White.
REFERENCES
Almeida, C.A.; Coutinho, A.C.; Esquerdo, J.C.D.M.; Adami, M.; Venturieri, A.; Diniz, C.G.; Dessay, N.; Durieux, L.; Gomes, A.R. 2016. High spatial resolution land use and land cover mapping of the Brazilian Legal Amazon in 2008 using Landsat-5/ TM and MODIS data. Acta Amazonica, 46: 291-302. Alves, F.S.M.; Fisch, G.; Vendrame, I.F. 1999. Modificações do
microclima e regime hidrológico devido ao desmatamento na Amazônia: estudo de um caso em Rondônia (RO), Brasil. Acta Amazonica, 29: 395-409.
Ajin, R.S.; Loghin, A.M.; Jacob, M.K.; Vinod, P.G.; Krishnamurthy, R.R. 2016. The Risk Assessment Study of Potential Forest Fire in Idukki Wildlife Sanctuary using RS and GIS Techniques. International Journal of Advanced Earth Science and Engineering, 5: 308-318.
Araujo, R.C.; Ponte, M.X. 2016. Efeitos do Desmatamento em Larga-Escala na Hidrologia da Bacia do Uraim, Amazônia. Revista Brasileira de Geografia Física, 9: 2390-2404.
Arbex, M.A.; Cançado, J.E.D.; Pereira, L.A.A.; Braga, A.L.F.; Saldiva, P.H.D.N. 2004. Queima de biomassa e efeitos sobre a saúde. Jornal Brasileiro de Pneumologia, 30: 158-75.
Batista, A.C. 2004. Detecção de incêndios florestais por satélites. Floresta, 34: 237-241.
Bella, C.M.; Jobbágy, E.G.; Paruelo, J.M.; Pinnock, S. 2006. Continental fire density patterns in South America. Global Ecology and Biogeography, 15: 192-199.
Cabral, A.L.A.; Moras Filho, L.O.; Borges, L.A.C. 2013. Uso do fogo na agricultura: legislação, impactos ambientais e realidade na Amazônia. Periódico Eletrônico Fórum Ambiental da Alta Paulista, 9: 159-172.
Chuvieco, E.; Salas, J. 1996. Mapping the spatial distribution of forest fire danger using GIS. International Journal of Geographical Information Science, 10: 333-345.
Climate-Data. 2017. Clima: Amazonas (https://pt.climate-data.org/ region/95/). Accessed on 16/02/2017.
Cohen, J.C.P.; Beltrão, J.D.C.; Gandu, A.W.; Silva, R.R.D. 2007. Influência do desmatamento sobre o ciclo hidrológico na Amazônia. Ciência e Cultura, 59: 36-39.
CGOBT. 2017. Coordenação Geral de Observação da Terra. Projeto PRODES: Monitoramento da Floresta Amazônica Brasileira por satélite (http://www.obt.inpe.br/prodes/index.php). Accessed on 01/02/2017.
Correia, F.W.S.; Alvalá, R.C.S.; Manzi, A.O. 2008. Modeling the impacts of land cover change in Amazonia: a regional climate model (RCM) simulation study. Theoretical and Applied Climatology, 93: 225-244.
CRA. 2017. Centro Regional da Amazônia. TerraClass (http://www. inpe.br/cra/projetos_pesquisas/terraclass2014.php) Accessed on 16/02/2017.
Dai, A. 2013. Increasing drought under global warming in observations and models. Nature Climate Change, 3: 52-58. DeFries, R.S.; Morton, D.C.; Van Der Werf, G.R.; Giglio, L.;
Collatz, G.J.; Randerson, J.T.; Shimabukuro, Y. 2008. Fire‐ related carbon emissions from land use transitions in southern Amazonia. Geophysical Research Letters, 35: 1-5.
Díaz-Delgado, R.; Lloret, F.; Pons, X. 2004. Spatial patterns of fire occurrence in Catalonia, NE, Spain. Landscape Ecology, 19: 731-745.
Fisch, G.; Lean, J.; Wright, I.R.; Nobre, C.A. 1997. Simulações climáticas do efeito do desmatamento na Região Amazônica: Estudo de um caso em Rondônia. Revista Brasileira de Meteorologia, 12: 33-48.
Goldammer, J.G.; Mutch, R.W. 2001. Global forest fire assessment 1990-2000. Food and Agriculture Organization of the United Nations, Rome, 494p.
GEA. 2017. Governo do Estado do Amazonas. Dados (http:// www.amazonas.am.gov.br/o-amazonas/dados/). Accessed on 16/02/2017.
Gonçalves, C.N.; Mesquita, F.W.; Lima, N.R.G.; Coslope, L.A.; Lintomen, B.S. 2011. Recorrência dos incêndios e fitossociologia da vegetação em áreas com diferentes regimes de queima no Parque Nacional da Chapada Diamantina. Revista Biodiversidade Brasileira, 1: 161-179.
Harris, P.P.; Huntingford, C.; Cox, P.M. 2008. Amazon Basin climate under global warming: the role of the sea surface temperature. Philosophical Transactions of the Royal Society of London B: Biological Sciences, 363: 1753-1759.
IBGE. 2017a. Instituto Brasileiro de Geografia e Estatística. Área Territorial Brasileira (http://ibge.gov.br/home/geociencias/ areaterritorial/principal.shtm). Accessed on 16/02/2017. IBGE. 2017b. Instituto Brasileiro de Geografia e Estatística. Produção
Agrícola Municipal (https://sidra.ibge.gov.br/pesquisa/pam/ tabelas) Accessed on 17/11/2017.
IBGE. 2017c. Instituto Brasileiro de Geografia e Estatística. Estimativas de População - EstimaPop (https://sidra.ibge.gov.br/ pesquisa/estimapop/tabelas). Accessed on 16/11/2017.
INPE. 2017. Instituto Nacional de Pesquisas Espaciais. Programa Queimadas: Monitoramento por Satélites (http://www.inpe.br/
queimadas). Accessed on 10/01/2017.
IPAAM. 2010. Instituto de Proteção Ambiental do Amazonas. Portaria IPAAM n° 127 de 17 de Agosto de 2010. Diário Oficial do Estado do Amazonas (DOEAM) de 20 de Agosto de 2010. Jiménez-Muñoz, J.C.; Mattar, C.; Barichivich, J.; Santamaría-Artigas,
A.; Takahashi, K.; Malhi, Y.; Sobrino, J.A.; Van Der Schrier, G. 2016. Record-breaking warming and extreme drought in the Amazon rainforest during the course of El Niño 2015–2016. Scientific Reports, 6: 1-7.
Kottek, M.; Grieser, J.; Beck, C.; Rudolf, B.; Rubel, F. 2006. World map of the Köppen-Geiger climate classification updated. Meteorologische Zeitschrift, 15: 259-263.
Liu, Z.; Yang, J.; Chang, Y.; Weisberg, P.J.; He, H.S. 2012. Spatial patterns and drivers of fire occurrence and its future trend under climate change in a boreal forest of Northeast China. Global Change Biology, 18: 2041-2056.
Mendonça, F.; Danni-Oliveira, I.M. 2007. Climatologia: noções básicas e climas do Brasil. Oficina de Texto, São Paulo. 206p. Null, J. 2016. El Niño and La Niña Years and Intensities (http://
ggweather.com/enso/oni.htm). Acessed on 01/11/2017. NWCG. 2017. National Wildfire Coordinating Group. Glossary
A-Z (https://www.nwcg.gov/glossary/a-z#letter_w). Accessed on 01/03/2017.
Oliveira, D.S.; Batista, A.C.; Soares, R.V.; Grodzki, L.; Vosgerau, J. 2004. Zoneamento de risco de incêndios florestais para o Estado do Paraná. Floresta, 34: 217-221.
Page, Y.L.; Pereira, J.M.C.; Trigo, R.; Camara, C.D.; Oom, D.; Mota, B. 2008. Global fire activity patterns (1996–2006) and climatic influence: an analysis using the World Fire Atlas. Atmospheric Chemistry and Physics, 8: 1911-1924.
Pereira, A.A., Pereira, J.A.A.; Morelli, F.; Barros, D.A.; Acerbi Junior, F.W.; Scolforo, J.R.S. 2012. Validação de focos de calor utilizados no monitoramento orbital de queimadas por meio de imagens TM. CERNE, 18: 335-343.
Primack, R.B.; Rodrigues, E. 2001. Biologia da conservação. Midiograf, Londrina, 327p.
Schroeder, M.J.; Buck, C.C. 1970. Fire weather: a guide for application of meteorological information to forest fire control operations. USDA Forest Service, Agriculture Handbook 360, 229p. SEMA. 2017. Secretaria do Estado do Meio Ambiente. Secretarias
(http://www.amazonas.am.gov.br/entidade/secretatia-de-estado-do-meio-ambiente-sema/). Accessed on 01/02/2017.
Setzer, A.; Pereira, M.C.; Pereira Jr, A.C. 1992. O uso de satélites NOAA na detecção de queimadas no Brasil. Climanálise, 7: 40-53.
This is an Open Access article distributed under the terms of the Creative Commons Attribution License, which permits unrestricted use, distribution, and reproduction in any medium, provided the original work is properly cited.
Soares, R.V.; Batista, A.C. 2007. Incêndios Florestais: controle, efeitos e uso do fogo. Universidade Federal do Paraná, Curitiba, 264p. Sumila, T.C.A. 2016. Fontes e destinos de vapor de água na Amazônia
e os efeitos do desmatamento. Master’s thesis, Universidade Federal de Viçosa, Minas Gerais, 57p.
Suryabhagavan, K.V.; Alemu, M.; Balakrishnan, M. 2016. GIS-based multi-criteria decision analysis for forest fire susceptibility mapping: a case study in Harenna forest, southwestern Ethiopia. Tropical Ecology, 57: 33-43.
Trenberth, K.E. 1997. The definition of El Niño. Bulletin of the American Meteorological Society, 78: 2771-2777.
Vasconcelos, S.S.; Fearnside, P.M.; Alencastro Graça, P.M.L.; Nogueira, E.M.; Oliveira, L.C.; Figueiredo, E.O. 2013. Forest fires in southwestern Brazilian Amazonia: Estimates of area and potential carbon emissions. Forest Ecology and Management, 291: 199-208.
Victoria, R.L.; Martinelli, L.A.; Moraes, J.M.; Ballester, M.V.; Krusche, A.V.; Pellegrino, G.; Richey, J.E. 1998. Surface air temperature variations in the Amazon region and its borders during this century. Journal of Climate, 11: 1105-1110. Wang, S.D.; Miao, L.L.; Peng, G.X. 2012. An Improved Algorithm
for Forest Fire Detection Using HJ Data. Procedia Environmental Sciences, 13: 140-150.
White, B.L.A. 2017. Satellite Detection of Wildland Fire in South America. Proceedings of the 2nd World Congress on Civil,
Structural, and Environmental Engineering. International Academy of Science, Engineering and Technology,Barcelona, Spain, paper ICESDP 111. doi: 10.11159/icesdp17.111 White, B.L.A.; Ribeiro, A.S. 2011. Análise da precipitação e sua
influência na ocorrência de incêndios florestais no Parque Nacional Serra de Itabaiana, Sergipe, Brasil. Ambiente e Água, 6: 148-156.
White, B.L.A.; White, L.A.S. 2016. Queimadas e incêndios florestais no estado de Sergipe, Brasil, entre 1999 e 2015. Floresta, 46: 561-570.
White, L.A.S.; White, B.L.A.; Ribeiro, G.T. 2016a. Modelagem especial do risco de incêndio florestal para o município de Inhambupe, BA. Pesquisa Florestal Brasileira, 36: 41-49. White, B.L.A.; White, L.A.S.; Ribeiro, G.T.; Souza, R.M. 2016b.
Empirical models for describing fire behavior in Brazilian commercial eucalypt plantations. CERNE, 22: 397-406.