ABSTRACT: Phenotypic plasticity is the ability of plants to undergo changes in morphology and yield components to adapt themselves to distinct environmental conditions. The knowledge on the changes in yield components of branches and stems at varied plant spatial arrangements needs to be updated due to recent changes in soybean production system. Thus, this study aimed to evaluate the yield components of branches and stems, as well as to assess the share of these plant parts in the total grain yield of soybean cultivars with indeterminate growth type, under different spatial arrangements. The experiment was conducted during the growing seasons of 2013/2014 and 2014/2015, under a randomized complete-block design and in a 4 × 3 × 2 factorial scheme with three replications. Treatments consisted
CROP PRODUCTION AND MANAGEMENT -
Article
Plant spatial arrangement affects grain production
from branches and stem of soybean cultivars
André Sampaio Ferreira1*, Claudemir Zucareli1, Flavia Werner1, Alvadi Antonio Balbinot Junior2
1.Universidade Estadual de Londrina - Departamento de Agronomia - Londrina (PR), Brazil. 2.Embrapa Soja - Manejo do Solo e da Cultura da Soja - Londrina (PR), Brazil.
*Corresponding author: [email protected]
Received: Aug. 24, 2017 – Accepted: Jan. 2, 2018
INTRODUCTION
Alterations in the spatial arrangement of soybeans regarding row spacing, plant density, and uniformity in plant distribution in a row may determine intraspecific competition for resources such as water, light, and nutrients, in addition to influencing grain yield and yield components (Balbinot Junior et al. 2016). As a result, spatial distribution can affect plant growth, development, and grain yield (De Bruin and Pedersen 2008; Thompson et al. 2015; Zhou et al. 2015; Balbinot Junior et al. 2015a).
The use of indeterminate growth type cultivars and new row spacing patterns such as crossed rows, associated to the high cost of genetically modified seeds in Brazil, has justified research for determining the ideal plant arrangement in soybeans, aiming at the increase of grain yield coupled with the reduction in plant density. Among the most studied spacing patterns of soybean are twin-row sowing – developed in the USA (Bruns 2011a; 2011b) –, crossed rows – arisen in Brazil in the 2009/10 growing season (Balbinot Junior et al. 2015a; 2015b; Lima et al. 2012) –, and narrow rows (Balbinot Junior et al. 2015a; Moreira et al. 2015). Changes in row spacing can improve grain yield (Bruns 2011b; Rambo et al. 2003), however, in general, these changes have little effect on soybean grain yield given the high phenotypic plasticity of these plants (Cox and Cherney 2011; Lee et al. 2008; Suhre et al. 2014). This characteristic consists in the ability of a plant to change its morphology and yield components to adapt itself to the conditions imposed by the environment.
At low densities, soybean plants tend to emit a higher number of branches, increasing the number of pods per plant and compensating a small number of individuals per area for a greater production per plant with no effects in grain yield. This mechanism is responsible for maintaining grain yield at the same levels over a wide plant density range (Balbinot Junior et al. 2015a; Ferreira et al. 2016). According to Procópio et al. (2014), high plant densities and narrow rows spacing decrease grain yield of branches, increasing the share of stem in the total production per plant. Therefore, branches become more important to the grain yield when lower seeding densities are associated with larger row spacing.
However, there is little information in the literature regarding the changes in yield from branches and stem caused by row spacing (narrow row, twin row, crossed rows and traditional row spacing) and by seeding rate-row spacing
interaction considering soybean cultivars with compact plant architecture and indeterminate growth type. The objective of this study was to evaluate the yield components of branches and stems, as well as to assess the share of these plant parts in the total grain yield of soybean cultivars with indeterminate growth type, under different spatial arrangements.
MATERIAL AND METHODS
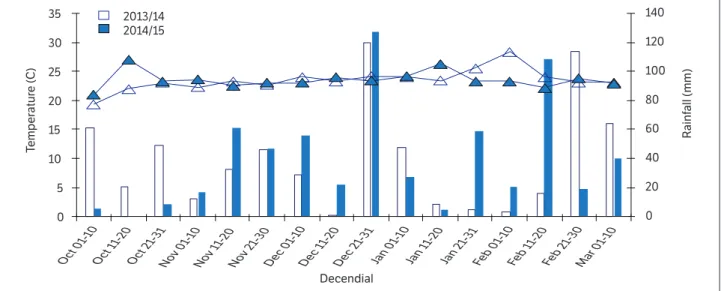
The experiment was conducted in Londrina, Paraná, Brazil, located at 23°11’ S, 51°11’ W and 620 m a.s.l., Cfa Köpen-Geiger climate, Rhodic Eutrudox soil type according to the American soil classification (Soil Survey Staff, 2010), during the 2013/2014 (GS1) and 2014/2015 (GS2) growing seasons in the same area. The values of rainfall and mean air temperature during the conduction of the experiments were obtained in the agrometeorological station of Embrapa Soja, distant about 600 m from the experiment site, and are presented in Fig. 1.
The sequential climatological water balance (SCWB) of Thornthwaite and Mather (1955) was calculated for both growing seasons (Fig. 2). For the SCWB, the reference evapotranspiration (ETo) was calculated during the course of the experiment by the Penman-Monteith equation and transformed into the evapotranspiration of the soybean crop (ETc = ETo × Kc) according to the recommendation of the crop coefficient (Kc) by FAO (Allen et al. 1998). The soil water available (BAC) used for the SCWB calculation was 75 mm. The chemical attributes of the soil in the 0 to 20 cm layer were: 21.4 g∙dm–3 of organic carbon; 4.9 pH in CaCl
2;
8.6 mg∙dm–3 of P (Mehlich 1); 0.55 cmol
c∙dm–3 exchangeable
K; 3.7 cmolc.dm–3 exchangeable Ca and 1.4 cmolc∙dm–3
exchangeable Mg. Crops antecedent to soybean were wheat and black oat in 2013/2014 and 2014/2015 growing seasons. Black oats were mechanically managed, without soil mobilization, 30 days before soybean sowing. The remaining vegetation cover in the area was chemically desiccated with glyphosate (1080 g a.e.∙ha–1) and carfentrazone-ethyl
(30 g∙ha–1) 15 days before sowing in both years.
viable seeds∙ha–1 –; and two soybean cultivars – BMX Potência
RR and BRS 359 RR.
The plots were 10 m long and 5 m wide, with a harvestable area of 24 m2 (8 m long and 3 m wide). Both cultivars, BMX
Potência RR and BRS 359 RR, are resistant to glyphosate herbicide and have indeterminate growth type, belonging to the relative maturity groups 6.7 and 6.0, respectively. The recommended seeding rate ranges from 265 to 310 thousand plants∙ha–1 for BMX Potência RR and between 220 and
265 thousand plants∙ha–1 for BRS 359 RR.
The sowing dates were October 23, 2013 (S1), and November 11, 2014 (S2). In S2, the area was irrigated (30 mm) three days before sowing, since a drought occurred in October (Fig. 1). Sowing was performed using an Imasa MPS 1800 planter for plots with narrow rows (0.2 m) and twin rows (0.2/0.8 m), and with a Semeato SHM 11/13 planter for those plots with traditional spacing (0.5 m) and crossed rows (0.5 m crossed). In the sowing of twin rows, all the furrowing discs were kept spaced 0.2 m apart from each other, however, the deposition of seeds was intercalated to match the 0.2/0.8 m spacing.
On the day of sowing, seeds were treated with carboxanilide + dimethyldithiocarbamate (3 mL∙kg–1 seed)
and Bradyirhizobum elkaniibr liquid inoculant (5 × 10⁹
colony forming units∙mL–1; 2 mL∙kg–1 seed). Fertilization
consisted of 125 kg triple superphosphate (41% P2O5) and
250 kg potassium chloride (60% K2O) per hectare manually
spread on the soil surface seven days before sowing. Weed, pest, and disease management practices were the same for
all treatments and followed the technical recommendations for the crop.
At V3 stage (Fehr and Caviness 1977), the plant density was evaluated by counting the number of plants within the 3 m–2 harvestable area per plot. At R8 (Fehr and Caviness
1977), 20 plants were collected per plot for evaluation of number of pods per plant (NPP), number of grains per pod (NGP), and thousand-grain mass (M1000) of both stems and branches, besides the percentage of grain yield of branches (GYB). It was considered as branches the vegetative structures inserted in the stem containing more than one node. M1000 was measured in eight replicates of one hundred grains.
The data were submitted to the Shapiro-Wilk test for normality, and to the Cochran test for homoscedasticity of variances. After verifying the assumptions, variance analysis and comparison of means, by the Tukey test (p < 0.05), were performed. The variables expressed as percentages were transformed into √x.
RESULTS AND DISCUSSION
In GS1, the environmental conditions were unfavorable to soybean development, especially during the grain filling phase due to a severe and long water deficit associated with higher temperatures (Figs. 1 and 2a). In GS2, the water deficit in the grain filling phase was less intense and faster, providing more adequate conditions to the crop (Fig. 2b).
Figure 1. Rainfall (mm) and mean air temperature (°C) by decendial, during the soybean development cycle. Total accumulated rainfall in the period: 625 mm (2013/2014) and 622 mm (2014/2015). Londrina, Paraná, Brazil, 2013/2014 and 2014/2015 growing seasons.
0 20 40 60 80 100 120 140 0 5 10 15 20 25 30 35
Oct 01 -10
Oct 1 1-20
Oct 2 1-31
Nov 01 -10
Nov 1 1-20
Both seeding rate and the interaction between cultivar and row spacing had an influence on NPP of stems in the
GS1, with SR3 providing a fewer NPP (Table 1). Individually, row spacing had no influence on NPP of stem for both
Figure 2. Sequential climatological water balance (mm) of Thornthwaite and Mather, by decendial, during the soybean development cycle. Londrina, Paraná, Brazil, (a) 2013/2014 and (b) 2014/2015 growing seasons.
–30 –20 –10 0 10 20 30 40 50 –40 –20 0 20 40 60 80 100 W at er (mm) W at er (mm) Decendial Decendial Excess Deficit
Sowing R1 Harvest
Sowing R1 Harvest
Oct 1 1-20
Oct 2 1-3 1 No v 01 -10 No v 1
1-20
No v 21-3
0 Dec 01 -10 Dec 1 1-20 Dec 2 1-31 Jan 01 -10 Jan 1 1-20 Jan 2 1-31 Feb 01 -10 Feb 1 1-20 Feb 2 1-30 No v 01 -10 No v 1
1-20
No v 21-3
0 Dec 01 -10 Dec 1 1-20 Dec 2 1-31 Jan 01 -10 Jan 1 1-20 Jan 2 1-31 Feb 01 -10 Feb 1 1-20 Feb 2 1-3 0 Mar 01 -10 Mar 1 1-20
Table 1. Number of pods per plant (NPP), number of grains per pod (NGP), mass of one thousand grains (M1000) and grain yield of the stem and the branches of two soybean cultivars, in response to different plant spatial arrangements, 2013/2014 growing season.
Stem Branches
Total Yield (g∙plant–1)
NPP NGP M1000 (g) NPP NGP M1000 (g)
Cultivar (C)
BMX Potência RR 21.1 2.3 A 91.9 18.8 2.4 A2 83.6 8.32
BRS 359 RR 22.3 2.2 B 93.2 20.1 2.1 B 88.5 8.24
Row spacing, m (R)
0,2 22.1 2.4 88.3 24.6 A 2.3 82.1 9.29 A
0,2/0,8 21.6 2.2 95.1 24.2 A 2.2 88.2 9.33 A
0,5 22.2 2.2 95.0 15.2 B 2.2 88.9 7.54 AB
0,5 crossed 20.9 2.3 91.8 13.8 B 2.2 85.1 6.95 B
Seeding rate1 (S)
150 23.9 A2 2.3 92.9 38.6 A 2.3 86.4 12.7 A
300 22.3 A 2.2 91.8 13.7 B 2.2 87.1 7.09 B
450 18.9 B 2.2 93.0 6.2 C 2.3 84.7 5.03 C
Mean Squares
C 26.2ns 0.3* 27.4ns 29.2ns 1.35* 444.1* 0.1ns
R 6.6ns 0.1ns 184.7ns 589.6* 0.03ns 175.5ns 26.6*
S 158.2* 0.06ns 10.5ns 6898.7* 0.12ns 35.5ns 380.3*
C*R 66.5* 0.07ns 275.1* 31.0ns 0.06ns 292.6* 1.97ns
C*S 18.0ns 0.01ns 63.9ns 15.1ns 0.03ns 20.5ns 4.64ns
R*S 14.5ns 0.07ns 70.8ns 76.3ns 0.03ns 119.8ns 5.11ns
C*R*S 18.6ns 0.04ns 24.5ns 28.9ns 0.05ns 29.2ns 2.3ns
CV (%) 21.3 9.7 9.4 37.1 10.1 10.4 27.9
1Thousands of viable seeds.ha–1. 2Means followed by the same letter in the column do not differ statistically from each other by the Tukey test at 5% significance.
ns = not significant; * = Statistically significant at 5% significance.
cultivars. However, in the traditional spacing (0.5 m), BRS 359 RR had nearly 20% more pods in stems than BMX Potência RR (Table 2).
In GS2, there was interaction between cultivar and row spacing and between cultivar and seeding rate (Table 3). For BMX Potência RR, the twin-row spacing (0.2/0.8 m)
Table 2. Agronomic characteristics of soybeans influenced by the interaction between row spacing and cultivar, 2013/2014 growing season.
Cultivar Row Spacing (m) p-valor CV (%)
0.2 0.2/0.8 0.5 0.5 crossed
NPP-S
BMX Potência RR 23.66 Aa1 22.13 Aa 19.79 Ba 18.93 Aa
0.036 21.29
BRS 359 RR 20.59 Aa 21.16 Aa 24.69 Aa 22.90 Aa
M1000-S (g)
BMX Potência RR 90.25 Aa 96.65 Aa 88.58 Aa 92.25 Aa
0.019 9.39
BRS 359 RR 86.42 Ab 93.53 Aab 101.40 Aa 91.31 Aab
M1000-B (g)
BMX Potência RR 81.89 Aa 87.40 Aa 80.86 Ba 82.28 Aa
0.019 10.36
BRS 359 RR 82.27 Ab 88.91 Aab 96.96 Aa 87.93 Aab
NPP-S = Number of pods per plant of the stem; M1000-S = Mass of one thousand grains of the stem; M1000-B = Mass of one thousand grains of the branches.
1Means followed by the same letter, uppercase in the column and lowercase in the line, do not differ statistically from each other by the Tukey test, at 5% significance.
Table 3. Number of pods per plant (NPP), number of grains per pod (NGP), mass of one thousand grains (M1000) and grain yield of the mainstem and branches, in response to different plant spatial arragements, 2014/2015 growing season.
Stem Branches
Total Yield (g∙plant–1)
NPP NGP M1000 (g) NPP NGP M1000 (g)
Cultivar (C)
BMX Potência RR 29.8 2.48 118 B2 16.1 2.4 110 B 13.17 A
BRS 359 RR 18.7 2.52 161 A 10.9 2.4 153 A 12.05 B
Row spacing. m (R)
0.2 22.7 2.5 144 9.6 2.5 136 11.0 B
0.2/0.8 25.2 2.5 137 14.2 2.4 127 12.1 AB
0.5 23.5 2.5 139 16.3 2.4 132 13.5 A
0.5 crossed 25.6 2.5 141 13.9 2.4 133 13.9 A
Seeding rate1 (S)
150 29 2.6 A2 135 B 28.7 2.5 A 128 B 18.7 A
300 24.7 2.5 B 142 AB 8.7 2.4 AB 131 AB 11.4 B
450 19.1 2.5 B 143 A 3.1 2.3 B 137 A 7.7 C
Mean Squares
C 2233** 0.04ns 32776* 481.5** 0.06ns 32082** 22.8*
R 34.9ns 0.02ns 155.7ns 144.9** 0.04ns 243.2ns 30.9**
S 587.3** 0.10** 445.8** 4351.6** 0.13* 476.4** 744.3**
C*R 101.6* 0.04ns 127.5ns 32.9ns 0.01ns 83.6ns 13.5ns
C*S 90.6* 0.05ns 267.9ns 102.7** 0.06ns 66.3ns 3.3ns
R*S 15.1ns 0.03ns 25.0ns 78.8** 0.01ns 128.4ns 9.3ns
C*R*S 26.9ns 0.03ns 140.8ns 13.5ns 0.02ns 143.2ns 7.5ns
CV (%) 15 6.2 7.1 30.9 7.3 7.2 16.6
1Thousands of viable seeds.ha–1. 2Means followed by the same letter in the column do not differ statistically from each other by the Tukey test at 5% significance.
resulted in a higher NPP of stems than the others spacing patterns (Table 4). Yet, for BRS 359 RR, the crossed-row treatment presented a higher NPP of stems compared both to the narrow rows (0.2 m) and to the twin rows (0.2/0.8 m) (Table 4).
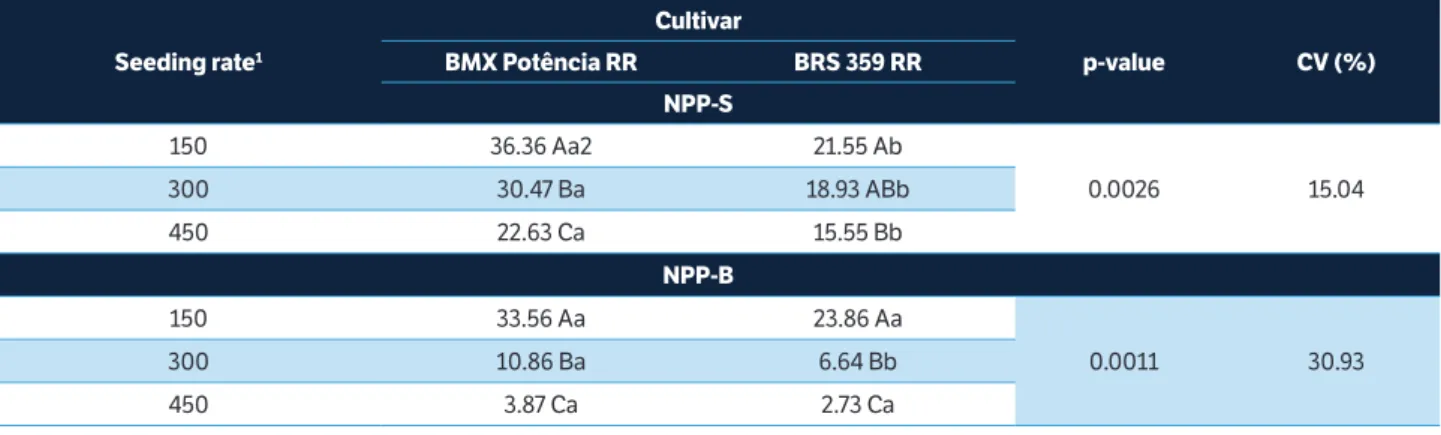
Also in GS2, interaction between cultivar and seeding rate was observed, wherein the NPP of stems reduced as the sowing rate was raised for BMX Potência RR (Table 5). Although the same behavior was noted for BRS 359 RR, SR2 showed no significant difference from the others. Even so, the reduction found for BRS 359 RR was of a lesser amplitude if compared to the findings of BMX Potência RR. At all seeding rates, BMX Potência RR produced a higher NPP of stems compared to BRS 359 RR (Table 5).
The reduction in the NPP of stem due to the increase in seeding rates, which occurred in the two growing seasons, shows that in high plant densities there is a reduction of pod production, and consequently of grain in the stem as a function of intraspecific competition. This finding corroborates the one reported by Norsworthy and Shipe (2005), who noted a 50% decrease in stem grain yield by raising plant density from 140 to 280 thousand plants.ha–1.
Both row spacing and seeding rate had an effect on the NPP of branches in GS1 (Table 1). Narrow rows (0.2 m) and twin rows (0.2/0.8 m) resulted in higher NPP of branches than did the other spacing patterns. As in stem, but at a higher magnitude, the increase in seeding rate reduced the NPP of branches in GS1 (Table 1). Clearly, NPP is the yield component most influenced by plant density, varying inversely with this factor (Ferreira et al. 2016).
Also for NPP, interaction was observed between cultivar and seeding rate, as well as between row spacing and seeding rate in GS2 (Table 3). As in the previous growing season, the increase in seeding rate drastically reduced the NPP of branches for both cultivars (Table 5). In this way, changes in plant density noticeably affect the grain yield of branches to the detriment of stems.
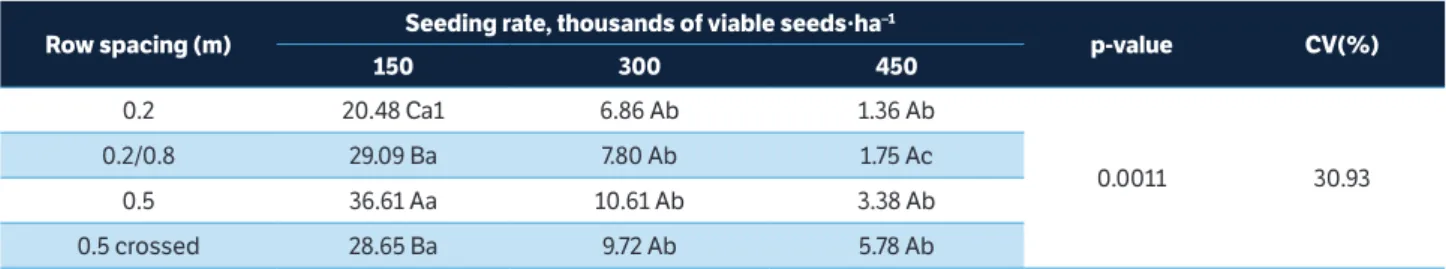
On the SR2 and SR3, there was no influence of row spacing patterns on the NPP of branches. However, on the SR1, narrow row (0.2 m) and traditional rows (0.5 m) produced the smallest and the biggest NPP of branches, respectively (Table 6). It can be observed that even at low plant densities, the spacing of 0.2 m had no effect on the pod production of branches, as already discussed by Procópio et al. (2014). In contrast, Balbinot Junior et al. (2015b) observed no reduction in the
Table 4. Number of pods per plant of the stem influenced by the interaction between cultivar and row spacing, 2014/2015 growing season.
Row Spacing (m) Cultivar p-value CV (%)
BMX Potência RR BRS 359 RR
0.2 28.87 Ba1 16.50 Bb
0.003 15.04
0.2/0.8 33.90 Aa 16.58 Bb
0.5 27.47 Ba 19.47 ABb
0.5 crossed 29.03 Ba 22.15 Ab
1Means followed by the same letter, uppercase in the column and lowercase in the line, do not differ statistically from each other by the Tukey test, at 5% significance.
Table 5. Agronomic characteristics affected by the interaction between seeding rates and cultivars, 2014/2015 growing season.
Seeding rate1
Cultivar
p-value CV (%)
BMX Potência RR BRS 359 RR
NPP-S
150 36.36 Aa2 21.55 Ab
0.0026 15.04
300 30.47 Ba 18.93 ABb
450 22.63 Ca 15.55 Bb
NPP-B
150 33.56 Aa 23.86 Aa
0.0011 30.93
300 10.86 Ba 6.64 Bb
450 3.87 Ca 2.73 Ca
NPP-S = Number of pods per plant of the stem; NPP-B = Number of pods per plant of the branches. 1Thousands of viable seeds∙ha–1. 2Means followed by the
NPP of branches as a function of decreasing row spacing associated with low seeding rates. Using the cultivar BMX Potência RR at the spacing patterns of 0.3, 0.45, and 0.6 m, those last authors verified only an isolated effect from the changes in seeding rate.
For all row spacing treatments, the increase in seeding rate significantly reduced the NPP of branches, evidencing a great influence of seeding rate on this yield component. In GS1, the factor cultivar had an influence on the NGP of both stem and branches. Between genotypes, BMX Potência RR produced a higher NGP both in stem and in branches (Table 1). According to Cox and Cherney (2011), the genotype has more influence on the NGP of soybeans than does the environmental conditions. In GS2, a slight increase in the seeding rate reduced the NGP in both stems and branches (Table 3). This might have occurred due to a greater intraspecific competition (Balbinot Junior et al. 2015b), albeit of little agronomic relevance for both stem and branches (0.1 and 0.2 grains per pod).
Also in GS1, an interaction between cultivar and row spacing was registered for M1000 of stem. At the traditional spacing, BRS 359 RR achieved the highest grain mass, although not statistically different from the twin and crossed row patterns (Table 2). Both stem and branch M1000 values were greater for the 0.50 m spacing when compared to the narrow row treatment in the BRS 359 RR. In this same growing season, M1000 was considerably lower due to the occurrence of water stress during the grain filling stage (Fig. 2a).
No interaction between the evaluated factors was observed for M1000 in GS2; however, isolated effects of cultivar and seeding rate were noticed (Table 3). On the average of all row spacing patterns, BRS 359 RR reached the largest M1000 of stems. For both, branches and stems, the higher NPP (29.8 and 16.1, respectively) and the lower M1000 values (118 and 110 g, respectively) of BMX Potência RR in GS2 (Table 3)
indicate that this cultivar had the grain filling more limited by edaphoclimatic conditions than BRS 359 RR.
For Procópio et al. (2013), the percentage of grains from branches is higher at lower plant densities with less demand for photoassimilates, compared to that of stems (Balbinot Junior et al. 2015b). This statement would justify the greatest M1000 values at higher seeding rates. On the other hand, in the present study, we verified a M1000 increase not only of branches but also of stem in GS2.
In GS1, an interaction between cultivar and row spacing was observed for M1000 of branches (Table 1). BMX Potência RR had no influence from row spacing. However, the traditional spacing had an effect on M1000 of BRS 359 RR, showing superior results compared to the other patterns, but with no statistical difference from the twin and crossed rows (Table 2).
In GS2, the M1000 of branches was influenced by cultivar and seeding rate (Table 3). BRS 359 RR had a higher grain mass than did BMX Potência RR, and the increase in seeding rate resulted in a larger M1000. Such increase associated with raising seeding rates corroborates the findings of Kuss et al. (2008) and Ferreira et al. (2016).
In both growing seasons, there was water deficit associated with elevated temperatures during the grain filling stage – in the second ten days of January and the second ten days of February (Figs. 1 and 2). Therefore, in the higher density of plants, soybean roots could have grown deeper during the vegetative phase due to an increased intraspecific competition, as discussed by Carlesso (1995), thus exploring a larger volume of soil during the water stress phase.
Furthermore, leaf area index and transpiration during the grain filling stage are poorly affected by plant density when climatic conditions during the vegetative phase had been suitable for soybean growth, given its phenotypic plasticity (Procópio et al. 2013). This assertion can be observed in our study during both growing seasons. Therefore, increasing
Table 6. Number of pods per plant from the branches influenced by the interaction between row spacing and seeding rate, 2014/2015 growing season.
Row spacing (m) Seeding rate, thousands of viable seeds∙ha
–1
p-value CV(%)
150 300 450
0.2 20.48 Ca1 6.86 Ab 1.36 Ab
0.0011 30.93
0.2/0.8 29.09 Ba 7.80 Ab 1.75 Ac
0.5 36.61 Aa 10.61 Ab 3.38 Ab
0.5 crossed 28.65 Ba 9.72 Ab 5.78 Ab
plant densities probably enhanced the efficiency of soil water exploration in depth and, on the other hand, the water consumption was little affected by this variable, as discussed by Ferreira et al. (2017), improving the water supply for plants grown at higher densities, culminating in a greater M1000 of both stem and branches.
In both growing seasons the row spacing influenced total grain production per plant (Tables 1 and 3). However, any of the alternative row spacing patterns were statistically higher than the traditional row spacing. On the other hand, the increase of seeding rate caused a significant reduction in grain production of each plant, which is associated with the phenotypic plasticity of the crop.
Regarding the share of branches in the total grain yield (%), row spacing and seeding rate played important roles in both growing seasons (Table 7). In GS1, the use of narrow and twin rows resulted in a lower share of production by
branches than the traditional row spacing. In GS2, only narrow rows showed a grain production less dependent on branches than the other spacing patterns. In addition, the share of branches in the grain production was drastically reduced by raising the seeding rate in both growing seasons.
The branching of soybean demonstrates its phenotypic plasticity in adapting to different spatial arrangements, mainly regarding changes in plant density (Cox et al. 2010; Norsworthy and Shipe 2005; Thompson et al. 2015, Werner et al. 2016). The low participation of branches in grain production for plants grown in narrow rows, regardless of seeding rate, is probably due to a rapid canopy closure during the vegetative development, providing an unfavorable environment for branching. Thus, production becomes more dependent on the stems. Likewise, Balbinot Junior et al. (2015b) observed changes in the participation of branches in grain production after reducing the spacing from 0.6 to 0.3 m.
The share of branches in grain production becomes relevant when smaller plant densities are associated with larger row spacing (Procópio et al. 2013). According to Norsworthy and Shipe (2005), the grain production of soybeans derives almost entirely from the stem when grown in 0.19-m row spacing at a rate of 432 thousand viable seeds∙ha–1. For these authors, the
ability to produce grains in stems should be considered as a criterion for the selection of cultivars for narrow row spacing.
Frederick et al. (2001) concluded that the contribution of the branch in the total grain yield of determinate-growth cultivars is more influenced by the water availability during the crop development if compared to that of stems. Thus, in growing seasons of little rainfall during crop development, the share of stem in the final production of grains increases to the detriment of branches.
Finally, it is important to point out that the use of cultivars of different relative maturity groups and at different sowing dates than those used in this study may present different responses. Generally, earlier cultivars with compact architecture and sowing in the beginning or closing seasons tend to present more responses to modifications in the spatial arrangement of plants.
CONCLUSION
The narrow row spacing reduces the production of pods and grains in branches in relation to the traditional row spacing.
Table 7. Percentage of grain yield from the branches (GYB) in response of different plant spatial arrangement, 2013/2014 and 2014/2015 growing seasons.
GYB (%)
2013/2014 2014/2015
Cultivar (C)
BMX Potência RR 38.3 27.9
BRS 359 RR 38.4 27.6
Row Spacing. m (R)
0.2 31.4 B2 21.5 B
0.2/0.8 33.0 B 30.2 A
0.5 43.6 A 29.8 A
0.5 crossed 45.4 A 29.5 A
Seeding Rate1 (S)
150 59.0 A 48.8 A
300 34.7 B 23.5 B
450 21.4 C 10.9 C
Mean Squares
C 0.06ns 1.39 ns
R 923.3* 315.5*
S 8749.3* 8950.2*
C*R 91.4ns 96.2ns
C*S 20.9ns 17.6ns
R*S 45.6ns 85.1ns
C*R*S 28.4ns 51.6ns
CV (%) 20.7 21.8
1Thousands of viable seeds∙ha–1. 2Means followed by the same letter in the
The number of grains per pod of stem and of branches is not altered by the changes in plant spatial arrangement.
The increase in seeding rate reduces the number of pods per plant of branches in greater magnitude than that of stems.
The rise in seeding rate results in larger thousand-grain mass both of branches and of stems, but varies with the growing season.
ORCID IDS
A. S. Ferreira
http://orcid.org/0000-0002-8224-9269
A. A. Balbinot Junior
http://orcid.org/0000-0003-3463-8152
F. Werner
http://orcid.org/0000-0001-5310-2279
C. Zucareli
http://orcid.org/0000-0002-5260-0468
Allen, R. G., Pereira, L. S., Raes, D. and Smith, M. (1998). Crop
evapotranspiration - guidelines for computing crop water
requirements. Rome: FAO.
Balbinot Junior, A. A., Procópio, S. O., Debiasi, H., Franchini, J. C.
and Panison, F. (2015a). Semeadura cruzada em cultivares de soja
com tipo de crescimento determinado. Semina: Ciências Agrárias,
36, 1215-1226. http://doi.org/10.5433/1679-0359.2015v36n3p1215
Balbinot Junior, A. A., Procópio, S. O., Costa, J. M., Kosinski, C. L.,
Panison, F., Debiasi, H. and Franchini, J. C. (2015b). Espaçamento
reduzido e plantio cruzado associados a diferentes densidades de
plantas de soja. Semina: Ciências Agrárias, 36, 2977-2986. http:// doi.org/10.5433/1679-0359.2015v36n5p2977
Balbinot Junior, A. A., Procópio, S. O., Neumaier, N., Ferreira, A.
S., Werner, F., Debiasi, H. and Franchini, J. C. (2016). Semeadura
cruzada, espaçamento entre fileiras e densidade de semeadura
influenciando o crescimento e a produtividade de duas cultivares
de soja. Revista de Ciências Agroveterinárias, 15, 83-93. http://doi. org/ 10.5965/223811711522016083
Bruns, H. A. (2011a). Planting date, rate and twin-row vs.
single-row soybean in the Mid-South. Agronomy Journal, 103, 1308-1313.
http://doi.org/10.2134/agronj2011.0076
Bruns, H. A. (2011b). Comparisons of single-row and twin-row
soybean production in the Mid-South. Agronomy Journal, 103,
702-708. http://doi.org/10.2134/agronj2010.0475
Carlesso, R. (1995). Absorção de água pelas plantas: água disponível
versus extraível e a produtividade das culturas. Ciência Rural, 25,
183-188. https://doi.org/10.1590/S0103-84781995000100035
REFERENCES
Cox, W. J. and Cherney, J. H. (2011). Growth and yield responses
of soybean to row spacing and seeding rate. Agronomy Journal,
103, 123-128. http://doi.org/10.2134/agronj2010.0316
Cox, W. J., Cherney, J. H. and Shields, E. (2010). Soybeans compensate
at low seeding rates but not at high thinning rates. Agronomy
Journal, 102, 1238-1243. http://doi.org/10.2134/agronj2010.0047
De Bruin, J. L. and Pedersen, P. (2008). Effect of row spacing and
seeding rate on soybean yield. Agronomy Journal, 100, 704-10.
http://doi.org/10.2134/agronj2007.0106
Fehr, W. R. and Caviness, C. E. (1977). Stages of soybean development.
Ames: Iowa State University. Special report 87.
Ferreira, A. S., Balbinot Junior, A. A., Werner, F., Zucareli, C., Franchini,
J. C. and Debiasi, H. (2016). Plant density and mineral nitrogen
fertilization influencing yield, yield components and concentration
of oil and protein in soybean grains. Bragantia, 75, 362-370. http:// dx.doi.org/10.1590/1678-4499.479
Ferreira, A. S., Zucareli, C., Balbinot Junior, A. A., Werner, F. and Coelho,
A. E. (2017). Size, physiological quality and green seed occurrence
influenced by seeding rate in soybeans. Semina Ciência Agrárias,
38, 595-606. http://doi.org/10.5433/1679-0359.2017v38n2p595
Frederick, J. R., Camp, C. R. and Bauer, P. J. (2001). Drought-stress
effects on branch and mainstem seed yield and yield components
of determinate soybean. Crop Science, 41, 759-763. http://doi.
org/10.2135/cropsci2001.413759x
Kuss, R. C. R., König, O., Dutra, L. M. C., Bellé, R. A., Roggia, S.
and Sturmer, G. R. (2008). Populações de plantas e estratégias
de manejo de irrigação na cultura da soja. Ciência Rural, 38,
Lee, C. D., Egli, D. B. and TeKrony, D. M. (2008). Soybean response
to plant population at early and late planting dates in the
Mid-South. Agronomy Journal, 100, 971-976. http://doi.org/10.2134/
agronj2007.0210
Lima, S. F., Alvarez, R. C. F., Theodoro, G. F., Bavaresco, M. and
Silva, K. S. (2012). Efeito da semeadura em linhas cruzadas sobre
a produtividade de grãos e a severidade da ferrugem asiática da
soja. Bioscience Journal, 28, 954-962.
Moreira, A., Moraes, L. A. C., Schroth, G. and Mandarino, J. M.
G. (2015). Effect of nitrogen, row spacing, and plant density on
yield, yield components, and plant physiology in soybean-wheat
intercropping. Agronomy Journal, 107, 2162-2170. http://doi.
org/10.2134/agronj15.0121
Norsworthy, J. K. and Shipe, E. R. (2005). Effect of row spacing
and soybean genotype on mainstem and branch yield. Agronomy
Journal, 97, 919-923. http://doi.org/10.2134/agronj2004.0271
Procópio, S. O., Balbinot Junior, A. A., Debiasi, H., Franchini, J. C.
and Panison, F. (2014). Semeadura em fileira dupla e espaçamento
reduzido na cultura da soja. Agro@mbiente online, 8, 212-221.
http://.doi.org/10.18227/1982-8470ragro.v8i2.1469
Procópio, S. O., Balbinot Junior, A. A., Debiasi, H., Santos J. C. S.
and Panison, F. (2013). Plantio cruzado na cultura da soja utilizando
uma cultivar de hábito de crescimento indeterminado. Revista
de Ciências Agrárias, 56, 319-325. http://dx.doi.org/10.4322/
rca.2013.048
Rambo, L., Costa, J. A., Pires, J. L. F., Parcianello, G. and Ferreira,
F. G. (2003). Rendimento de grãos da soja em função do arranjo
de plantas. Ciência Rural, 33, 405-411. http://dx.doi.org/10.1590/ S0103-84782003000300003
Soil Survey Staff (2010). Keys to soil taxonomy. Washington:
USDA/NRCS.
Suhre, J. J., Weidenbenner, N. H., Rowntree, S. C., Wilson, E. W.,
Naeve, S. L., Conley, S. P., Casteel, S. N., Diers, B. W., Esker, P. D.,
Specht, J. E. and Davis, V. M. (2014). Soybean yield partitioning
changes revealed by genetic gain and seeding rate interactions.
Agronomy Journal, 106, 1631-1642. http://doi.org/10.2134/
agronj14.0003
Thompson, N. M., Larson J. A., Lambert D. M., Roberts R. K.,
Mengistu A., Bellaloui N. and Eric R. Walker E. R. (2015).
Mid-South soybean yield and net return as affected by plant population
and row spacing. Agronomy Journal, 107, 979-989. http://doi.
org/10.2134/agronj14.0453
Thornthwaite, C. W. and Mather, J. R. (1955). The water balance.
Centerton: Drexel Institute of Technology – Laboratory of
Climatology.
Werner, F., Balbinot Junior, A. A., Ferreira, A. S., Silva, M. A. A.,
Debiasi, H. and Franchini, J. C. (2016). Soybean growth affected by
seeding rate and mineral nitrogen. Revista Brasileira de Engenharia
Agrícola e Ambiental, 20, 734-738. http://dx.doi.org/10.1590/1807-1929/agriambi.v20n8p734-738
Zhou, X. B., Chen, Y. H. and Ouyang, Z. (2015) Spacing between
rows: effects on water-use efficiency of double-cropped wheat
and soybean. The Journal of Agricultural Science, 153, 90-101.