Phenotypic plasticity in a soybean cultivar
with indeterminate growth type
Alvadi Antonio Balbinot Junior(1), Maria Cristina Neves de Oliveira(1), Julio Cezar Franchini(1),
Henrique Debiasi(1), Claudemir Zucareli(2), André Sampaio Ferreira(2) and Flavia Werner(2)
(1)Embrapa Soja, Rodovia Carlos João Strass, Distrito de Warta, Caixa Postal 231, CEP 86001-970 Londrina, PR, Brazil. E-mail: [email protected], [email protected], [email protected], [email protected] (2)Universidade Estadual de Londrina, Rodovia Celso Garcia Cid, PR-445, Km 380, Caixa Postal 6.001, CEP 86051-980 Londrina, PR, Brazil. E-mail:
[email protected], [email protected], [email protected]
Abstract – The objective of this work was to evaluate how branch and stem variables contribute to grain yield in individual soybean (Glycine max) plants, cultivated at different planting densities, in a modern cultivar with indeterminate growth type. A field experiment was carried out during the 2013/2014 and 2014/2015 crop seasons, in a randomized complete block design with 12 replicates, using the cultivar NK7059 RR at four planting densities: 135, 235, 315, and 440 thousand plants per hectare. Grain yield per plant was evaluated and represented phenotypic plasticity, while the number of branches per plant, percentage of grain production in branches, and separate yield components from branches and stems were considered as the independent variables. The number of pods in branches per plant was found to be the most important variable for soybean plasticity. In addition, the number of pods per plant on stems, number of branches per plant, and the percentage of grain production in branches were also associated with plasticity. Contrastingly, the number of grains per pod and the mass of a thousand grains in the branches and stems contributed little to plasticity in 'NK7059 RR' soybean.
Index terms: Glycine max, plant density, principal component analysis, stepwise regression, yield components.
Plasticidade fenotípica em cultivar de soja com
tipo de crescimento indeterminado
Resumo – O objetivo deste trabalho foi avaliar como variáveis relacionadas a ramos e hastes contribuem para a produção de grãos em plantas individuais de soja (Glycine max), cultivada a diferentes densidades de plantio, em uma cultivar moderna com tipo de crescimento indeterminado. Um experimento de campo foi realizado nas safras 2013/2014 e 2014/2015, em delineamento de blocos ao acaso, com 12 repetições, tendo-se utilizado a cultivar NK7059 RR, a quatro densidades de plantio: 135, 235, 315 e 440 mil plantas por hectare. A produção de grãos por planta foi avaliada e representou a plasticidade fenotípica, enquanto o número de ramos por planta, a percentagem da produção de grãos oriunda dos ramos e os componentes de rendimento oriundos dos ramos e das hastes, separadamente, foram considerados como variáveis independentes. O número de vagens por planta nos ramos foi a variável mais determinante da plasticidade da soja. Além disso, o número de vagens por planta nas hastes, o número de ramos por planta e a percentagem da produção de grãos oriunda dos ramos também estiveram associados à plasticidade. De forma contrastante, o número de grãos por vagem e a massa de mil grãos nos ramos e nas hastes contribuíram pouco para a plasticidade da soja 'NK7059 RR'.
Termos para indexação: Glycine max, densidade de plantas, análise de componentes principais, regressão stepwise, componentes de rendimento.
Introduction
Soybean [Glycine max (L.) Merrill] planting density alters the intraspecific competition for water, light, and nutrients, and may influence plant growth and architecture, phytosanitary management, and grain yield (Procópio et al., 2013; Ferreira et al., 2016; Werner
et al., 2013; Luca & Hungria, 2014; Suhre et al., 2014; Petter et al., 2016).
Most studies on this theme conducted in Brazil dealt with cultivars of determined growth type, which generally include plants with a high degree of branching and strong vegetative growth (Tourino et al., 2002; Rambo et al., 2004). However, most soybean cultivars released in the market over the last decade exhibits indeterminate growth type, with low branching and vegetative growth (Procópio et al., 2013, 2014; Werner et al., 2016). Nonetheless, recent studies show that modern cultivars continue to exhibit a high-phenotypic plasticity despite the morphophysiological changes, with little variation for yield even with significant changes in planting densities (Luca & Hungria, 2014; Balbinot Junior et al., 2015a, 2015b; Ferreira et al., 2016; Petter et al., 2016).
Soybean plants can compensate the low density of individuals by emitting more branches, increasing the growth of each branch, or even increasing the stem growth and yield (Ferreira et al., 2016). However, little is known as to the effects of the number of branches per plant, the percentage grain yield from branches, and the yield components evaluated separately for the branches and stems on the phenotypic plasticity of the crop.
In this context, a multivariate principal component analysis, using the GGE biplot program, can be a good tool for a joint evaluation of the influence of branch and stem variables on the plant ability to alter its grain yield, at different plant densities. The GGE biplot allows of the principal components to reduce the data size, and to generate a biplot chart which reports the contribution of the independent variables in conjunction. Furthermore, the stepwise regression analysis allows of the selection of independent variables that best explain the dependent variable.
The objective of this work was to evaluate the contribution of soybean plant branch and stem variables on the grain yield of individual plants, at different planting densities, using a modern cultivar with indeterminate growth type.
Materials and Methods
The experiment was carried out in the municipality of Londrina, in the state of Paraná, Brazil (23º11'S, 51º11'W, at 620 m altitude), during the 2013/2014 and
2014/2015 crop seasons. The climate of the region is classified as Cfa, according to the Köppen-Geiger’s climate scale.
The experimental area situated on a Rhodic Eutrudox soil, with the following properties at 0–20 cm soil depth, previously to the settlement of the experiment: 780 g kg-1 clay; 168 g kg-1 silt; 52 g kg-1 sand; 21.4 g dm3
soil organic carbon; pH in CaCl2 of 4.9, 8.6 mg dm-3 P
(Mehlich 1); 0.55 cmolc dm-3 exchangeable K; 3.7 cmolc
dm-3 exchangeable Ca; and 1.4 cmol
c dm-3 exchangeable
Mg.
The sequential climatological water balance (SCWB) of Thornthwaite & Mather (1955) is presented (Figure 1). Weather data were obtained at the agrometeorological station of Embrapa Soja, approximately 600 m apart from the experimental site. In order to determine the SCWB, the reference evapotranspiration (ETo) was calculated over 10-day periods using the Penman-Monteith equation, and transformed into soybean crop evapotranspiration (ETc), using the coefficient of culture (ETc = ETo × Kc) according to Allen et al. (1998). The available soil-water capacity for the SCWB calculation was 75 mm.
A randomized complete block design was used, with 12 replicates. Four plant densities were assessed: 135, 235, 315, and 440 thousand plants ha-1, spaced at
0.5 m between rows. The soybean cultivar NK7059 RR (Vmax RR) was used, which is of indeterminate growth type, of the relative maturity group of 5.9, and is of a compact architecture. Most soybean cultivars currently used in Brazil show these characteristics which are similar to NK7059 RR cultivar. The recommended density for this cultivar is 310–400 thousand plants ha-1.
Each experimental unit measured 5×5 m (length × width) and had 10 lines (total area = 25 m2), with
a useful area of 6 m2 (3 lines × 4 m). Seeding was
carried out on October 23, 2013, and on October 28, 2014, using a non-tillage seeder. Seed were treated with Vitavax-Thiram 200 SC (2 mL kg-1) and Gelfix 5
liquid inoculant (5x10⁹ colony forming units per mL),
using 1 mL kg-1. Fertilization was at 10 days before
sowing, with 350 kg ha-1 simple superphosphate and
250 kg ha-1 potassium chloride. Phytosanitary control
was done following the technical recommendations for the culture (Tecnologias…, 2011).
Figure 1. Sequential climatological water balance (mm) of Thornthwaite & Mather for a 10-day period, during the 2013/2014 and 2014/2015 crop seasons.
plant (GYP, in g plant-1), expressing the phenotypic
plasticity of soybean; number of branches per plant (NBP); number of pods per plant from branches (NPPB) and stems (NPPS); number of grains per pod from branches (NGPB) and stems (NGPS); mass of 1,000 grains from branches (MTGB) and stems (MTGS), expressed in grams; and percentage of grain yield from branches (PGYB).
All variables were tested for residue normality and independence, homogeneity of variances, and model nonadditivity. After detecting that there was a significant Pearson correlation among the variables, at 5% probability, the most relevant independent variables for GYP were defined using the principal component analysis (PCA), in the GGE biplot program. The obtained polygonal biplot with concentric circles was based on the singular value decomposition (SVD), which decomposes the matrix into singular values,
column eigenvectors, and line eigenvectors, and the singular value of the matrix is a diagonal matrix. The biplot is constructed with the principal component scores PC1, as the abscissa, and PC2 as the ordinate, for each treatment and each variable (Yan & Rajcan, 2002). The model considered for this statistics is expressed as:
T T
S
ij j
j
i j k j ij
−
=λ φ τ1 1 1+λ φ τ2 2 2+ε
in which: Tij is the mean value of the densities (i) for the
variable j; Tj is the average value of the variable j on the
general densities average; Sj are the singular values for the components PC1 and PC2; λ1 and λ2 is the standard
deviation of the variable j, among the average densities values; ϕilϕi2 are the PC1 and PC2 main component scores for the densities (i); τj1 and τj2 are the PC1 and PC2 scores associated with the variable j; and εij is the
residue of the model associated with the densities (i) in variable j.
The stepwise regression analysis was performed to determine the models with the highest predictive capacity for GYP. Pearson’s linear correlation, regression, and correlation analyses were performed using the SAS 9.2 program (SAS Institute Inc., Cary, NC, USA).
Results and Discussion
The water availability in the vegetative growth stage was adequate, in both cropping seasons, but water deficit periods occurred during the grain filling stage (Figure1). In the 2013/2014, the period of water deficit was greater, limiting the grain yield. In both cropping seasons, grain yield per plant (GYP) reduced with increasing plant densities (Figure2), showing the effects of intraspecific competition for water, light, and nutrients, as reported in other studies (Tourino et al., 2002; Rambo et al., 2004; Lee et al., 2008; Board & Kahlon, 2013; Procópio et al., 2013; Luca & Hungria, 2014; Petter et al., 2016).
At the lowest density, GYP was higher in the 2014/2015 crop season than in 2013/2014, probably due to the higher-water availability. However, at the densities 235, 315, and 440 thousand plants ha-1,
GYP at low densities, when there was a favorable water availability during the soybean development cycle.
According to Ferreira et al. (2016), the percentage of grain production in branches increases with decreasing plant densities. However, the demand for photoassimilates is lower in branches than in stems (Balbinot Junior et al., 2015b). Therefore, the severe water deficit observed in the 2013/2014 harvest compromised the grain filling, particularly at the lowest density, whereas the branches accounted for most of the grains due to their lower demand for photoassimilates. In this context, water deficit can expressively limit the phenotypic plasticity of soybean (McKenzie-Gopsill et al., 2016).
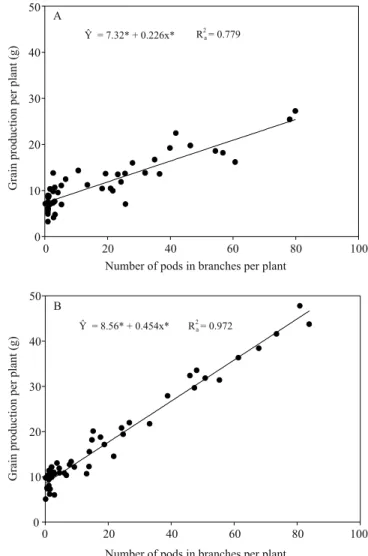
The stepwise regression analysis showed that, in both crop seasons, the number of pods per plant in branches (NPPB) was the variable with the greatest predictive capacity for GYP (Figure 3 and Table 1). The variation of that variable was able to explain 78% of the variation of GYP in 2013/014, and 97% in 2014/2015. In the first crop season, the coefficient of determination (R2
a) increased with the insertion
of number of pods per plant in stems (NPPS), mass of 1,000 grains in the stems (MTGS), and number of grains per pod in the stems (NGPS) in the model. Thus, in a crop season with severe water restrictions during the grain filling stage, the variation of stem-grain yield also contributed to the phenotypic plasticity of the crop. The same variables were checked in 2014/2015; their addition to the model did not contribute significantly
to , and NPPB alone explained the majority of variation in GYP (Table1).
The number of branches per plant (NBP) was not selected for inclusion in the model because its effects on GYP are confounded with those of the size of the branches (Balbinot Junior et al., 2015a). One of the main variables used to evaluate the phenotypic plasticity of the cultivars is NBP (Werner et al., 2016). However, the present study clearly indicates that it is a less relevant variable than NPPB.
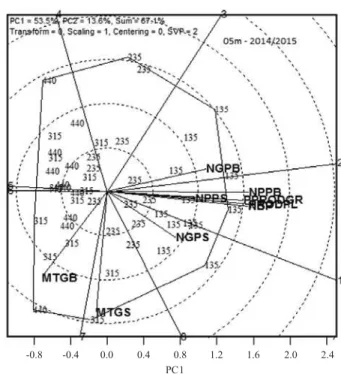
In both crop seasons, the variables most associated with GYP were NPPB, NPPS, NBP, and PGYB, whose vectors were long and close to that of the GYP, that
Figure 2. Grain yield per plant at different plant densities,
in the 2013/2014 and 2014/2015 crop seasons. *Significant
at 5% probability.
Table 1. Fitted models and coefficients of determination obtained from the stepwise analysis of grain yield per plant (GYP), as influenced by the number of pods per plant in branches (NPPB) and stems (NPPS), mass of 1,000 grains in stems (MTGS), and number of grain per pods in stems (NGPS), in the 2013/2014 and 2014/2015 crop seasons.
Model R2
a
2013/2014 crop season
GYP = 7.32** + 0.2265NPPB** 0.779
GYP = -0.66** + 0.1478NPPB** + 0.2608NPPS** 0.915
GYP = -8.18** + 0.1784NVPR** + 0.2551NPPS** +
0.0649MTGS** 0.943
GYP = -15.07** + 0.1842NPPB** + 0.2246NPPS** +
0.0637MTGS** + 4.0354NGPS** 0.970
2014/2015 crop season
GYP = 8.56** + 0.4545NPPB** 0.972
GYP = 1.14** + 0.4084NPPB** + 0.3478NPPS** 0.991
GYP = -13.23 + 0.4118NPPB** + 0.3496NPPS** +
0.0823MTGS** 0.992
GYP = -17.54** + 0.4037NPPB** + 0.3603NPPS** +
2.2925MTGS** + 0.0757NGPS** 0.994
**Significant at 1% probability.
represents the phenotypic plasticity (Figures4 and 5). Variables NGPB and NGPS contributed little to and are considerably far from GYP. As to MTGS and MTGB, both were opposite to GYP, with negative correlations between GYP and MTGB (-0.34* and -0.29*). These negative correlations were quite evident in the left-hand side of the polygonal biplot, confirming that the contribution of grain mass to phenotypic plasticity was rather small. Ferreira et al. (2016) reported that reduction of sowing density increased the GYP, and decreased the mass of 1,000 grains due to an increased percentage of grains from the branches that are less demanding for photoassimilates compared to stems. Kumagai et al. (2015) also reported that the number of pods per plant (stems and branches) was the main agronomic marker of the phenotypic plasticity in soybean cultivars, as it
Figure 4. GGE biplot vectors for the independent variables number of branches per plant (NBP), number of pods in branches per plant (NPPB), number of pods in stems per plant (NPPS), number of grains per pod in branches (NGPB), number of grains per pod in stems (NGPS), mass of a thousand grains in branches (MTGB), mass of a thousand grains in stems (MTGS), and percentage of grain yield in branches (PGYB), and the dependent variable,
grain yield per plant (GYP). The numbers in the figure refer
to four sowing densities: 135, 235, 315, and 440 thousand plantsha-1, in the 2013/2014 crop season.
Figure 5. GGE biplot vectors for the independent variables number of branches per plant (NBP), number of pods in branches per plant (NPPB), number of pods in stems per plant (NPPS), number of grains per pod in branches (NGPB), number of grains per pod in stems (NGPS), mass of a thousand grains in branches (MTGB), mass of a thousand grains in stems (MTGS), and percentage of grain yield in branches (PGYB), and the dependent variable,
grain yield per plant (GYP). The numbers in the figure refer
is highly influenced by the environment, and that the number of grains per pod and the grain mass did not vary with the production environment, as they are more dependent from genetic characteristics.
Therefore, the mechanisms of phenotypic plasticity in the modern soybean cultivar NK7059 RR, with indeterminate growth type and compact architecture, were the same in the two crop seasons. Such mechanisms showed different levels of water availability, although the grain yield per plant was different between seasons at the lowest-plant density.
Conclusions
1. The number of pods per plant in branches is the variable most associated with – and the best determinant of – the phenotypic plasticity, in a modern soybean cultivar with indeterminate growth type.
2. The principal component analysis indicates that the number of pods per plant in the branches and stems, the number of branches per plant, and the percentage of grain production from the branches are strongly associated with the soybean plant phenotypic plasticity.
3. The number of grains per pod and the mass of a thousand grains in the branches and stems contribute little to the plasticity.
Acknowledgments
To Conselho Nacional de Desenvolvimento Científico e Tecnológico (CNPq), for granting a productivity fellowship for technological development and innovative extension. This paper was approved for publication by the Editorial Board of Embrapa Soja as manuscript number 01/2017.
References
ALLEN, R.G.; PEREIRA, L.S.; RAES, D.; SMITH, M. Crop
evapotranspiration: guidelines for computing crop water
requirements. Rome: FAO, 1998. 300p. (FAO. Irrigation and
Drainage Paper, n. 56).
BALBINOT JUNIOR, A.A.; PROCÓPIO, S. de O.; COSTA, J.M.; KOSINSKI, C.L.; PANISON, F.; DEBIASI, H.; FRANCHINI, J.C. Espaçamento reduzido e plantio cruzado associados a diferentes densidades de plantas de soja. Semina: Ciências Agrárias, v.36, p.2977-2986, 2015a. DOI: 10.5433/1679-0359.2015v36n5p2977. BALBINOT JUNIOR, A.A.; PROCÓPIO, S. de O.; DEBIASI, H.; FRANCHINI, J.C.; PANISON, F. Semeadura cruzada
em cultivares de soja com tipo de crescimento determinado.
Semina: Ciências Agrárias, v.36, p.1215-1226, 2015b. DOI:
10.5433/1679-0359.2015v36n3p1215.
BOARD, J.E.; KAHLON, C.S. Morphological responses to low plant population differ between soybean genotypes. Crop Science, v.53, p.1109-1119, 2013. DOI: 10.2135/cropsci2012.04.0255.
DE BRUIN, J.L.; PEDERSEN, P. Effect of row spacing and seeding rate on soybean yield. Agronomy Journal, v.100, p.704-710, 2008. DOI: 10.2134/agronj2007.0106.
FERREIRA, A.S.; BALBINOT JUNIOR, A.A.; WERNER, F.; ZUCARELI, C.; FRANCHINI, J.C.; DEBIASI, H. Plant density and mineral nitrogen fertilization influencing yield, yield components and concentration of oil and protein in soybean grains. Bragantia, v.75, p.362-370, 2016. DOI: 10.1590/1678-4499.479.
KUMAGAI, E.; AOKI, N.; MASUYA, Y.; SHIMONO, H. Phenotypic plasticity conditions the response of soybean seed yield to elevated atmospheric CO2 concentration. Plant
Physiology, v.169, p.2021-2029, 2015. DOI: 10.1104/pp.15.00980.
LEE, C.D.; EGLI, D.B.; TEKRONY, D.M. Soybean response to plant population at early and late planting dates in the Mid-South. Agronomy Journal, v.100, p.971-976, 2008. DOI: 10.2134/ agronj2007.0210.
LUCA, M.J. de; HUNGRIA, M. Plant densities and modulation of symbiotic nitrogen fixation in soybean. Scientia Agricola, v.71, p.181-187, 2014. DOI: 10.1590/S0103-90162014000300002.
MCKENZIE-GOPSILL, A.G.; LUKENS, L.; LEE, E.; SWANTON, C.J. Does the presence of neighbouring weeds alter the expression of adaptive plasticity to subsequent drought stress in soybean? Field Crops Research, v.192, p.144-153, 2016. DOI: 10.1016/j.fcr.2016.04.029.
PETTER, F.A.; SILVA, J.A. da; ZUFFO, A.M.; ANDRADE, F.R.; PACHECO, L.P.; ALMEIDA, F.A. de. Elevada densidade de semeadura aumenta a produtividade da soja? Respostas da radiação fotossinteticamente ativa. Bragantia, v.75, p.173-183, 2016. DOI: 10.1590/1678-4499.447.
PROCÓPIO, S. de O.; BALBINOT JUNIOR, A.A.; DEBIASI, H.; FRANCHINI, J.C.; PANISON, F. Plantio cruzado na cultura da soja utilizando uma cultivar de hábito de crescimento indeterminado. Revista de Ciências Agrárias, v.56 p.319-325, 2013.
PROCÓPIO, S. de O.; BALBINOT JUNIOR, A.A.; DEBIASI, H.; FRANCHINI, J.C.; PANISON, F. Semeadura em fileira dupla e espaçamento reduzido na cultura da soja. Revista Agro@
mbiente, v.8, p.212-221, 2014.
RAMBO, L.; COSTA, J.A.; PIRES, J.L.F.; PARCIANELLO, G.; FERREIRA, F.G. Estimativa do potencial de rendimento por estrato do dossel da soja, em diferentes arranjos de plantas.
Ciência Rural, v.34, p.33-40, 2004. DOI:
10.1590/S0103-84782004000100006.
Received on January 23, 2017 and accepted on November 20, 2017
seeding rate interactions. Agronomy Journal, v.106, p.1631-1642, 2014. DOI: 10.2134/agronj14.0003.
TECNOLOGIAS de produção de soja – Região Central do Brasil 2012 e 2013. Londrina: Embrapa Soja, 2011. 261p.
THORNTHWAITE, C.W.; MATHER, J.R. The water balance. Centerton: Drexel Institute of Technology, Laboratory of Climatology, 1955. 104p. (Publications in Climatology, v. 8).
TOURINO, M.C.C.; REZENDE, P.M. de; SALVADOR, N. Espaçamento, densidade e uniformidade de semeadura na produtividade e características agronômicas da soja. Pesquisa
Agropecuária Brasileira, v.37, p.1071-1077, 2002. DOI: 10.1590/
S0100-204X2002000800004.
YAN, W.; RAJCAN, I. Biplot analysis of test sites and trait relations of soybean in Ontario. Crop Science, v.42, p.1120, 2002.
WERNER, F.; BALBINOT JUNIOR, A.A.; FERREIRA, A.S.; SILVA, M.A. de A. e; DEBIASI, H.; FRANCHINI, J.C. Soybean growth affected by seeding rate and mineral nitrogen. Revista
Brasileira de Engenharia Agrícola e Ambiental, v.20,

![Selection Indices in Indian Mustard [Brassica juncea (L.) Czern & Coss]](data:image/gif;base64,R0lGODlhAQABAIAAAP///wAAACH5BAEAAAAALAAAAAABAAEAAAICRAEAOw==)