ABSTRACT: Soybean suffers a serious blow to forage yield and quality while in intercropping with cereal forages like sorghum. The
aim of this field investigation was to optimize planting time and spatial
arrangement for boosting yield, quality and profitability of intercropped
soybean. Treatments included soybean sown 20 days before and after
sorghum under different spatial arrangements (3-1, 1-3, 2-3, 3-2 and
3-3 row proportions). The factorial arrangement was used to employ
randomized complete block design (RCBD) for experimental execution
with four replicates. Soybean sown 20 days prior to sorghum in 2-3 row
replacement series was effective in yielding the highest yield attributes
of soybean, which led to the highest green forage yield and dry matter
biomass. The same intercropping system proved to be superior in
generating the highest net income and benefit-cost ratio (BCR) (4.31).
CROP PRODUCTION AND MANAGEMENT - Article
Spatio-temporal reconciliation to lessen
losses in yield and quality of forage soybean
(
Glycine max
L.) in soybean-sorghum
intercropping systems
Muhammad Aamir Iqbal1*, Asif Iqbal2, Rana Nadeem Abbas2
1.The University of Poonch Rawalakot - Department of Agronomy - Rawalakot, Pakistan. 2.University of Agriculture Faisalabad - Department of Agronomy - Faisalabad, Pakistan.
*Corresponding author: [email protected]
Received: Feb. 8, 2017 – Accepted: May 29, 2017
Correlation analysis revealed a positive correlation between agronomic
variables under study and forage yield of soybean. Better quality forage
with significantly higher crude protein, ether extractable fat and ash
along with the lowest crude fiber content was given by soybean planted
20 days before sorghum in 3-2 row proportion. Soybean sown 20 days
after sorghum under all spatial arrangements did not perform at par
with soybean sown 20 days before sorghum. Thus, in order to avoid
the drastic effects of sorghum on soybean forage yield and quality in
soybean-sorghum intercropping systems, deferred sowing of sorghum
might be considered keeping in view the availability of irrigation water
and available time with respect of next crop.
INTRODUCTION
Skyrocketing demand for animal-based food and rising livestock population are making it pertinent to increase supplies of quality forage on sustainable basis. Cereal forages like sorghum can provide abundant quantities of green forage during summer months, but dairy animals fed on forage sorghum need protein and energy rich concentrates to make up for protein deficiency (Iqbal et al. 2015). Sorghum-soybean intercropping has been reported as one of the biologically and economically feasible options to increase the productivity and quality of forage. Soybean (Glycine max L.), also famous by the name of golden bean, has witnessed a long and steady history as a forage crop sown alone or in association with cereal forages until the trend shifted it to be grown as beans (Rao et al. 2005; Ghosh et al. 2006a). Soybean is a rich source of plant protein and its inclusion in animal’s feed reduces the need to supplement lactating animals with concentrates. Soybean, being a leguminous crop, has the ability to fulfill a greater proportion of nitrogen requirement through nitrogen fixation process, taking place in root nodules with the help of soil bacteria, namely,
Bradyrhizobium japonicum (Acikgoz et al. 2008). Fixed nitrogen not only improves vegetative growth of soybean but also gets transferred to cereal crops through roots intermingling in soybean based intercropping systems (Sheaffer et al. 2001).
However, soybean suffers a huge loss in forage yield and quality owing to shading effect rendered by cereal forages, including sorghum in soybean-cereals intercropping systems (Iqbal et al. 2016). Furthermore, the same pool of growth resources, including moisture and nutrients, is utilized by both component crops, especially at earlier growth stages, which results in sharp decline of their respective share (Ahmad et al. 2007). Nevertheless, in contrast to soybean, sorghum is expected to get advantage at latter growth stages, when the root nodules of soybean become fully functional and start fixing nitrogen, resultantly, sorghum can get more share of nitrogen from soil solution (Iqbal et al. 2015).
The type of intercropping (row replacement or mixed) could determine the productivity and performance of soybean based intercropping systems. Spatial arrangements could be another factor influencing the complementary or competitive nature of relationship among component
crops by affecting utilization efficacy of farm-applied resources as well as environmental resources, including solar radiation. Along with spatial arrangements, the same planting time of component crops was found to causes an increase in the degree of competition for growth resources, which ultimately led to significant reduction in the growth and development of component crops (Seiter et al. 2004; Agegnehu et al. 2006).
It was hypothesized that delaying the sowing of one of the component crops instead of their simultaneous sowing could increase forage yield. Furthermore, there was another hypothesis that certain spatial arrangements could reduce the drastic effects of sorghum on soybean forage in soybean-sorghum intercropping systems. Thus, the present study was aimed to lessen the losses in soybean forage yield and quality deterioration while in intercropping with forage sorghum through optimization of different spatial arrangements and sowing time. Another objective of this field trial was to increase the economic returns of soybean by increasing forage yield and benefit to cost ratio.
MATERIAL AND METHODS
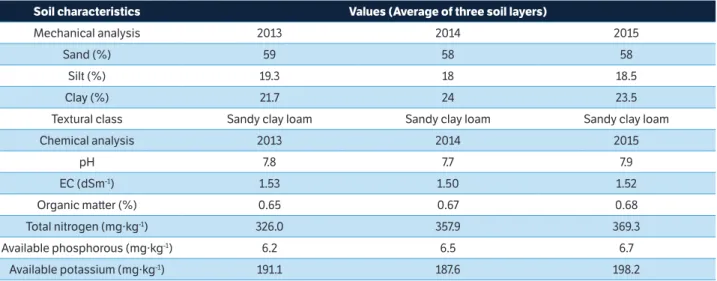
The experiment was conducted in Faisalabad (Pakistan) having soil of Aridisol-fine-silty, mixed, hyperthermic Ustalfic, Haplargid (USDA soil classification) and Haplic Yermosols (FAO classification scheme) (Naeem et al. 2013). Composite samples were prepared from subsamples collected from 30, 45 and 60 cm depth and then homogenized to determine the physico-chemical properties of the experimental soil for proper fertilization and to formulate appropriate agronomic management plan. Sandy clay loam was the textural class of the experimental soil and was severely deficient in nitrogen and phosphorous along with organic matter. The pH of the experimental soil remained between 7.7 – 7.9 during all three years (Table 1). The climate of experimental area is classified as semi-arid (Koppen-Geiger classification). The mean daily temperature remained 40.6 – 41.7 oC during the crop growing seasons, while total
There were two factors including two planting times (soybean planted 20 days before sorghum, soybean planted 20 days after sorghum) and five spatial arrangements (soybean-sorghum row proportions of 3-1, 1-3, 2-3, 3-2 and 3-3). In this way, experiment was comprised of total 10 treatments per experimental unit, while the number of experimental units was 40. The experiments were carried out in factorial arrangements of randomized complete block design (RCBD) with four replicates. The (net) plot size was kept at 6.0 × 4.0 meters, while there were 20 rows in each experimental unit.
The agronomic management plan was kept same for all experimental units. For proper seed bed preparation, a pre-sowing irrigation of 12 cm was given and when the soil had attained an appropriate moisture level, tractor mounted cultivator was used thrice for proper cultivation. Light planking followed each cultivation to achieve good soil tilth for appropriate soil-seed interaction. Soybean (cv. Ajmeri) was sown in association with forage sorghum (cv. JS-2002) using a seed rate of 100 kg.ha–1, while the
seed rate of sorghum was 75 kg.ha–1. Seeds were treated
with fungicide (benlate at the rate of 2 g.kg–1 of seed)
to avoid the occurrence of fungal attack. The sowing of soybean was done with the help of a single row cotton drill in 30 cm spaced rows, while no consideration was given to plant-to-plant distance. Single super phosphate [Ca (H2PO4)2 + CaSO4] was used as the source of
phosphorous and was applied at the rate of 60 kg.ha-1 in
a single dose at the time of sowing, while nitrogen was applied in the form of urea [(NH2)2 CO] at the rate of
80 kg.ha-1 in two equal splits. Three irrigations (3 acre
inches each) through flood irrigation were applied at second trifoliate, fifth trifoliate and flower initiation growth stages of soybean. Weed infestation was kept below threshold level by three manual hoeing at 10, 22 and 36 days after sowing. Soybean was harvested at 50% flowering stage with the help of hand sickle.
Ten randomly selected plants from each replication were used to record experimental variables and then average of four replications was used to statistically analyze and interpret the recorded data. Plant height of soybean was recorded from base to top and was averaged. Stem girth
Soil characteristics Values (Average of three soil layers)
Mechanical analysis 2013 2014 2015
Sand (%) 59 58 58
Silt (%) 19.3 18 18.5
Clay (%) 21.7 24 23.5
Textural class Sandy clay loam Sandy clay loam Sandy clay loam
Chemical analysis 2013 2014 2015
pH 7.8 7.7 7.9
EC (dSm-1) 1.53 1.50 1.52
Organic matter (%) 0.65 0.67 0.68
Total nitrogen (mg·kg-1) 326.0 357.9 369.3
Available phosphorous (mg·kg-1) 6.2 6.5 6.7
Available potassium (mg·kg-1) 191.1 187.6 198.2
Table 1. Pre-sowing physico-chemical analysis of experimental soil (Faisalabad, Pakistan) from composite samples taken at 30, 45 and 60 cm depth, in 2013, 2014 and 2015.
Month Precipitation (mm) Temperature (
oC) Relative humidity (%)
2013 2014 2015 10YsM 2013 2014 2015 10YsM 2013 2014 2015 10YsM
May 40 31 27 33.5 38.5 39.7 39.1 38 64 59 61 60
June 30 21 24 23.3 41.0 41.5 42.4 40.1 57 62 60 64
July 104 98 90 90.9 42.4 43 43.7 40.9 71 68 65 69
was also recorded from three points including base, mid and top of the stem with the help of vernier caliper and then their average was taken for statistical analysis. Crude protein, crude fiber, either extractable fat and total ash of soybean forage were also determined using standard techniques as prescribed by AOAC (2000). To determine the economic feasibility of soybean based intercropping systems, partial budgeting technique was used. As soybean was sown as a component crop with forage sorghum, thus only half of the fixed costs and full of variable costs were counted for soybean. Gross income was computed by multiplying forage yield (t.ha–1) with
local market rate (US$.ton–1) of forage. Net income was
determined by deducting the total expenditure from the gross income. Benefit to cost ratio (BCR) was also calculated to determine economic returns by using the Eq. 1 (CIMMYT 1988):
RESULTS AND DISCUSSION
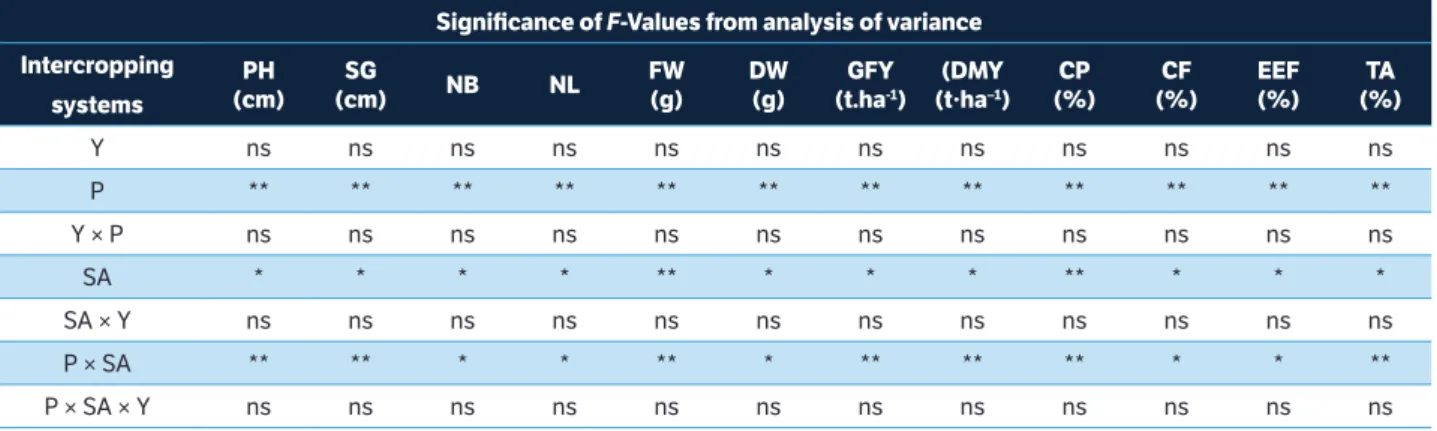
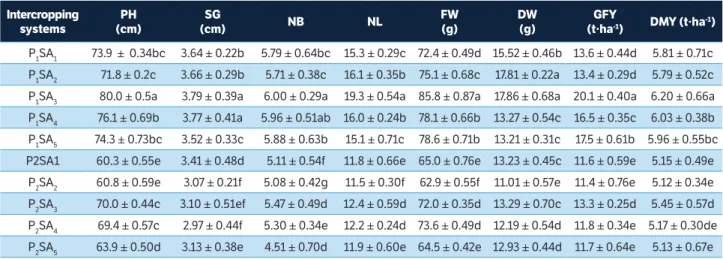
All intercropping systems significantly affected yield components and forage yield of soybean sown with forage sorghum under different planting times and spatial arrangements during all three years. All agronomic experimental variables underwent a significant influence of planting time (p ≤ 0.01) and spatial arrangements (p ≤ 0.05) (Table 3). Plant height and stem girth are important yield components and contribute positively towards green forage yield of soybean. Soybean sown 20 days before sorghum in 2-3 row proportion (P1SA3)
resulted in the tallest soybean plants (80.0 cm) with the highest stem girth (3.79 cm) along with yielding the greatest number of leaves (19.3) and branches (6.00) per plant (Table 4).
Deferred sowing of soybean for 20 days under all spatial arrangements caused a significant reduction of growth parameters, while the minimum growth was registered for soybean planted 20 days after sorghum in 1-3 row replacement series (P2SA2). Furthermore, green
forage yield was found to have linear relation with plant height (Figure 1a) and stem girth (Figure 1b) of soybean. These results are in contradiction with those of Addo et al. (2011), who reported that spatial patterns and time of planting were determining factors in maize-soybean intercropping systems. But it was also concluded that components crops needed to be sown at the same time in order to take the full benefit of intercropping. However, field studies conducted by Dapaah et al. (2003) reported that soybean growth was negatively affected in intercropping with (1)
BCR = Gross income / Total cost
Data for all experimental variables under study were subjected to analysis of variance (ANOVA) using the computer based statistical program SAS 9.5. The F-test was employed to determine the effects of planting time (P), spatial arrangements (SA) and year (Y), along with their interactive effects (P × SA, P × Y, SA × Y, P × SA × Y) at 5% and 1% probability levels. Duncan’s multiple range test (p ≤ 0.05) was used to separate treatment means and correlation analysis was also performed in order to establish the nature of relationship (linear or inverse) between growth parameters and green forage yield of soybean.
Significance of F-Values from analysis of variance
Intercropping systems
PH (cm)
SG
(cm) NB NL
FW (g)
DW (g)
GFY
(t.ha-1)
(DMY
(t·ha–1)
CP (%)
CF (%)
EEF (%)
TA (%)
Y ns ns ns ns ns ns ns ns ns ns ns ns
P ** ** ** ** ** ** ** ** ** ** ** **
Y × P ns ns ns ns ns ns ns ns ns ns ns ns
SA * * * * ** * * * ** * * *
SA × Y ns ns ns ns ns ns ns ns ns ns ns ns
P × SA ** ** * * ** * ** ** ** * * **
P × SA × Y ns ns ns ns ns ns ns ns ns ns ns ns
Table 3. Analysis of variance for agronomic variables and agro-qualitative attributes of forage soybean at harvest as influenced by different planting times and spatial arrangements (pooled data of 2013, 2014 and 2015 with combined analysis).
.
Intercropping systems
PH (cm)
SG
(cm) NB NL
FW (g)
DW (g)
GFY
(t·ha-1) DMY (t·ha-1)
P1SA1 73.9 ± 0.34bc 3.64 ± 0.22b 5.79 ± 0.64bc 15.3 ± 0.29c 72.4 ± 0.49d 15.52 ± 0.46b 13.6 ± 0.44d 5.81 ± 0.71c
P1SA2 71.8 ± 0.2c 3.66 ± 0.29b 5.71 ± 0.38c 16.1 ± 0.35b 75.1 ± 0.68c 17.81 ± 0.22a 13.4 ± 0.29d 5.79 ± 0.52c
P1SA3 80.0 ± 0.5a 3.79 ± 0.39a 6.00 ± 0.29a 19.3 ± 0.54a 85.8 ± 0.87a 17.86 ± 0.68a 20.1 ± 0.40a 6.20 ± 0.66a
P1SA4 76.1 ± 0.69b 3.77 ± 0.41a 5.96 ± 0.51ab 16.0 ± 0.24b 78.1 ± 0.66b 13.27 ± 0.54c 16.5 ± 0.35c 6.03 ± 0.38b
P1SA5 74.3 ± 0.73bc 3.52 ± 0.33c 5.88 ± 0.63b 15.1 ± 0.71c 78.6 ± 0.71b 13.21 ± 0.31c 17.5 ± 0.61b 5.96 ± 0.55bc
P2SA1 60.3 ± 0.55e 3.41 ± 0.48d 5.11 ± 0.54f 11.8 ± 0.66e 65.0 ± 0.76e 13.23 ± 0.45c 11.6 ± 0.59e 5.15 ± 0.49e
P2SA2 60.8 ± 0.59e 3.07 ± 0.21f 5.08 ± 0.42g 11.5 ± 0.30f 62.9 ± 0.55f 11.01 ± 0.57e 11.4 ± 0.76e 5.12 ± 0.34e
P2SA3 70.0 ± 0.44c 3.10 ± 0.51ef 5.47 ± 0.49d 12.4 ± 0.59d 72.0 ± 0.35d 13.29 ± 0.70c 13.3 ± 0.25d 5.45 ± 0.57d
P2SA4 69.4 ± 0.57c 2.97 ± 0.44f 5.30 ± 0.34e 12.2 ± 0.24d 73.6 ± 0.49d 12.19 ± 0.54d 11.8 ± 0.34e 5.17 ± 0.30de
P2SA5 63.9 ± 0.50d 3.13 ± 0.38e 4.51 ± 0.70d 11.9 ± 0.60e 64.5 ± 0.42e 12.93 ± 0.44d 11.7 ± 0.64e 5.13 ± 0.67e Table 4. Agronomic variables of forage soybean at harvest as influenced by different planting times and spatial arrangements (pooled data of 2013, 2014 and 2015 with combined analysis).
.
*Significant at 0.05 level, ** Significant at 0.01 level, NS = Non-significant. PH = Plant Height, SG = Stem Girth, NB = Number of Branches per plant, NL = Number of Leaves per plant, FW = Fresh Weight, DW = Dry Weight, GFY = Green Forage Yield, DMY = Dry Matter Yield. P1 = Soybean sown 20 days before sorghum, P2 = Soybean sown 20 days after sorghum, SA1 = Soybean-sorghum sown in 3-1 row proportion, SA2 = Soybean-sorghum sown in 1-3 row proportion, SA3 = Soybean-sorghum sown in 2-3 row proportion, SA4 = Soybean-sorghum sown in 3-2 row proportion, SA5 = Soybean-sorghum sown in 3-3 row proportion.
Figure 1. Correlation analysis for (a) plant height and green forage yield, (b) stem girth and green forage yield, (c) fresh weight per plant and green forage yield, (d) dry weight per plant and dry matter yield of soybean sown with sorghum under different planting times and spatial arrangements (pooled data of 2013, 2014 and 2015 with combined analysis).
Plant height (cm) 60
16 19 22 25
16 19 22 25
70 80 90
60 70 80 90
2,8 3,2 3,6 4
16 19 22 25
5 6,5 8 9,5
100 110 120 130 140
Stem girth (cm)
Fresh weight per plant (g) y = 0.1766x + 0.8847
R2 = 0.9616
y = 0.1847x + 0.041
R2 = 0.98963
y = 4.983x + 2,7346
R2 = 0.55001
y = 0.3248x + 3.8881
R2 = 0.8833
Dry weight per plant (g)
Gr
een f
or
age yield (t·ha
–1)
Dry ma
er yield (t·ha
–1)
Gr
een f
or
age yield (t·ha
–1)
Gr
een f
or
age yield (t
·ha
–1) (a)
(c)
(b)
cereal forages due to higher population pressure over limited growth resources. It was further revealed that plant height and stem girth were found to have direct relationship with green forage yield of soybean as comparatively higher green forage yield of soybean was recorded in plots where there were significantly taller soybean plants with higher stem girth. These findings also closely corroborate with the conclusions made by Arshad et al. (2006), who stated that sole cultivation of soybean resulted in better growth and development of soybean plants, which resulted in increased yield. However, in our research, earlier sowing of soybean for 20 days and 2-3 row proportion of soybean-sorghum provided soybean more space and reduced the shading effect, which led to better growth and development of soybean.
Earlier sowing of soybean gave higher fresh weight (130.7 g) and dry weight (41.1 g) per plant, which led to significantly higher green forage yield and dry matter biomass, while delayed sowing of soybean witnessed a considerable reduction in green forage yield and dry matter. It was further revealed that fresh weight (Figure 1c) and dry weight (Figure 1d) per plant of soybean were linearly correlated with green forage yield and dry matter biomass, respectively. Gare et al. (2009) and Hintz and Albrecht (1994) also reported the same findings, where dry weight per plant of soybean was proved to be a reliable indicator for projecting dry matter yield of soybean, as dry matter biomass was increased with increasing dry weight per plant and same was found to be true for intercrops.
The performance of forage component crops in cereal-legumes intercropping systems is reflected by biomass production on per unit basis. Soybean recorded the highest green forage yield (20.1 t.ha–1) and dry matter yield (6.2 t.ha–1)
(Table 4), when it was sown in 2-3 row proportion and sorghum planting was deferred for 20 days (P1SA3). Earlier
sowing of soybean for 20 days in 3-2 row replacement series followed this intercropping system, while soybean sown 20 day after sorghum in 1-3 row replacement series (P2SA2) yielded the lowest green forage yield and
dry matter yield of soybean. Soybean sowing in 2-3 row replacement series and deferred sowing of sorghum for 20 days recorded the highest yield components, like plant height, stem girth, number of branches and leaves per plant, along with the highest fresh weight and dry weights per plant of soybean, which ultimately led to significantly higher green forage yield and dry matter yield of soybean. Soybean intercropping with cereal forages at the same time
might result in increased population pressure on divisible moisture and nutrients pool, and ultimately decreased share of vital growth inputs, resulting in decreased forage yield of soybean soybean-sorghum intercropping systems (Li et al. 2001). Prior field investigation of Dapaah et al. (2003) also confirm these findings as they also found that yield stability of component crops, including soybean, hit a setback while in intercropping with cereal forages in comparison with their sole sowing because of severed soil-supplied resources along with shading effect of taller cereal plants.
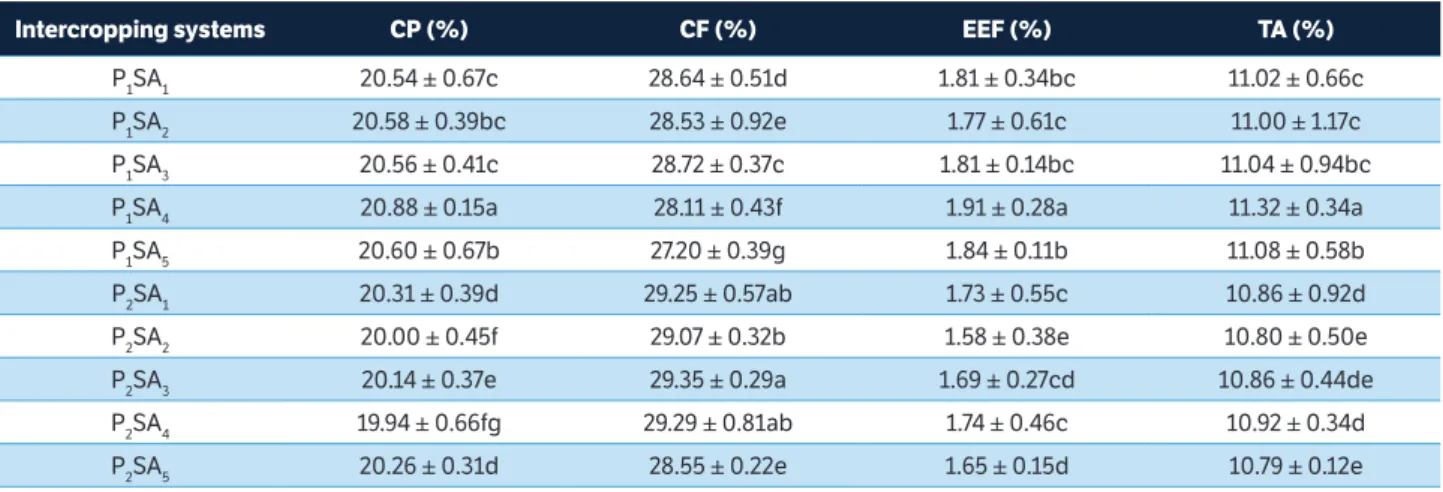
One of the major objectives of cereal-legumes intercropping systems is the enhancement of forage quality, particularly protein content, therefore, it is pertinent to monitor and analyze quality attributes of legumes in intercropping systems. Soybean sown 20 days prior to sorghum in 3-2 row replacement series (P1SA4) remained outstanding in terms of crude protein
contents (20.88%), along with highest ether extractable fat (1.91%) and ash (11.32%) (Table 5), and it was closely followed by soybean sown 20 days prior to sorghum in
3-3 row proportion (P1SA5). The same intercropping
system (P1SA4) was effective in decreasing the crude
fiber contents (28.11%), while soybean sown 20 days after sorghum in 1-3 row replacement series (P2SA2)
As all the farming operations and activities revolve around economics and same is the matter of forage production, thus economic analysis is of utmost importance in order to analyze the productivity and profitability of soybean based intercropping systems. The highest net income and benefit-cost ratio was rendered by soybean sown 20 days prior to sorghum in 2-3 row replacement series which, was followed by soybean planted 20 days before sorghum in 3-2 row replacement series, which in turn was followed by soybean sown 20 days prior to sorghum in 3-3 row ratio (Table 6). Soybean sown 20 days after sorghum in 3-1 row replacement series recorded the lowest BCR of 2.84 (Table 6). Prior research findings reported by Mucheru-Muna et al. (2010) also support our
research results where legumes yield and economic returns witnessed a significant decline when cereal and legumes were intercropped at the same time under different spatial arrangements. It was also reported similar findings where yield of component crops were decreased in cereal-legumes intercropping systems but overall productivity per unit land area was increased to a great extent and ultimately net income and BCR were increased.
Thus, the findings of this research offer a feasible, eco-friendly and economical solution to increase the share of soybean in soybean-sorghum intercropping systems by deferring the sowing of forage sorghum for 20 days. This research might be applicable to other legumes intercropped with cereal forages for reducing
.
*Significant at 0.05 level, ** Significant at 0.01 level, NS = Non-significant, CP = Crude Protein, CF = Crude Fiber, EEF = Ether Extractable Fat, TA = Total Ash. P1 = Soybean sown 20 days before sorghum, P2 = Soybean sown 20 days after sorghum, SA1 = Soybean-sorghum sown in 3-1 row proportion, SA2 = Soybean-sorghum sown in 1-3 row proportion, SA3 = Soybean-sorghum sown in 2-3 row proportion, SA4 = Soybean-sorghu sown in 3-2 row proportion, SA5 = Soybean-sorghum sown in 3-3 row proportion.
Table 5. Agro-qualitative attributes of forage soybean at harvest as influenced by different planting times and spatial arrangements (pooled data of 2013, 2014 and 2015 with combined analysis).
Intercropping systems CP (%) CF (%) EEF (%) TA (%)
P1SA1 20.54 ± 0.67c 28.64 ± 0.51d 1.81 ± 0.34bc 11.02 ± 0.66c
P1SA2 20.58 ± 0.39bc 28.53 ± 0.92e 1.77 ± 0.61c 11.00 ± 1.17c
P1SA3 20.56 ± 0.41c 28.72 ± 0.37c 1.81 ± 0.14bc 11.04 ± 0.94bc
P1SA4 20.88 ± 0.15a 28.11 ± 0.43f 1.91 ± 0.28a 11.32 ± 0.34a
P1SA5 20.60 ± 0.67b 27.20 ± 0.39g 1.84 ± 0.11b 11.08 ± 0.58b
P2SA1 20.31 ± 0.39d 29.25 ± 0.57ab 1.73 ± 0.55c 10.86 ± 0.92d
P2SA2 20.00 ± 0.45f 29.07 ± 0.32b 1.58 ± 0.38e 10.80 ± 0.50e
P2SA3 20.14 ± 0.37e 29.35 ± 0.29a 1.69 ± 0.27cd 10.86 ± 0.44de
P2SA4 19.94 ± 0.66fg 29.29 ± 0.81ab 1.74 ± 0.46c 10.92 ± 0.34d
P2SA5 20.26 ± 0.31d 28.55 ± 0.22e 1.65 ± 0.15d 10.79 ± 0.12e
Intercropping systems Total expenditures
(Fixed + Variable) (US$)
Gross income (US$)
Net income
(US$) BCR
P1SA1 = Soybean sown 20 days before sorghum in 3-1 row proportion 137+45=182 642.35 460.00 3.52
P1SA2 = Soybean sown 20 days before sorghum in 1-3 row proportion 137+15=152 608.70 456.70 4.00
P1SA3 = Soybean sown 20 days before sorghum in 2-3 row proportion 137+24=161 694.82 533.80 4.31
P1SA4 = Soybean sown 20 days before sorghum in 3-2 row proportion 137+36=173 669.90 496.90 3.87
P1SA5 = Soybean sown 20 days before sorghum in 3-3 row proportion 137+30=167 639.00 472.00 3.82
P2SA1 = Soybean sown 20 days after sorghum in 3-1 row proportion 137+45=182 517.80 335.80 2.84
P2SA2 = Soybean sown 20 days after sorghum in 1-3 row proportion 137+15=152. 504.00 352.00 3.31
P2SA3 = Soybean sown 20 days after sorghum in 2-3 row proportion 137+24=161 552.30 391.30 3.43
P2SA4 = Soybean sown 20 days after sorghum in 3-2 row proportion 137+36=173 528.13 355.00 3.05
the drastic effects of dominant cereals on leguminous forages. Furthermore, these findings will be beneficial to other researchers as a reference and will explore new research horizons in cereal-legumes intercropping for obtaining higher productivity and quality of mixed forage in comparison with their sole cropping. As in our study, though deferred sowing of sorghum for 20 days proved to be effective in increasing soybean productivity, there is a need to test earlier sowing of soybean for lesser or greater than 20 days along with other row replacement series, which might be useful in getting even higher productivity and profitability.
CONCLUSION
It was hypothesized that losses in forage yield and quality deterioration of soybean in soybean-sorghum intercropping systems might be avoided by varying planting time of component crops and by optimizing spatial arrangements. We were successful to a great extent as soybean yielded reasonably higher green forage yield with improved quality
attributes when sorghum sowing was deferred for 20 days and 2-3 row replacement series was adopted for soybean and sorghum intercropping. The same planting time and spatial arrangement was instrumental in generating the highest net income and benefit-cost ratio (BCR), while deferred sowing of soybean for 20 days reduced forage yield along with net income and BCR under all spatial arrangements. Thus, if irrigation water is available or soil moisture conditions in arid areas may support delayed sowing of sorghum then soybean earlier sowing has the potential to increase its share in mixed forage, which is bound to increase quality traits of mixed forage.
ORCID IDs
M. A. Iqbal
https://orcid.org/0000-0003-2701-0551
A. Iqbal
https://orcid.org/0000-0001-8884-2648
R. N. Abbas
https://orcid.org/0000-0001-7255-5919
Acikgoz, E., Sincik, M., Karasu, A., Tongel, O., Wietgrefe, G., Bilgili,
U., Oz, M., Albayrak, S., Turan, Z. and Goksoy, A. (2008). Forage
soybean production for seed in Mediterranean environments.
Field Crops Research, 110, 213-218. http://dx.doi.org/10.1016/j.
fcr.2008.08.006.
Addo, Q. A., Darkwa, A. and Ocloo, G. K. (2011). Growth analysis
of component crops in a maize-soybean intercropping system as
affected by time of planting and spatial arrangement. ARPN Journal
of Agriculture and Biological Sciences, 6, 34-44.
Agegnehu, G., Ghizaw, A. and Sinebo, W. (2006). Yield performance
and land-use efficiency of barley and faba bean mixed cropping
in Ethiopian highlands. European Journal of Agronomy, 25,
202-207. http://dx.doi.org/10.1016/j.eja.2006.05.002.
Ahmad, A. H., Ahmad, R. and Mahmood, N. (2007). Production
potential and quality of mixed sorghum forage under different
intercropping systems and planting patterns. Pakistan Journal of
Agricultural Sciences, 44, 87-93.
REFERENCES
Arshad, M., Ali, N. and Ghafoor, A. (2006). Character correlation
and path coefficient in soybean (Glycine max (L) Merrill). Pakistan Journal of Botany, 38, 121-130.
AOAC. (2000). Official Methods of Analysis. 17. ed. Gaithersburg,
Maryland, USA.
CIMMYT. (1988). From Agronomic Data to Farmer Recommen-
dations, An Economics Training Manual. Completely revised
edition, Mexico D.F.
Dapaah, H. K., Asafu-Agyei, J. N., Ennin, S. A. and Yamoah, C.
(2003). Yield stability of cassava, maize, soya bean and cowpea
intercrops. Journal of Agricultural Sciences 140, 73-80. http://
dx.doi.org/10.1017/S0021859602002770.
Gare, B. N., More, S. M., Burli, A. V. and Dodake, S. S. (2009).
Evaluation of yield stability in soybean based intercropping system
under rainfed agriculture. Indian Journal of Dryland Agriculture and
Ghosh, P. K., Mannab, M. C., Bandyopadhyay, K. K., Ajay, T. A. K.,
Wanjari, R. H., Hati, K. M., Misra, A. K., Acharyab, C. L. and Rao, A.
S. (2006a). Interspecific interaction and nutrient use in soybean/
sorghum intercropping system. Agronomy Journal, 98, 1097-1108.
http://dx.doi.org/10.2134/agronj2005.0328.
Ghosh, P. K., Mohanty, M., Bandyopadhyay, K. K., Painuli, D. K. and
Misra, A. K. (2006b). Growth, competition, yields advantage and
economics in soybean/pigeonpea intercropping system in semi-arid
tropics of India: II. Effect of nutrient management. European Journal
of Agronomy, 96, 90-97. http://dx.doi.org/10.1016/j.fcr.2005.05.010.
Ghosh, P. K., Tripathi, A. K., Bandyopadhyay, K. K. and Manna, M. C.
(2009). Assessment of nutrient competition and nutrient requirement
in soybean/sorghum intercropping system. European Journal of
Agronomy, 31, 43-50. http://dx.doi.org/10.1016/j.eja.2009.03.002.
Hintz, R. and Albrecht, K. (1994). Dry matter partitioning and forage
nutritive value of soybean plant components. Agronomy Journal,
86, 59-62. http://dx.doi.org/10.2134/agronj1994.000219620086
00010011x.
Iqbal, M. A., Iqbal, A., Akbar, N., Khan, H. Z. and Abbas, R. N.
(2015). A study on feed stuffs role in enhancing the productivity of
milch animals in Pakistan- Existing scenario and future prospect.
Global Veterinaria, 14, 23-33. http://doi.org/10.5829/idosi.
gv.2015.14.01.91188.
Iqbal, M. A., Iqbal, A., Ayub, M. and Akhtar, J. (2016). Comparative
study on temporal and spatial complementarity and profitability
of forage sorghum-soybean intercropping systems. Custos &
Agronegocio, 12, 2-18.
Li, L., Sunc, J., Zhang, F., Li, X., Yang, S. and Rengel, Z. (2001). Wheat/
maize or wheat/soybean strip intercropping, I Yield advantage and
interspecific interactions on nutrients. Field Crops Research, 71,
123-137. http://dx.doi.org/10.1016/S0378-4290(01)00156-3.
Mucheru-Muna, M., Pypers, P., Mugendi, D., Kungu, J., Mugwe, J.,
Merckx, R. and Vanlauwe, B. (2010). A staggered maize-legume
intercrop arrangement robustly increases crop yields and economic
returns in the highlands of Central Kenya. Field Crops Research,
115, 132-139. http://dx.doi.org/10.1016/j.fcr.2009.10.013.
Naeem, M., Cheema, Z. A., Ahmad, A. U. H., Wahid, A., Farooq,
O., and Rehman, H. S. U. (2013). Agro-economic assessment of
wheat (Triticum aestivum) canola (Brassica napus) intercropping systems under different spatial patterns. International Journal of
Agriculture and Biology, 15, 1325-1330.
Nielsen, D. (2011). Forage soybean yield and quality response
to water use. Field Crops Research, 124, 400-407. http://dx.doi.
org/10.1016/j.fcr.2011.07.007.
Rao, S. H., Mayeux, and Northup, B. (2005). Performance of forage
soybean in Southern great plains. Crop Science, 45, 1973-1977.
http://doi.org/10.2135/cropsci2004.0598.
Seiter, S. C., Altemose, and Davis, M. (2004). Forage soybean yield
and quality response to plant density and row distance. Agronomy
Journal, 96, 966-970. http://dx.doi.org/10.2134/agronj2004.0966.
Sheaffer, C., Orf, J., Devine, T. and Jewett, J. (2001). Yield and quality
of forage soybean. Agronomy Journal, 93, 99-106. http://dx.doi.