Molecular mapping of quantitative trait loci
for agronomical traits in soybean under Asian
soybean rust infection
João Vitor Maldonado dos Santos
1,2, Naoki Yamanaka
3,
Francismar Corrêa Marcelino-Guimarães
1,2*, José Francisco
Ferraz de Toledo
4, Carlos Alberto Arrabal Arias
1,2and Ricardo
Vilela Abdelnoor
1Abstract: Asian soybean rust (ASR) is one of the most serious diseases for soy-bean crops, and it can be responsible for severe yield reduction. Due to the low durability of vertical resistance, studies on horizontal resistance are important for breeding programs. The objective of this study was to identify quantitative trait loci (QTLs) related to ASR horizontal resistance. A genetic linkage map with 26 groups was generated for simple sequence repeat (SSR) and single nucleotide polymorphism (SNP) markers from 163 recombinant inbred lines (RILs). We found 13 QTLs related to 12 traits, including eight directly related to plant resistance. Furthermore, two QTLs controlling more than one trait were observed: one was related to agronomical traits, and another was related to a similar region of the Rpp3 locus associated with the number of uredinia and sporulation levels. These results will be useful for breeding programs to gener -ate cultivars resistant to ASR.
Keywords: Glycine max, Phakopsora pachyrhizi, polygenic resistance, genetic linkage map, molecular markers.
Crop Breeding and Applied Biotechnology 18: 390-398, 2018 Brazilian Society of Plant Breeding. Printed in Brazil
http://dx.doi.org/10.1590/1984-70332018v18n4a58
ARTICLE
*Corresponding author:
E-mail: [email protected]
Received: 15 January 2018 Accepted: 20 August 2018
1 Empresa Brasileira de Pesquisa Agro -pecuária, Embrapa Soja, 86.001-970, Lond -rina, PR, Brazil 2 Universidade Estadual de Londrina, Celso Garcia Cid Road, km 380, 86.057-970, Lond
-rina, PR, Brazil 3 Japan International Research Center for Agricultural Sciences (JIRCAS), 1-1 Ohwashi, Tsukuba, Ibaraki 305-8686, Japan
4 Nidera Sementes Ltd., MT 242, km 20,
73.850-000, Sorriso, MT, Brazil
INTRODUCTION
Asian soybean rust (ASR) is one of the most economically significant diseases of soybean crops and is caused by the fungus Phakopsora pachyrhizi (Sydow and Sydow). It was first reported in 1903 in Japan (Hennings 1903), and since then, it has spread from Asia to Africa (Rytter et al. 1984), South America (Yorinori et al. 2005) and North America (Schneider et al. 2005). It is estimated that ASR has already caused losses of more than US$ 17 billion since its first appearance in Brazil (Consorcio Antiferrugem 2014).
Some strategies may be considered to control this disease. The use of fungicide, the adoption of a host-free period, and the use of resistant cultivars are considered the best strategies to decrease the influence of the pathogen on crop production (Yorinori 2008). However, the most desirable solution for ASR control is the use of resistant cultivars. Seven resistance loci against ASR have already been mapped: Rpp1 (Hyten et al. 2007), Rpp2 (Silva et al. 2008), Rpp3
(Hyten et al. 2009), Rpp4 (Silva et al. 2008), Rpp5 (Garcia et al. 2008), Rpp6 (Li
have frequently been observed to be overpowered by the fungus (Hartman et al. 2005). Thus, the presence of major resistance loci does not represent the ultimate solution to ASR. Therefore, cultivars with horizontal resistance can be very useful in a soybean breeding program against ASR because horizontal resistance can delay and/or reduce the potential for growth and sporulation of the pathogen. However, there is a lack of information about horizontal resistance against ASR. Thus, the objective of this study was to identify QTLs related to horizontal resistance under ASR infection.
MATERIAL AND METHODS
Plant materials
One hundred and sixty recombinant inbred lines (RILs) derived from a cross between soybean cultivars BRS 231 (tolerant to ASR) and BRS 184 (susceptible to ASR) (Yamanaka et al. 2010) were originated by advancing the generation
from F
2 to F8:9 through single seed descent (SSD). The RIL population and parental lines were used for phenotypic and
molecular analyses.
Phenotypic evaluation in the field
The experiment was conducted at the Embrapa Soja, located in Londrina, Parana, Brazil (lat 23° 19’ S, long 51° 18’ W and alt 629 m asl). Nine hundred plants were arranged in a completely randomized design (CRD), with 5 replicates for each of the 163 RILs and 50 replicates for each parental variety, using the hill plot model. Between useful experimental rows, two border rows of the soybean cultivar ‘BRSMS Bacuri’ were sown to ensure the presence of an inoculum of ASR and to help the natural dispersion of the pathogen in the experimental rows.
We used the ASR pathogen Brazilian rust population-1 (BRP-1) (Yamanaka et al. 2010) in the present study. The urediniospores were suspended and diluted to 104 spores mL−1 with distilled H
2O and Tween, and they were sprayed on
the border rows and around the experimental area to increase the ASR infection pressure. This artificial inoculation was performed when most of the plants reached the developmental stage R1. The plants were evaluated for the following
agronomical traits: flowering date (FD), plant height on FD (HF), plant height during the seed harvest (HH), number of nodes (NN), total seed weight of a single plant (SW) and weight of 100 seeds (W100). All the plants were also evaluated for ASR severity (SEV) twenty days after the observation of the first ASR symptoms based on a diagrammatic scale (Godoy et al. 2006). Additionally, flower color (W1 locus) and pubescence color (T locus) were evaluated in the RIL population to include morphological markers with the genetic markers.
Evaluation of the resistance to soybean rust in the growth chamber
For this experiment, we used a Japanese rust population (JRP) used in a previous study (Yamanaka et al. 2010). The experiment was performed at the Japan International Research Center for Agricultural Sciences (JIRCAS) located in Tsukuba, Ibaraki, Japan (lat 36° 05’ N, long 140° 09’ E and alt 25 m asl). A set of 86 RILs were randomly selected and grown along with parental lines in pots of three plants for each line that were filled with soil from the field. The plants were grown in a growth chamber at 24 °C under a 14-h light photoperiod. The pot locations in the growth chamber were completely randomized, with 30 replicates for each of the RILs. The plants were cultivated and inoculated with spore suspension at the V3 growth stage.
The spore suspension was spread homogenously on the abaxial surface of the first trifoliate leaves with a paintbrush. All plants were covered by plastic bags for 24 h to maintain high humidity and thus promote fungal infection, and they were maintained in the growth chamber for 13 days until the evaluation. The traits evaluated were lesion color (LC), number of uredinia per lesion (NU), total number of opened uredinia per lesion (TOU), frequency of open uredinia (%OU) and sporulation level (SL), as described in a previous study (Yamanaka et al. 2010).
SSR and SNP marker analysis
A large number of SSR markers developed by Song et al. (2004) were used in this study. The polymorphic SSR markers between the parental lines were used to analyze the RIL population according to the PCR protocol described by Silva et al. (2008) with 10% polyacrylamide gel electrophoresis and ethidium bromide staining. In addition, a panel of 192 SNPs spread over the 20 soybean chromosomes was used in the GoldenGate platform from Illumina (Hyten et al. 2010). The SNP markers were analyzed with the BeadXpress genotyping kit VC-201-0384 (Illumina Inc., San Diego, CA, USA).
Linkage map construction and QTL identification
The goodness-of-fit between the observed and expected segregation ratios of the genotypes of the SSR and SNP markers in the RIL population was tested using chi-square analysis. A genetic linkage map with the SSR and SNP markers was generated in the MAPMAKER/EXP program version 3.0 (Lander et al. 2009) with the Kosambi mapping function, a minimum logarithm of the odds (LOD) score of 3.0, and a maximum genetic distance for linkage map construction of 37.2 cM. The QTL Cartographer program version 1.17 (Basten et al. 1994) was used to identify QTLs for the analyzed traits using the Composite Interval Mapping (CIM) method through the Zmapqtl and JZmapqtl modules. Forward regression with a backward elimination step at the end was u with a walking speed of 0.5 cM for Model 6. The LOD score threshold for declaring a putative locus as significant was determined by permutation testing using 1,000 permutations and a significance alpha level of 0.05. The threshold level of the LOD score was set at: SEV = 2.81, SL = 2.82, NN = 2.86, W100 = 2.87, TOU = 2.89, NU = 2.94, FD and LC = 2.95, SW = 2.96, HF = 3.00, %OU and HM = 3.12. The positions of the QTLs were defined as the peaks of the maximum LOD score.
Statistical analysis
To determine whether the differences in the data collected in the experimental field and growth chamber were significant among RIL individuals, analysis of variance (ANOVA) was performed in the SAS program (SAS Institute 2004). In addition, Pearson correlations between traits evaluated in the field and growth chamberwere calculated.
RESULTS AND DISCUSSION
Phenotypic evaluation
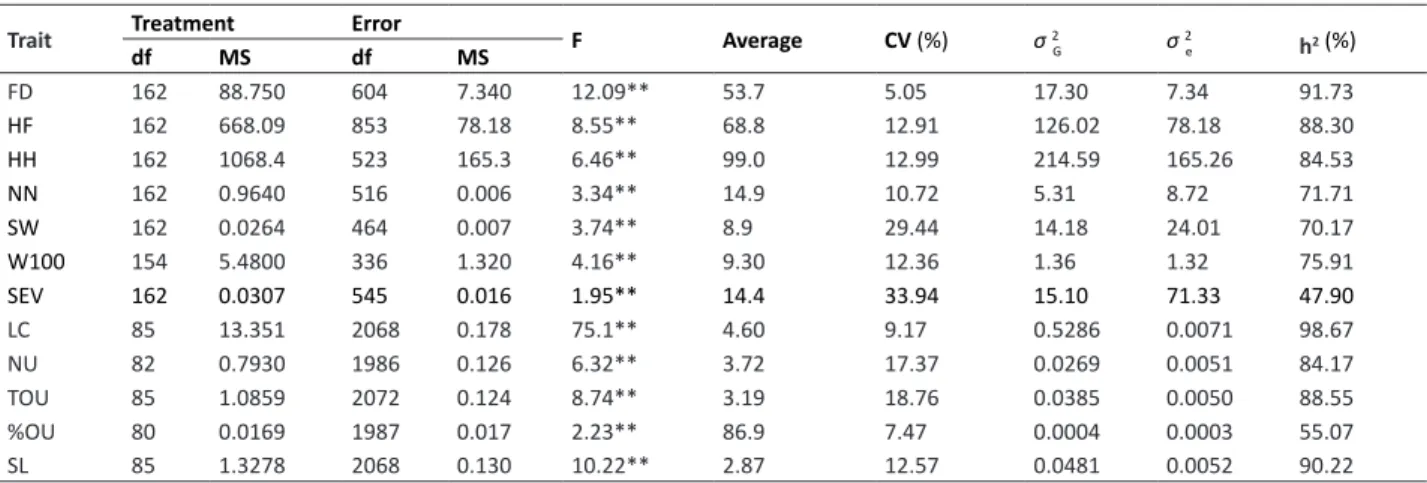
Significant differences among individuals were detected for all of the studied traits (Table 1). The coefficient of variation (CV) and heritability showed that SW and SEV were strongly affected by environmental factors. Previous studies involving hill plots have shown high CV values (25.13) (Ribeiro et al. 2009a), which demonstrates that hill plot experiments could increase the experimental error due to individual evaluation. To remedy this, future studies should include more
Table 1. Results of the analysis of variance (ANOVA) for the data collected in the field and growth chamber among the RILs
Trait Treatment Error F Average CV (%) σ2
G σ
2
e h2 (%)
df MS df MS
FD 162 88.750 604 7.340 12.09** 53.7 5.05 17.30 7.34 91.73
HF 162 668.09 853 78.18 8.55** 68.8 12.91 126.02 78.18 88.30
HH 162 1068.4 523 165.3 6.46** 99.0 12.99 214.59 165.26 84.53
NN 162 0.9640 516 0.006 3.34** 14.9 10.72 5.31 8.72 71.71 SW 162 0.0264 464 0.007 3.74** 8.9 29.44 14.18 24.01 70.17
W100 154 5.4800 336 1.320 4.16** 9.30 12.36 1.36 1.32 75.91
SEV 162 0.0307 545 0.016 1.95** 14.4 33.94 15.10 71.33 47.90
LC 85 13.351 2068 0.178 75.1** 4.60 9.17 0.5286 0.0071 98.67 NU 82 0.7930 1986 0.126 6.32** 3.72 17.37 0.0269 0.0051 84.17 TOU 85 1.0859 2072 0.124 8.74** 3.19 18.76 0.0385 0.0050 88.55 %OU 80 0.0169 1987 0.017 2.23** 86.9 7.47 0.0004 0.0003 55.07 SL 85 1.3278 2068 0.130 10.22** 2.87 12.57 0.0481 0.0052 90.22
σ 2
G: Genetic variance; σ 2e: Environmental variance;
h2 (%): Heritability; FD: Flowering date; HF: Plant height on flowering date; HH: Plant height during seed harvest; NN:
Number of nodes; SW: Total seed weight of single plant; W100: Weight of 100 seeds; SEV: Severity; LC: Lesion color; NU: Number of uredinia per lesion; TOU: Total number
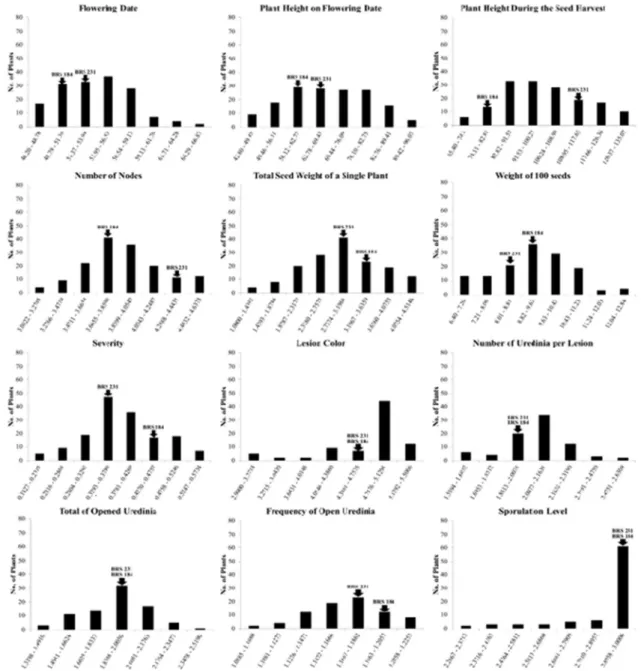
replicates for each RIL. Furthermore, we observed low values of heritability for the SEV trait in the RIL population in other studies (Ribeiro et al. 2009b), which highlights the influence of the environment on this trait. We also detected a low heritability for %OU; however, a low CV value was observed. A normal distribution was observed for most of the traits, except for LC and SL. For all the traits, transgressive segregation in the RIL population was observed (Figure 1).
We found some traits with significant correlation in our study (Table 2). The negative correlation between FD and SW/W100 observed in this study may suggest that plants with a short life cycle are able to avoid yield reduction by ASR. This type of mechanism could be a form of horizontal resistance based on an escape mechanism or an unfavorable environment for the development of diseases. Several studies have been conducted in soybean related to plant disease escape mechanisms against important soybean diseases (Boland and Hall 1987, Kim et al. 1999, Kim and Diers 2000); these may be important mechanisms for a plant’s horizontal resistance against pathogen attack.
We also observed a significant correlation among the traits evaluated in the growth chamber. NU and TOU presented the highest positive correlation value in the study. This result might indicate that most of the observed uredinia were opened. Furthermore, SL showed high correlation with most of the traits evaluated in the growth chamber. According to the results, we suggest that plants with a light LC, a high NU, and a high TOU tend to have a high SL. Yamanaka et al. (2010) showed the existence of a relationship between susceptibility or resistance and SL, which demonstrated the importance of this trait in identifying resistant plants. %OU was the only trait with no correlation with SL. In contrast, it was demonstrated that %OU was highly related to SL in plants. However, the previous correlation analysis involved soybean genotypes with vertical resistance to ASR and susceptible lines. Thus, %OU may not have a large influence on ASR horizontal mechanisms.
Construction of a genetic linkage map and QTL detection
A genetic linkage map was constructed with a total of 160 molecular markers (99 SSR markers and 61 SNP markers) and two morphologic markers (W1 for flower color and T1 for pubescence color) using 163 RILs (Figure 2). These markers were anchored and resulted in a map representing 19 out of the 20 chromosomes. It was not possible to generate a linkage map for chromosome 11 due to the large distance between the analyzed markers. The total length of the linkage groups was 1,205.20 cM. The expected ratio of the F7:8 RILs (1:1) was observed for all 162 markers, with no influence of
segregation distortion on the genetic map constructed in this study (Supplementary Table 1).
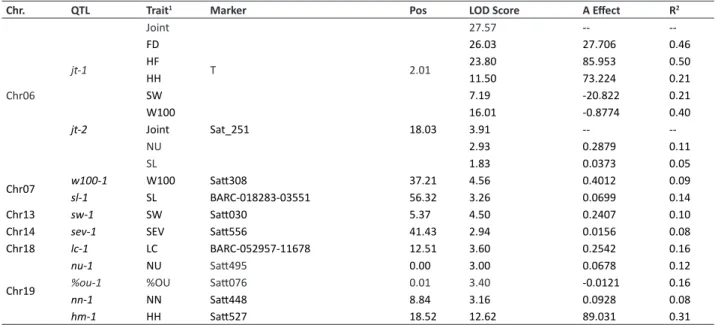
A total of 11 QTLs were identified that were related to most of the traits evaluated in this study. A summary of all the detected QTLs is shown in Table 3.Two QTLs, jt-1 and jt-2 (jt for joint trait), which were responsible for five and two traits,
respectively, were identified in LG 6 (Figure 3a). The first QTL (jt-1) was responsible for controlling most of the studied agronomical traits under ASR infection, except for NN (Figure 3b). According to the SoyBase Genome Browser (Grant et al. 2009), jt-1 was mapped between base pair (bp) 18,534,682 and bp 27,940,564. The E1 gene (Glyma06g23026), which is responsible for controlling maturity and photoperiodic flowering in soybean (Watanabe et al. 2004), is located between bp 20,006,928 and bp 20,007,814. Therefore, there is evidence that jt-1 could be influenced or controlled by the E1 gene. The other QTL (jt-2) was identified on chromosome 6 between Sat_251 (bp 39,704,482) and Satt708 (bp 40,461,941), and it was correlated to two traits directly related to ASR resistance: NU and SL (Figure 3c). In other studies, this interval has been described as containing the Rpp3 loci in resistant cultivars (Monteros et al. 2007, Hyten et al. 2009, Hossain et al. 2015). Recently, a QTL was identified between the Sat_251 (bp 39,704,482) and Satt307 (bp 46,820,673) markers controlling NU and SL in a resistant cultivar, PI 416764 (Hossain et al. 2015). Our results associated with previous studies suggest that there are other genes in this region controlling ASR horizontal resistance in plants, and jt-2 might be related to a horizontal resistance mechanism under ASR infection in BRS 231.
Overall, nine other QTLs were identified in this study. Five independent QTLs were detected that were related to ASR resistance traits, including %OU, LC, NN, SEV, and SL. The ASR resistance QTLs sl-1, sev-1, lc-1, %ou-1, and nn-1
Table 2.Pearson correlations among traits in recombinant inbred lines (RILs) analyzed in the field and growth chamber
Trait1 HF HH NN SW W100 SEV LC NU TOU %OU SL
FD 0.84** 0.43** -0.004 -0.48** -0.47** 0.07 0.00 0.24* 0.17 -0.08 0.01
HF - 0.56** 0.11* -0.38** -0.42** 0.07 0.07 0.26* 0.17 -0.16 0.04
HH - - 0.48** -0.21* -0.25** 0.07 0.12 0.15 0.06 -0.26* 0.02
NN - - - 0.13** -0.13* -0.04 0.06 0.10 0.03 -0.16 0.11
SW - - - - 0.46** -0.15* 0.06 -0.03 -0.02 -0.01 0.10
W100 - - - -0.13* -0.10 -0.10 -0.05 -0.12 -0.02
SEV - - - -0.09 0.06 0.03 0.04 -0.15
LC - - - 0.34** 0.30** -0.13 0.68**
NU - - - 0.93** -0.10 0.58**
TOU - - - 0.30** 0.58**
%OU - - - -0.10
SL - - -
were observed on chromosomes 7, 14, 18, and 19. The marker Satt495 (bp 650,288) associated with nn-1 was found inside two genes: Glyma.19G006900 (a cinnamoyl CoA reductase-like protein) and Glyma.19G007100. There is no functional information about these genes from other studies; thus, it may be valuable for future studies to validate the influence of these genes on the NU trait. Moreover, we also observed that Satt554 (bp 39,252,658), related to sev-1,
was near Glyma.14G162100 (a protein phosphatase 2C). In this particular region, the presence of a QTL related to seed isoflavone content (Han et al. 2015) was previously described. It was demonstrated in another study that isoflavone plays an important role in soybean resistance against ASR, especially in limiting the growth of the pathogen (Lygin et al. 2009). Thus, future studies should validate whether these genes influence the QTLs identified in our study. Finally, we identified four QTLs associated with agronomical traits under ASR infection. In LG 13 (Chr13), we identified sw-1,
which controls seed weight. This QTL was detected in an interval that was previously described as containing a QTL controlling SW under drought treatment with an LOD score of 3.3 (Specht et al. 2001). Another study involving an F6:11 RIL population detected a QTL controlling flooding tolerance inside this interval, and it was responsible for 16% of the phenotypic variation observed in this population (Cornelious et al. 2005). Therefore, sw-1 might be the same QTL as that observed in plants of different genetic backgrounds in other studies, but it may be associated with the same trait under conditions of stress.
Additional QTLs not listed in Table 3 may be present in this population, since the genome coverage of our map was low. To improve the precision and reliability of the results obtained in this study and to discover new QTLs, more molecular markers should be used to increase the saturation of some chromosomes with low coverage in future studies. However, this is an important report of a QTL associated with ASR resistance in an interval similar to that of Rpp3. There was no evidence of known Rpp genes in the parental
lines in previous diallel cross studies (Pierozzi et al. 2008). The identification of this QTL controlling more than one trait related to ASR infection demonstrates the importance of other genes that confer horizontal resistance in soybean. Moreover, the other seven new QTLs directly associated with ASR resistance may represent new sources of horizontal resistance in soybean. These new QTLs in regions that were not previously known for ASR resistance mechanisms might also be important targets for future studies.
ACKNOWLEDGEMENTS
We thank the Embrapa Soja team and the JIRCAS team for all of the technical and financial support for this study. This study was also supported by the Coordenação de Aperfeiçoamento de Pessoal de Nível Superior (CAPES) and the Financiadora de Estudos e Projetos (FINEP).
Table 3. Summary of the QTLs identified under ASR infection in the field experiment and growth chamber analysis
Chr. QTL Trait1 Marker Pos LOD Score A Effect R2
Chr06
jt-1
Joint
T 2.01
27.57 --
--FD 26.03 27.706 0.46
HF 23.80 85.953 0.50
HH 11.50 73.224 0.21
SW 7.19 -20.822 0.21
W100 16.01 -0.8774 0.40
jt-2 Joint Sat_251 18.03 3.91 --
--NU 2.93 0.2879 0.11
SL 1.83 0.0373 0.05
Chr07 w100-1 W100 Satt308 37.21 4.56 0.4012 0.09
sl-1 SL BARC-018283-03551 56.32 3.26 0.0699 0.14
Chr13 sw-1 SW Satt030 5.37 4.50 0.2407 0.10
Chr14 sev-1 SEV Satt556 41.43 2.94 0.0156 0.08
Chr18 lc-1 LC BARC-052957-11678 12.51 3.60 0.2542 0.16
Chr19
nu-1 NU Satt495 0.00 3.00 0.0678 0.12
%ou-1 %OU Satt076 0.01 3.40 -0.0121 0.16
nn-1 NN Satt448 8.84 3.16 0.0928 0.08
hm-1 HH Satt527 18.52 12.62 89.031 0.31
Chr.: Correspondent chromosome; Marker: Nearest marker of the mapped QTL; Pos: Maximum LOD-Score peak position in cM; A Effect: Estimate of additive effect under H1
(a ≠ 0, d = 0); R2: Coefficient of determination calculated based on the nearest marker by regression analysis.; Joint: Joint trait. 1 See code in Table 1.
Figure 3. Chromosome 6 and the two QTLs controlling multiple
REFERENCES
Basten CJ, Weir BS and Zeng Z-B (1994) Zmap–a QTL cartographer. In Smith C, Gavora JS, Benkel B, Chesnais J, Fairfull W, Gibson JP, Kennedy BW and Burnside EB (eds) Proceedings of the 5th world congress on genetics applied to livestock production: computing strategies and software, Organizing Committee of 5th World Congress on Genetics Applied to Livestock Production, Guelph, Ontario, p. 65-66. Boland GJ and Hall R (1987) Evaluating soybean cultivars for resistance
to Sclerotinia sclerotiorum under field conditions. Plant Disease 71: 934-936.
Childs SP, King ZR, Walker DR, Harris DK, Pedley KF, Buck JW, Boerma HR and Li Z (2018) Discovery of a seventh Rpp soybean rust resistance
locus in soybean accession PI 605823. Theoretical and Applied
Genetics 131: 27-41.
Consorcio Antiferrugem (2014) Parceria público-privada no combate
a ferrugem asiática da soja. Avaliable at <https://www. consorcioantiferrugem.net/>. Accessed on 1th Oct, 2014.
Cornelious B, Chen P, Chen Y, De Leon N, Shannon JG and Wang D (2005) Identification of QTLs underlying water-logging tolerance in soybean.
Mol Breed 16: 103-112.
Garcia A, Calvo ÉS, De Souza Kiihl RA, Harada A, Hiromoto DM and Vieira LGE (2008) Molecular mapping of soybean rust (Phakopsora pachyrhizi) resistance genes: Discovery of a novel locus and alleles.
Theoretical and Applied Genetics 117: 545-553.
Godoy C V, Koga LJ and Canteri MG (2006) Diagrammatic scale for assessment of soybean rust severity. Fitopatologia Brasileira 31:
63-68.
Grant D, Nelson RT, Cannon SB and Shoemaker RC (2009) SoyBase, the
USDA-ARS soybean genetics and genomics database. Nucleic Acids
Research 38: 843-846.
Han Y, Teng W, Wang Y, Zhao X, Wu L, Li D and Li W (2015) Unconditional and conditional QTL underlying the genetic interrelationships between soybean seed isoflavone, and protein or oil contents. Plant Breeding 134: 300-309.
Hartman GL, Miles MR and Frederick RD (2005) Breeding for resistance to soybean rust. Plant Disease 89: 664-666.
Hennings P (1903) Some new Japanese uredinales. Hedwiga 4: 107-108.
Hossain MM, Akamatsu H, Morishita M, Mori T, Yamaoka Y, Suenaga K, Soares RM, Bogado a N, Ivancovich JG and Yamanaka N (2015) Molecular mapping of Asian soybean rust resistance in soybean
landraces PI 594767A, PI 587905 and PI 416764. Plant Pathology
64: 147-156.
Hyten DL, Choi IY, Song Q, Specht JE, Carter TE, Shoemaker RC, Hwang EY, Matukumalli LK and Cregan PB (2010) A high density integrated genetic linkage map of soybean and the development of a 1536 universal soy linkage panel for quantitative trait locus mapping. Crop Science 50: 960-968.
Hyten DL, Hartman GL, Nelson RL, Frederick RD, Concibido VC, Narvel JM
and Cregan PB (2007) Map location of the Rpp1 locus that confers resistance to soybean rust in soybean. Crop Science 47: 837-840.
Hyten DL, Smith JR, Frederick RD, Tucker ML, Song Q and Cregan PB (2009) Bulked segregant analysis using the goldengate assay to locate the Rpp3 locus that confers resistance to soybean rust in soybean. Crop Science 49: 265-271.
Keim P, Olson TC, Shoemaker RC (1988) A rapid protocol for isolating DNA.
Soybean Genetics Newsletter 15: 150-152.
Kim HS and Diers BW (2000) Inheritance of partial resistance to Sclerotinia stem rot in soybean. Crop Science 40: 55-61.
Kim HS, Hartman GL, Manandhar JB, Graef GL, Steadman JR and Diers BW (2000) Reaction of soybean cultivars to sclerotinia stem rot in field, greenhouse, and laboratory evaluations. Crop Science 40: 665-669.
Kim HS, Sneller CH and Diers BW (1999) Evaluation of soybean cultivars for resistance to sclerotinia stem rot in field environments. Crop Science 39: 64-68.
Lander ES, Green P, Abrahamson J, Barlow A, Daly MJ, Lincoln SE and Newberg LA (1987) MAPMAKER: An interactive computer package for constructing primary genetic linkage maps of experimental and natural populations. Genomics 1: 174-181.
Li S, Smith JR, Ray JD and Frederick RD (2012) Identification of a new soybean rust resistance gene in PI 567102B. Theoretical and Applied Genetics 125: 133-142.
Lygin AV, Li S, Vittal R, Widholm JM, Hartman GL and Lozovaya VV (2009) The importance of phenolic metabolism to limit the growth of Phakopsora pachyrhizi. Phytopathology 99: 1412-1420.
Monteros MJ, Missaoui AM, Phillips DV, Walker DR and Boerma HR (2007) Mapping and confirmation of the “hyuuga” red-brown lesion resistance gene for Asian soybean rust. Crop Science 47: 829-834.
Pierozzi PHB, AS, Moreira JUV, Laperuta LDC, Rachid BF, Lima WF, Arias
CAA, Oliveira MF and Toledo JFF (2008) New soybean (Glycine max
Fabales, Fabaceae) sources of qualitative genetic resistance to Asian soybean rust caused by Phakopsora pachyrhizi (Uredinales, Phakopsoraceae). Genetics and Molecular Biology 31: 505-511.
Ribeiro AS, Toledo JFF and Ramalho MAP (2009a) Interference of genotypes x environments interaction in the genetic control of resistance to Asian rust soybean. Pesquisa Agropecuária Brasileira
44: 1160-1167.
Ribeiro AS, Toledo JFF and Ramalho MAP (2009b) Selection strategies of segregant soybean populations for resistance to Asian rust. Pesquisa
Agropecuária Brasileira 44: 1452-1459.
Rytter JL, Dowler WM and Bromfield KR (1984) Additional alternative hosts of Phakopsora pachyrhizi, causal agent of soybean rust. Plant Disease 68: 818-819.
SAS Institute (2004) SAS/STAT ® 9.1 user’s guide. SAS Institute Inc., Cary,
NC, 5136.
JR, Levy L and DeVries-Paterson R (2005) First report of soybean rust caused by Phakopsora pachyrhizi in the continental United States.
American Phytopathological Society 89: 774.
Silva DCG, Yamanaka N, Brogin RL, Arias CAA, Nepomuceno AL, Di Mauro AO, Pereira SS, Nogueira LM, André AL and Abdelnoor R V (2008) Molecular mapping of two loci that confer resistance to Asian rust in soybean. Theoretical and Applied Genetics 117: 57-63.
Song QJ, Marek LF, Shoemaker RC, Lark KG, Concibido VC, Delannay X, Specht JE and Cregan PB (2004) A new integrated genetic linkage map of the soybean. Theoretical and Applied Genetics 109: 122-128.
Specht JE, Chase K, Macrander M, Graef GL, Chung J, Markwell JP, Germann M, Orf JH and Lark KG (2001) Soybean response to water: A QTL analysis of drought tolerance. Crop Science 41: 493-509.
Watanabe S, Tajuddin T, Yamanaka N, Hayashi M and Harada K (2004) Analysis of QTLs for reproductive development and seed quality traits in soybean using recombinant inbred lines. Breeding Science
54: 399-407.
Yamanaka N, Yamaoka Y, Kato M, Lemos NG, Passianotto ALDL, Santos JVM, Benitez ER, Abdelnoor RV, Soares RM and Suenaga K (2010) Development of classification criteria for resistance to soybean rust and differences in virulence among Japanese and Brazilian rust populations. Trop Plant Pathology 35: 153-162.
Yorinori JT (2008) Soybean germplasms with resistance and tolerance to Asian rust and screening methods. In Kudo H, Suenaga K, Soares RM and Toledo A (eds) JIRCAS working rep no. 58: facing the challenge of
soybean rust in South America. Japan International Research Center
for Agricultural Sciences (JIRCAS), Tsukuba, p. 70-87.
Yorinori JT, Soja E, Paiva WM, Miranda C, Frederick RD, Ars U, Science FD, Ave D, Detrick F, Costamilan LM, Bertagnolli PF, Hartman GE, Godoy CV and Nunes Jr. J (2005) Epidemics of soybean rust (Phakopsora pachyrhizi) in Brazil and Paraguay from 2001 to 2003. American Phytopathological Society 89: 2005.