Estimation of the traction power of agricultural tractors from dynamometric tests
Estimativa da potência em tração de tratores agrícolas a partir de testes dinamométricos Alexandre Russini1 José Fernando Schlosser2 Marcelo Silveira de Farias3*
ISSNe 1678-4596
INTRODUCTION
The power and fuel consumption of agricultural tractors can be obtained at the power take-off (PTO) by using a brake dynamometer. In turn, the tractive performance of a tractor is obtained by performing a drawbar test, in which the tractor pulls a given load across a concrete track (SILVEIRA & SIERRA., 2010). In this regard, according to ZOZ & GRISSO (2003), the main factor to be observed for tractors is the drawbar performance, which, according to MONTEIRO et
al. (2011), is a parameter used for comparing and evaluating agricultural tractors.
According to MONTEIRO et al. (2013), the tractor test on agricultural soil is one way of obtaining information about a tractor, especially about its tractive performance. In addition, the drawbar performance can be used to evaluate and/or compare tractors. However, the drawbar performance is affected by the conditions of the work surface, the gear ratio, and the ratio of the tractor’s mass to its power.
Poor drawbar performance is caused by factors such as the soil type, mass distribution on
1Universidade Federal do Pampa (UNIPAMPA), Campus Itaqui, Itaqui, RS, Brasil.
2Departamento de Engenharia Rural (DER), Centro de Ciências Rurais (CCR), Universidade Federal de Santa Maria (UFSM), Santa Maria, RS, Brasil.
3Departamento de Ciências Agronômicas e Ambientais (DCAA), Universidade Federal de Santa Maria (UFSM), 98400-000, Campus Frederico Westphalen, Frederico Westphalen, RS, Brasil. E-mail: silveira_farias@hotmail.com. *Corresponding author.
ABSTRACT: The objective of this research was to predict, fromdynamometric tests, the traction performance of agricultural tractors, without
the need to employ the standard official tests carried out on concrete tracks. The evaluations were conducted at the experimental area of the Universidade Federal de Santa Maria, where an instrumented agricultural tractor was subjected to dynamic field traction tests and static tests in the laboratory, using an eddy currents dynamometer. It can be verified through the correlation analysis between the values obtained and the
estimated values that, based on the prediction equations, a high correlation (r² = 0.99) was obtained between the power observed in the field and the estimated power obtained using dynamometric tests. Based on the analysis of the results obtained in this study, it can be stated that the traction performance of an agricultural tractor can be estimated from dynamometric tests. We concluded that the dynamic field tests can be
replaced by static tests carried out in laboratories, which are generally less expensive.
Key words: traction test, dynamometry, performance.
RESUMO: O objetivo deste trabalho foi prever, a partir de testes dinamométricos, o desempenho em tração de tratores agrícolas, sem
a necessidade de recorrer aos ensaios oficiais normalizados realizados em pistas de concreto. As avaliações foram conduzidas em área experimental, da Universidade Federal de Santa Maria, onde um trator agrícola instrumentado foi submetido a testes dinâmicos de tração, em superfície de campo e testes estáticos, em laboratório, utilizando-se freio dinamométrico elétrico, de correntes de Foucault. Pode-se verificar por meio da análise de correlação entre os valores obtidos e os valores estimados que, com base nas equações de predição, obteve-se alta correlação (r² = 0,99) entre a potência observada em campo e a potência estimada, a partir dos testes dinamométricos. Com base nas análises dos resultados obtidos neste estudo, pode-se afirmar que o desempenho em tração de um trator agrícola pode ser estimado a partir de testes dinamométricos. Conclui-se que, os ensaios dinâmicos em campo podem ser substituídos por ensaios estáticos, realizados em laboratórios, que em geral são menos onerosos.
Palavras-chave: ensaio de tração, dinamometria, desempenho.
into tractive power (MÁRQUEZ, 2012).
The solution found by research institutions to obtain the tractive performance of agricultural tractors was to standardize the tests with the use of concrete tracks (OECD, 2014). The standardization enables the reproduction of tractive performance tests in different locations, always under the same conditions, which allows inferences and comparisons between different tractor brands and models to be made (MACMILLAN, 2002).
An efficient and low-cost alternative to
obtain the tractive performance of agricultural tractors involves using dynamometric tests. These tests provide the characteristic curves of engine performance, i.e.,
curves of torque, power, and specific fuel consumption. The experimentally obtained dynamic coefficients and the scientifically known mathematical equations allow
the estimation of the tractive power of an agricultural
tractor in real field conditions, without using the
traditional traction tests (MÁRQUEZ, 2012).
Hence, this study aimed to predict, by using dynamometric tests, the tractive performance of agricultural tractors, without the need for performing dynamic traction tests on tracks.
MATERIALS AND METHODS
Research tractor
The experiment involved the use of an MF 4297 tractor (Massey Ferguson, Canoas, Brazil) equipped with a four-stroke Diesel cycle engine (AGCO Power, 420 DS) with four cylinders and an engine displacement of 4400cm³, and overfed by a turbocharger. According to the information provided by the manufacturer, the engine provides a maximum power of 88.5kW (120hp) and maximum torque of 460N.m under the ISO TR 14396 standard. The tractor was equipped with R1-type wheels, having a diagonal construction with the following dimensions: front 14.9-28 and rear 23.1-30, where the dynamic radius of the rear wheel set was 0.838m, with activated mechanic front wheel drive (MFWD).
The tractor’s mass was 5,720kg, which was obtained by weighing it on a scale comprising four individual platforms supported under the wheel
be approximately 60kg kW-1.
Experimental test in laboratory
The determination of the values of torque and effective engine power involved the use of MWD electric dynamometric brakes (NL 480, Argentina), with a brake capacity up to 552kW (750hp) of continuous maximum power, and an Oval Flowmate
flow meter (OVAL M-III, LSF 41L) to quantify the
volume of fuel consumed. This equipment has an automatic data acquisition system, wherein data can be viewed and interpreted with the Accudyno® software.
To perform this test, the loads were applied using a potentiometer, requiring only the input of
information about the identification of the test tractor
and the transmission ratio of the engine speed and the PTO. The atmospheric pressure and air temperature were obtained using the atmospheric centerpiece of the brake dynamometer and were used to calculate the correction factor, which was performed automatically by the software.
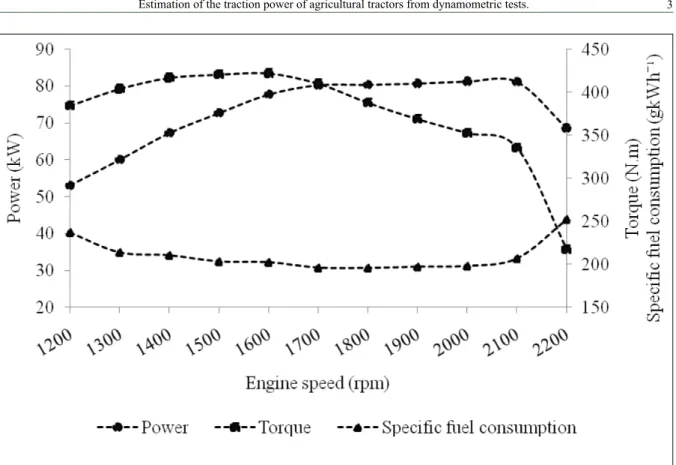
The engine performance curves were determined on the basis of the NBR ISO 1585 (1996)
standard and are shown in figure 1. Values of the torque
and power at each working speed were used for the mathematical estimation of the tractive power, which
were corrected considering the transmission efficiency of 90%. This efficiency was calculated as a function of the
difference between the engine power and torque, informed
by the manufacturer in the official test, and the values
obtained in the present study from the test at the PTO.
Test method and procedure
The methodology involved the
identification and quantification of the factors that
caused power losses, from the engine to the tractor drawbar. The estimation of the tractive power included the use of data such as the tractor’s mass, engine torque
and speed, transmission efficiency, transmission ratio, dynamic radius of wheels, coefficient of rolling, and
slip resistance of the driving wheels.
Mathematical estimation of the tractive power was performed on Microsoft Excel®,version
2016, where the spreadsheets were fed with the
reference parameters that directly influence the
to calculate the behavior of the evaluated tractor in different situations using the characteristic curves of engine performance, which were obtained by performing dynamometric tests without the need to conduct tests on a concrete track.
Equation 1, which is derived from a dynamic analysis of the equilibrium of forces, described by MÁRQUEZ (2012), was used to obtain the drawbar
power, which is directly influenced by the product of
the traction force and the real travel speed.
NB = Q × v = [(Ft – RTk)] × [vt × (1 – δ)] = [(Mm × ηt × it / rdin) – RTk] × [(2 × π × rdin × n / it) × (1 – δ)] (1)
Where: NB = drawbar power (kW); Q = traction force (daN); v = real travel speed (km h-1); Ft =
tangential force of the driving wheel set (daN); RTk = rolling resistance moment (daN); vt = theoretical travel speed (km h-1); δ = drive wheel slip (decimal); Mm =
engine torque at the flywheel (daN.m); ηt = transmission efficiency (decimal); it = ratio of transmission between
engine and driving wheels (dimensionless); rdin =
dynamic radius of driving wheels (m); π = constant
(3.141592); and n = engine speed (rpm).
The transmission ratio was changed for each work gear, resulting in the tractive power for each selected gear, which maintained the constant torque and engine speed obtained in the dynamometric test. Equation 1 does not present the dynamic traction
coefficient, which was obtained using the ratio
between the traction force and the tractor’s adherent
mass. Nevertheless, dynamic traction coefficient value was experimentally obtained on the field and
was used to correct the estimated values of traction power, considering the tractor’s mass.
Experimental field test
Tests to determine the tractor’s tractive
field performance were conducted in the experimental
area at the Universidade Federal de Santa Maria, Santa Maria, RS, Brasil, under a consolidated direct plantation system, with dystrophic Red Acrisol soil, slightly waved and cultivated with black oat (Avena Strigosa), for soil coverage.
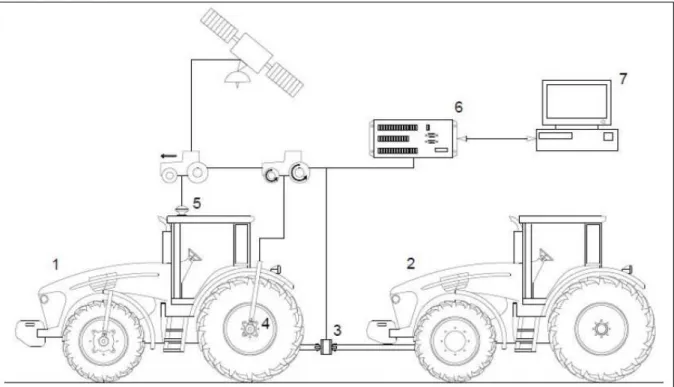
To determine the tractive performance, the electronic instrumentation (Figure 2) developed
Figure 1 – Engine performance curves (power, torque, and specific fuel consumption) of the test tractor, obtained through the dynamometric
(Trimble, AG 150), wherein the GPS delay was corrected by programming the data logger. Traction force was determined by load cell (Alfa, 10T), with 100kN capacity and properly gauged with a precision of 0.01kN. Finally, the driving wheel slip was determined
through inductive sensors fixed on metal supports on
the outer part of the wheel rims, which indicate the rate of the passage of the 32 teeth of a teeth wheel by the sensor, thus indicating its rotation and speed.
To determine the traction force of the tractor, four work gears were used (T1: 2nd low
reduced, T2: 2nd high reduced, T3: 3rd low reduced,
and T4: 3rd high reduced), which corresponded,
respectively, to the following transmission ratios: 169.35, 128.58, 100.63, and 77.15. Transmission ratios for the evaluated work gears were determined by suspending the rear wheel sets of the tractor,
brake tractor with greater power and mass in relation
to the first tractor by selecting a gear that provided a
lower travel speed with activated differential lock. The distance covered in each part was 60m, with no driving wheel slip in the brake tractor. At each part, the rolling resistance was determined by pulling the test tractor with the brake tractor, and adopting the mean value of three observations. Values were obtained by the reading of the load cell, but repositioned in front of the test tractor.
Once the traction power data obtained in
the field experiment were organized in tables, they
were compared with the values estimated by equation 1, where the interrelation between the values obtained in the dynamometric test, with the transmission ratio obtained for the selected gear considering the
dynamic traction coefficient, determining the final
value for the estimation of the traction power.
Experimental and statistical procedures
For statistical analysis, an experiment with randomized block experimental design was considered,
where each treatment consisted of five repetitions.
Then, the response variables (traction force, dynamic
traction coefficient, real travel speed, slip, and drawbar
power) were subjected to the analysis of variance (ANOVA) and Tukey’s test of comparison of means
at 5% significance level by using the Sisvar software,
version 5.3 (FERREIRA, 2011).
Once the data set was confirmed for
normality (Lilliefors test), the Pearson correlation analysis was performed to compare the results obtained
in the field with those estimated using equation 1.
RESULTS AND DISCUSSION
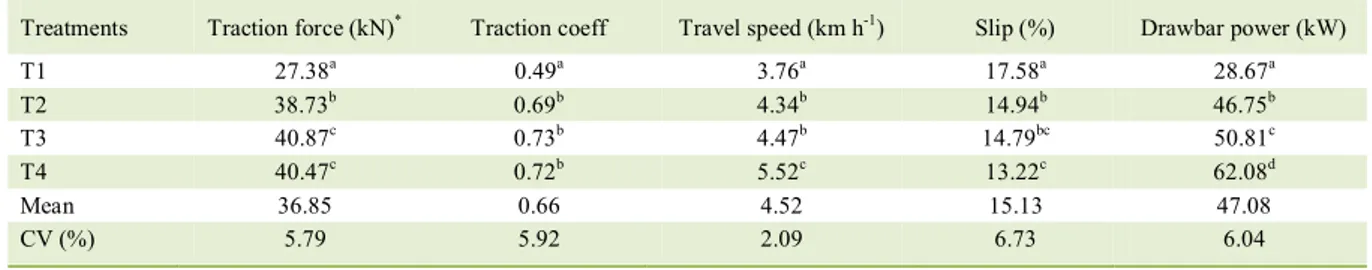
The traction force values at the work gears are presented in table 1. Treatments T3 and T4 did not present differences; however, there was
significant variation for the gear used in treatment
T1, considering that to determine this parameter, the applied load was constant in all treatments.
This difference may be attributed to the high torque values at the driving wheels for this work gear in relation to the tractor’s mass, which considerably
reduces the dynamic traction coefficient, i.e., the
traction force to the adherent mass ratio. Furthermore, the low value of the traction force in treatment T1 (Table 1) may have been caused by the increase in the
driving wheel slip, which could be justified by the high
critical speed (minimum travel speed of the tractor to use power produced by the engine in relation to its mass), given that in this treatment the speed was 6km h-1, which was greater than that in other treatments.
This study did not considered travel speeds greater than the critical speed, because they are not appropriate for most agricultural operations performed in
the field, which demand great traction effort and require
the use of ballasting, which would exceed the maximum established limit according to the manufacturer.
A similar behavior was observed by GABRIEL FILHO et al. (2010) in relation to the drawbar power; they used an agricultural tractor with a power of 88kW and travel speed similar to that used in treatment T1 in this experiment over a surface covered by culture remains, with no mobilization of soil, at the speed of 3.95km h-1, and obtained the traction power
of 27.79kW. In this experiment, the power generated in treatment T1 was 28.67kW (Table 1) for a speed of 3.76km h-1. According to NEUJAHR & SCHLOSSER
(2001), the slip values between 5% and 20% promoted
the highest tractive efficiency.
The increase in slip in the driving wheels caused the decrease in the real travel speed and consequently, in the drawbar power, thereby obtaining the smallest value (28.67kW), which
efficiently transformed the engine power into
traction power of 32%. However, for the other
three evaluated work gears, the mean efficiency
was 55.60%, a result similar to that obtained by MÁRQUEZ (2012) for a similar surface condition with a slip of approximately 8% to 13%.
This behavior could be explained, because, as the travel speed increases, the torque produced in the driving wheels decreases and consequently, so does the slip, thereby increasing the traction force to a certain limit, reaching the critical speed. The mean
rolling resistance value obtained in the field was 4.70kN
(483kgf), which represents 8.40% (k = 0.08) of the total mass of the tractor. This value is within the range of rolling resistance predicted by LINARES et al. (2006) and MÁRQUEZ (2012), which is from 6 to 10%.
The comparison using the analysis of
correlation between the field results and those
estimated with equation 1 is presented in table 2. According to this analysis, there was no variation
between the power observed in the field and the
Table 1 – Mean values of tractive performance parameters, obtained in field experiments.
Treatments Traction force (kN)* Traction coeff Travel speed (km h-1) Slip (%) Drawbar power (kW)
T1 27.38a 0.49a 3.76a 17.58a 28.67a
T2 38.73b 0.69b 4.34b 14.94b 46.75b
T3 40.87c 0.73b 4.47b 14.79bc 50.81c
T4 40.47c 0.72b 5.52c 13.22c 62.08d
Mean 36.85 0.66 4.52 15.13 47.08
CV (%) 5.79 5.92 2.09 6.73 6.04
*
Means followed by the same letters in the column do not differ between each other by Tukey test, considering the nominal value of
estimated power. Analyzing the results (Table 2), there were high correlation values, with a difference smaller than 0.1%.
The equation of the force equilibrium dynamic analysis does not consider the dynamic
traction coefficient; however, for the estimations
performed, this parameter was used, thus justifying
a correlation coefficient greater than 90% for the
conditions of the experiment. Additionally, the
large number of data collected in the field should be
considered, given that the electronic system collected them every 2s, guaranteeing better representativeness during the experiment.
CONCLUSION
The tractive performance of an agricultural
tractor in the field could be estimated quickly and
with high accuracy by using dynamometric tests instead of the traditional dynamic traction tests,
which are considered difficult to perform and require specific instrumentation, thus making them
time-consuming and onerous.
This simulation can be employed by manufacturers and users of agricultural machinery to facilitate project development; selection and design of machinery. Further studies are required to evaluate whether the results are valid for all tractors
or whether they are specific to the brand and model
used in this experiment.
ACKNOWLEDGEMENTS
The authors are grateful to the Conselho Nacional de
Desenvolvimento Científico e Tecnológico (CNPq) for research
productivity scholarship of the second author.
REFERENCES
ABNT NBR ISO 1585. Veículos rodoviários - Código de ensaio de motores - Potência líquida efetiva, Rio de Janeiro, p.9, 1996.
FERREIRA, D.F. Sisvar: a computer statistical analysis system. Ciência e Agrotecnologia, v.35, n.6, p.1039–1042, Nov./Dez. 2011. Available from: <http://www.scielo.br/pdf/cagro/v35n6/ a01v35n6.pdf>. Accessed: May 17, 2017. doi: 10.1590/S1413-70542011000600001.
GABRIEL FILHO, A. et al. Tractor performance in soil with different types of plants covering. Engenharia Agrícola, v.24, n.3, p.781–789, Set./Dez. 2004. Available from: <http://www.scielo. br/pdf/eagri/v24n3/a32v24n3.pdf>. Accessed: Feb. 11, 2017. doi: 10.1590/S0100-69162004000300032.
GABRIEL FILHO, A. et al. Performance of agricultural tractor on three defferent soil surfaces and four forward speeds. Revista Brasileira de Engenharia Agrícola e Ambiental, v.14, n.3, p.333–339, 2010. Available from: <http://www.scielo.br/pdf/rbeaa/ v14n3/v14n03a15.pdf>. Accessed: Mar. 12, 2017. doi: 10.1590/ S0100-69162011000300015.
LINARES, P.; CATALÁN, H.; MÉNDEZ, V. Teoría de la tracción de tractores agrícolas. Madrid: Escuela Técnica Superior de Ingenieros Agrónomos da Universidad Politécnica de Madrid, p.215, 2006.
MACMILLAN, R.H. The Mechanics of Tractor – Implement Performance: Theory and Worked Examples. Melbourne, p.165, 2002.
MÁRQUEZ, L. Tractores Agrícolas: Tecnología y utilización. España: B&H Grupo Editorial, p.844, 2012.
MONTEIRO, L.A. et al. Performance of an agricultural tractor equipped with radial and bias ply tires on three levels of liquid ballast. Engenharia Agrícola, v.31, n.3, p.551–560, Mai./Jun. 2011. Available from: <http://www.scielo.br/pdf/eagri/v31n3/ a15v31n3.pdf>. Accessed: Jan. 8, 2017. doi: 10.1590/S0100-69162011000300015.
MONTEIRO, L.A. et al. Tractor drawbar efficiency at different weight and power ratios. Revista Ciência Agronômica, v.44, n.1, p.70–75, Jan./Mar. 2013. Available from: <http://www.scielo. br/pdf/rca/v44n1/a09v44n1.pdf>. Accessed: Dec. 10, 2016. doi: 10.1590/S1806-66902013000100009.
NEUJAHR, E.B.; SCHLOSSER, J.F. Performance on traction of radial and bias agricultural tires. Engenharia Agrícola, v.21, n.2, p.180–189, Mai. 2001. Available from: <http:// www.ufrrj.br/institutos/it/deng/varella/Downloads/IT154_ motores_e_tratores/Literatura/patinagem_1.pdf>. Accessed: Dec. 10, 2016.
T4 62.08 64.31 40.47 40.38 5.52 5.63
OECD. Organization for Economic Cooperation and Development. CODE 2: Standard code for the official testing of agricultural and forestry tractor performance. Paris, p.104, 2014.
RUSSINI, A. Projeto, construção e teste de instrumentação eletrônica para avaliação do desempenho de tratores agrícolas, 142f, 2009. Dissertação (Mestrado em Engenharia Agrícola) - Universidade Federal de Santa Maria, Santa Maria, RS.
SCHLOSSER, J.F. et al. Comparative analysis of the specific weight
and its effects on the selection and use of the Brazilian wheeled tractors.
Ciência Rural, v.35, n.1, p.92–97, 2005. Available from: <http://www. scielo.br/pdf/cr/v35n1/a14v35n1.pdf>. Accessed: Oct. 31 , 2017.
SILVEIRA, G.M; SIERRA, J.G. Energy efficiency of Brazilian
agricultural tractors. Revista Brasileira de Engenharia Agrícola e Ambiental, v.14, n.4, p.418–424, 2010. Available from: <http:// www.scielo.br/pdf/rbeaa/v14n4/v14n04a11.pdf>. Accessed: Dec. 11, 2016. doi: 10.1590/S1415-43662010000400011.